External income shocks and Turkish exports: A sectoral analysis
☆
M. Hakan Berument
a,1, N. Nergiz Dincer
b,⁎
, Zafer Mustafaoglu
c,2a
Department of Economics, Bilkent University, 06800 Ankara, Turkey
b
Department of Economics, TED University, 06420 Ankara, Turkey
cThe World Bank, 1818H Street, NW, Washington, DC 20433, United States
a b s t r a c t
a r t i c l e i n f o
Article history: Accepted 5 November 2013 Available online xxxx JEL classification: F14 F17 F10 Keywords: Export demand Income of trading partners ISIC-3 sector classificationThis study assesses how the growth rates of Turkish trading partners affected Turkish exports in various sectors for the period 1996:01 to 2009:12. To determine this, we modeled the destination countries and the export demand for each sector separately. Each model is estimated as a system of equations, where each equation represents a country using a seemingly unrelated regression method. The empirical evidence suggests that Motor Vehicles, Basic Metals, and Radio–Television are the sectors with the highest income elasticities for most of the analyzed countries, whereas the Food Products and Beverages sector has the lowest income elasticity. We also performed simulations for the effect of a 1% increase in the growth rate of each country on Turkish exports.
© 2013 Elsevier B.V. All rights reserved.
1. Introduction
Exports greatly contributed to Turkey's high growth rates between 2002 and 2007, with favorable foreign demand the driving factor. This study analyzes the dynamics of export dependence for Turkey, as a middle-income country, on foreign markets, and assesses the impact of its main trading partners' growth performances on its sectoral exports. With the 2008 globalfinancial crisis, Turkish exports (and those of other developing countries) began to decrease. The impact of the crisis was larger in countries with a high level of openness. The export channel affected almost every country, even those with relatively strong econom-ic fundamentals, such as Turkey. The Turkish economy contracted 4.8% in 2009 and exports declined by 5% in real terms. Change in exports varied considerably across sectors: while Food Products and Beverages exports increased by 11%, Motor Vehicle, Trailer, and Semi-Trailer exports re-corded the highest decline, with 31% in real terms.
For the period that we consider, the import growth rate was 5.8% on average in real terms. Imports increased mostly in Textiles and Basic Metals sectors, while exports were mostly driven by Motor Vehicles and Home Appliances.Fig. 1plots the trade openness, measured as the sum of exports and imports divided by GDP. Thefigure clearly
suggests the important role of international trade for the Turkish economy. Especially after the 2001financial crisis, economic openness increased significantly, and hit 45% in 2008. However, following the 2008 crisis, the Turkish economy's international trade volume de-creased due to shrinking global demand.
The objective of this paper is to understand how the shock was distributed across Turkey's export sectors and to determine the level of heterogeneity (or homogeneity) in the ongoing recovery. The speed and sector inclusiveness of the recovery will likely be dependent on which countries recover faster and on the extent of their recovery, for three reasons: (1) for any given exports sector in Turkey, foreign income elasticity may change across countries; (2) the traded basket of goods can change across countries; and (3) the diversity of markets may be very limited for certain goods. A standard total export demand model does not distinguish between these factors. In this paper, rather than assessing the role of how world income or regional income affects do-mestic export performance, we look at the effect of each country's in-come from domestic exports. Moreover, inin-come and price elasticities of Turkish export products are not the same. Thus, higher foreign income and real exchange rates affect domestic export demand for different products differently; this is the second disaggregation that we will incor-porate. To capture country- and sector-specific differences, we will ana-lyze how countries' incomes, real exchange rate, and alternative export market performance affect Turkish export demand at sectoral levels. In this way, we will try to determine how differences in foreign income recovery affect the recovery speed of various Turkish export sectors.
Our results suggest that income elasticities are generally greater than 1, consistent with the literature. This study adds to the literature by highlighting the variation across sectors and countries. To be specific,
☆ The views presented here are those of the authors; they do not necessarily reflect the official position of the World Bank.
⁎ Corresponding author. Tel.: +90 312 585 0038; fax: +90 312 418 4148. E-mail addresses:[email protected](M.H. Berument),
[email protected](N.N. Dincer),[email protected](Z. Mustafaoglu). URL:http://www.bilkent.edu.tr/~berument(M.H. Berument).
1
Tel.: +90 312 290 2342; fax: +90 312 266 5140.
2Tel.: +1 202 458 5431; fax: +1 202 522 2119.
0264-9993/$– see front matter © 2013 Elsevier B.V. All rights reserved.
http://dx.doi.org/10.1016/j.econmod.2013.11.011
Contents lists available atScienceDirect
Economic Modelling
the Basic Metals, Radio and TV, Motor Vehicles, Plastic and Rubber Prod-ucts, Fabricated Metals, and Electrical Machinery (for most of the desti-nation countries) sectors are highly dependent on foreign income, and for the Machinery sector, the income elasticities of developing countries are significantly higher than those of developed countries.
The paper is organized as follows:Section 2reviews the literature
andSections 3 and 4present the data and methodology, respectively.
Section 5discusses the results,Section 6presents the simulations, and
Section 7discusses caveats.Section 8concludes.
2. Literature review
In the early 1980s, Turkey changed its import-substitution economic and political policies to those of openness and liberalization. It lifted quantitative restrictions on trade and adopted an export-oriented growth strategy. Since then, export contribution to Turkey's economic growth has significantly increased.
A wide range of studies estimates export demand and supply func-tions for the purpose of analyzing export income elasticity for various countries. The foreign income variable used in these studies is generally world income demand. The influential Senhadji and Montenegro
(1999)paper estimates the income and price elasticities of exports for
a large group of developed and developing countries, including Turkey. Their resultsfind that income elasticity is approximately 1.5, whereas price elasticity is approximately−1.Fullerton, Sawyer, and
Sprinkle (1999)present a summary of studies on the export functions
of different countries in Latin America and the associated income elas-ticities. Using different methods and over different periods, theyfind that income elasticities vary significantly.Funke and Ruhwedel (2001)
find income elasticity for a group of East Asian countries to be more than 3, whereasFunke and Ruhwedel (2002)estimate income elasticity for OECD countries to be between 2 and 2.5.Akal (2010)finds the income elasticity of Turkish exports for OECD countries to be 1.99 by employing the Parks method for the 1993 to 2007 period.
Another set of studies analyzes other export determinants.
Sahinbeyoglu and Ulasan (1999)estimate export supply and demand
functions for 1987Q1 to 1998Q3 and conclude that traditional export functions were not sufficient to forecast the post-1994 period in Turkey. They note that uncertainty indicators and investments play crucial roles in explaining exports.Aydın et al. (2004)estimate the export supply func-tion for Turkey for 1987 to 2004, andfind export determinants to be real unit labor costs, export prices, and national income. Another group of studies is based on structural changes in exports.Neyaptı et al. (2007)
analyze Turkish exports for 1980 to 2001 andfind that exports improved with the 1996 EU Customs Union agreement.Aydın et al. (2007)focus on 1987 to 2006 but do not identify possible break events, such as that 1996 Customs agreement, nor thefinancial crises that Turkey experienced in 1994, 1999, and 2001.
Various other studies focus on sectoral exports.Nowak-Lehmann
et al. (2007)investigate Turkey's sectoral tradeflows to the EU based
on panel data for 1988 to 2002. They use an extended version of the gravity model and analyze the role of price competition, EU protection, and transport costs. Theyfind that increasing integration with the EU in terms of the Customs Union agreement increased exports.Dincer and
Kandil (2010)estimate sectoral export functions in Turkey to
investi-gate the asymmetric effects of real exchange rate shocks on each sector. They suggest that randomfluctuations in exchange rate away from the equilibrium had a negative net effect on export growth post-2002. Also for Turkey,Saygili (2010)analyzes the role of unit labor costs and indi-vidual cost components in determining sectoral export dynamics and the change in impact of these costs after the above-mentioned structur-al reforms in 2001 for 1995Q1 to 2006Q2. The study suggests that aver-age elasticity changes not only between time periods but also across sectors. Finally,Cosar (2002)calculates price and income elasticities using sectoral and country-specific export demand functions for 1994 to 2000. She calculates the elasticity of aggregate exports with the panel data technique. She also estimates two different sets of functions, one for six export partners and the other for export sectors. Her results suggest that real exchange rate elasticity of the total export demand is less than 1 and that income elasticity is greater than 1.
None of the above studies considers that Turkey's sectoral export de-mand from various countries might be different and could change over time simultaneously. This paper attempts tofill this gap; it analyzes the impact of economic growth in individual trading partner countries on sectoral exports under the assumption that the traded goods basket and sectoral export elasticities differ across countries.
3. Data
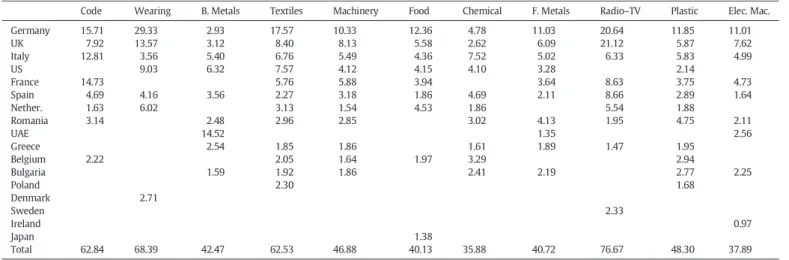
The data on exports in dollars and export price indices are from TURKSTAT's foreign trade database. We use exports in the ISIC-3 sectors in two digits. For each sub-sector, the volume, US dollar, and Turkish lira (TL) value of exports to each destination country are available (for 257 countries, including the free-trade zones) for 1996 to 2009 on a monthly basis. We provide the share of each sector's export of total export averages for 1996 to 2009 inTable 1. InFig. 2, we provide the plot of the sectoral shares of some important sectors for the sample period that we consider. We include sectors whose average share of total ex-ports is equal or greater than 3%. We exclude the smaller sectors from our analysis because we believe they do not significantly affect Turkey's overall export performance. Several observations for Sector 23 (Coke, Refined Petroleum Products, and Nuclear Fuels) are missing, and therefore, we also do not report the analysis for that sector. In the analyses, we use real exports, calculated as each sector's export (in dollars) to a country divided by that sector's export price (in dollars). We calculate real exchange rate data for each country using its ex-change rate relative to the TL, its consumer price indices, and Turkey. 0.0 5.0 10.0 15.0 20.0 25.0 30.0 35.0 40.0 45.0 50.0 1996 1997 1998 1999 2000 2001 2002 2003 2004 2005 2006 2007 2008 2009
Increase in real exchange rate represents depreciation for our real ex-change rate variable. We use the average real exex-change rate for the cur-rent period and two lags to avoid the effect of one-timefluctuations. The data for real exchange rate calculations are from the IMF–IFS database. Industrial production data, which is used as a proxy of real income for each country, are also taken from the IMF–IFS database. As a proxy for the United Arab Emirates (UAE), which does not announce industrial production or consumer price indices, we use the petroleum production index and the United States' (US) CPI All Items City Average, respective-ly. All data are entered into analyses in their logarithmic forms. 4. Model
The goal is to model export demand for each sector separately. Each model is the system of equations for each sector i. The equation is as follows: xi tj ¼ γj iþ α j irer j tþ δ j iY j tþ θ j itrendþ X11 k¼1βk j isktþ u j i t j¼ 1; 2; …; n; ð1Þ where i = exports in the ISIC-3 classification for two digits and j = destination countries of ISIC-3 sector exports. To be precise, for each sec-tor, we estimate a system of equations so that each equation in the system is for a particular country. xijt= real export of the ith product to the jth
country (to calculate the real exports, we deflate USD-denominated ex-portfigures to the sectoral export prices). rerj
t = real exchange rate
with respect to country j (we calculate the real exchange rate with respect to country j as the nominal exchange rate multiplied by country j's consumer price index divided by the Turkish consumer price index; an in-crease represents depreciation). Yjt = income of country j, which is
proxied by industrial production because the data is monthly. sk= the
seasonal dummy for period k. trend = time trend.
We use the seemingly unrelated regression (SUR) method to esti-mate the system of export demand for each sector to the destination countries. A single model may contain a number of linear equations. In such a model it is often unrealistic to expect that the equation errors would be uncorrelated. A set of equations that has contemporaneous cross-equation error correlation (i.e. the error terms in the regression equations are correlated) is called a SUR system. Atfirst glance, the equations seem unrelated, but they are related through the correlation in the errors. Even if ordinary least squares (OLS) estimates are Best Linear Unbiased Estimates, SUR utilizes possible correlations across equations to increase the estimates' efficiency. Thus, compared to OLS, SUR estimates are more efficient.
As the export values for some countries are very low, we only in-clude major trading partners in our analysis. We exin-clude the countries for each sector if the export share of the country for a particular industry is lower than 1.3%. Moreover, for some of Turkey's trading partners,
Table 1
Export share of each country in each sector (%, 1996–2009 average).
Code Wearing B. Metals Textiles Machinery Food Chemical F. Metals Radio–TV Plastic Elec. Mac. Germany 15.71 29.33 2.93 17.57 10.33 12.36 4.78 11.03 20.64 11.85 11.01 UK 7.92 13.57 3.12 8.40 8.13 5.58 2.62 6.09 21.12 5.87 7.62 Italy 12.81 3.56 5.40 6.76 5.49 4.36 7.52 5.02 6.33 5.83 4.99 US 9.03 6.32 7.57 4.12 4.15 4.10 3.28 2.14 France 14.73 5.76 5.88 3.94 3.64 8.63 3.75 4.73 Spain 4.69 4.16 3.56 2.27 3.18 1.86 4.69 2.11 8.66 2.89 1.64 Nether. 1.63 6.02 3.13 1.54 4.53 1.86 5.54 1.88 Romania 3.14 2.48 2.96 2.85 3.02 4.13 1.95 4.75 2.11 UAE 14.52 1.35 2.56 Greece 2.54 1.85 1.86 1.61 1.89 1.47 1.95 Belgium 2.22 2.05 1.64 1.97 3.29 2.94 Bulgaria 1.59 1.92 1.86 2.41 2.19 2.77 2.25 Poland 2.30 1.68 Denmark 2.71 Sweden 2.33 Ireland 0.97 Japan 1.38 Total 62.84 68.39 42.47 62.53 46.88 40.13 35.88 40.72 76.67 48.30 37.89 Note: the countries are ordered regarding their share in Turkish total export.
0 5 10 15 20 25 1996 1997 1998 1999 2000 2001 2002 2003 2004 2005 2006 2007 2008 2009 2010 2011 2012
Textiles Wearing Chemical Products
Basic Metals Machinery & Equipment Radio-TV
Motor Vehicles
such as Iraq, Iran, Russia, China, the Turkish Republic of Northern Cyprus, and post-Communist countries, industrial production data is not available for our sample period. We therefore exclude those coun-tries from our analysis even though for some sectors these councoun-tries are the major trading partners.
5. Results
We discuss the estimates of Eq.(1)in this section.Table 2reports the income elasticities for different sectors across the main exporting mar-kets for the respective sectors. To save space, we report only the esti-mated coefficients of a country's income. The estimates for the full specification are available upon request.
Prior to interpreting the estimated coefficients, one must be cautious regarding the nature of products that Turkey exports.3In response to
foreign demand, a Turkish export of one type of product to a country mayfluctuate depending on the product's income elasticity. Export de-mand may increase if a product is considered normal (or a luxury) or it may decrease if a product is considered inferior. Thus, as foreign income increases, one may expect Automotive, Machinery, and Chemical Prod-ucts to increase, while Unbranded Textile ProdProd-ucts may decrease.
Over-all, Table 2 suggests that higher foreign demand increases export
demand for Turkish products in Motor Vehicles, Wearing Apparel, Basic Metals, Machinery, Fabricated Metals, Radio and TV, Plastic and Rubber, and Electrical Machinery. On the other hand, foreign income may decrease those sector demands for other countries.
To save space, below we only discuss income elasticities across the largest six sectors.
Motor Vehicles, Trailers, and Semi-trailers: The estimated income co-efficients for these exports are all positive for all countries we consider except Belgium. For those countries that are positive they are all statistically significant at the 1% level, except for Italy, where the coeffi-cient is at the 5% level.4All estimated positive coefficients are greater
than 1. This result may suggest that these goods may be considered nor-mal/luxuries. As their income increases, Spain, UK, and the Netherlands realize the highest coefficients for Motor Vehicles.
Wearing Apparel, Dressing, and Fur Dyeing: Foreign demand coef fi-cients for Wearing Apparel exports are varied among the destination countries. Exports to the UK and the US are significantly affected by for-eign income at the 1% level, with high coefficients: 1.85 and 4.68, re-spectively. This finding may be because these countries' branded companies produce goods in Turkey; therefore, with an increase in their income they increase Turkish production and import it. Wearing Apparel exports to Germany and France are not correlated to their in-come, but the remaining countries' Wearing Apparel imports are posi-tively affected by their income, with a coefficient around 1 or less than 1. Basic Metals: Foreign demand increases Basic Metals exports for all countries. Among the positive effects, all coefficients are statistically sig-nificant except for Romania and the UAE, which are at the 1% level. Basic Metals exports to Romania were nearly zero at the beginning of our sample (in 1996). When we exclude exports to Romania in 1996 and 1997, the coefficient becomes positively significant. In evaluating the Basic Metals export data to the UAE, exports increased after 2002;
Table 2
Export demand specification: income elasticities of individual countries.
Motor V. Wearing B. Metals Textiles Machinery Food Chemical F. Metals Radio–TV Plastic Elec. Mac. Germany 2.88⁎⁎⁎ 0.08 1.53⁎⁎⁎ −0.44⁎⁎⁎ 0.92⁎⁎⁎ 0.30⁎ 1.40⁎⁎⁎ 0.98⁎⁎⁎ 1.71⁎⁎ 1.15⁎⁎⁎ 0.20 (6.66) (0.67) (3.99) (−3.08) (4.00) (1.68) (2.88) (5.07) (2.45) (7.15) (0.78) UK 4.25⁎⁎⁎ 1.85⁎⁎⁎ 4.39⁎⁎⁎ 1.00⁎⁎⁎ 0.98⁎⁎ 0.66⁎⁎ 1.64⁎⁎⁎ 1.62⁎⁎⁎ 5.57⁎⁎⁎ 2.47⁎⁎⁎ 2.56⁎⁎⁎ (4.51) (6.50) (5.74) (5.28) (2.46) (2.44) (3.20) (3.60) (6.29) (7.99) (5.75) Italy 1.46⁎⁎ 0.67⁎⁎⁎ 3.27⁎⁎⁎ 1.28⁎⁎⁎ 1.24⁎⁎⁎ 1.67⁎⁎⁎ 2.44⁎⁎⁎ 1.87⁎⁎⁎ 5.98⁎⁎⁎ 1.49⁎⁎⁎ 2.58⁎⁎⁎ (2.24) (3.09) (5.70) (6.87) (4.57) (3.21) (7.46) (7.45) (4.02) (7.84) (7.03) US 4.68⁎⁎⁎ 4.91⁎⁎⁎ 3.75⁎⁎⁎ 0.84⁎⁎ −0.20 1.10⁎⁎ 6.52⁎⁎⁎ 1.66⁎⁎ (12.09) (4.49) (13.27) (2.34) (−0.63) (2.07) (13.33) (2.51) France 2.06⁎⁎⁎ 0.01 1.06⁎⁎⁎ 1.93⁎⁎⁎ 0.35⁎ 1.64⁎⁎⁎ 5.40⁎⁎⁎ 1.38⁎⁎⁎ 3.84⁎⁎⁎ (3.06) (0.05) (5.84) (6.76) (1.74) (6.12) (7.11) (6.12) (7.80) Spain 6.91⁎⁎⁎ 0.61⁎⁎⁎ 8.26⁎⁎⁎ 2.05⁎⁎⁎ 2.41⁎⁎⁎ 0.47 3.12⁎⁎⁎ 2.61⁎⁎⁎ 4.41⁎⁎⁎ 1.23⁎⁎⁎ 4.89⁎⁎⁎ (11.78) (2.51) (13.76) (11.71) (7.46) (1.05) (8.77) (7.08) (8.20) (5.47) (6.84) Nether. 4.81⁎⁎⁎ 1.13⁎⁎⁎ 0.52⁎⁎⁎ 1.57⁎⁎ 0.22 −1.17⁎⁎⁎ 6.61⁎⁎⁎ 0.18 (4.33) (4.48) (2.59) (2.30) (0.85) (−2.59) (3.95) (0.44) Romania 2.98⁎⁎⁎ 0.42 1.58⁎⁎⁎ 2.24⁎⁎⁎ 1.11⁎⁎⁎ 0.43⁎⁎ 2.40⁎⁎⁎ 1.78⁎⁎⁎ 1.00⁎⁎⁎ (5.88) (1.15) (8.52) (9.78) (6.17) (2.00) (2.88) (11.36) (2.67) UAE 0.14 0.89 3.03⁎⁎ (0.13) (1.16) (2.52) Greece 5.23⁎⁎⁎ 2.93⁎⁎⁎ 2.79⁎⁎⁎ −1.11⁎⁎⁎ 3.71⁎⁎⁎ 3.33⁎⁎⁎ 1.06⁎⁎⁎ (7.10) (10.07) (7.07) (−2.69) (8.64) (4.33) (3.32) Belgium −0.81 0.46⁎ 1.82⁎⁎⁎ 1.18⁎⁎⁎ 2.36⁎⁎⁎ 3.68⁎⁎⁎ (−1.11) (1.66) (5.16) (4.83) (3.62) (6.24) Bulgaria 4.11⁎⁎⁎ 1.35⁎⁎⁎ 2.93⁎⁎⁎ 1.19⁎⁎⁎ 3.05⁎⁎⁎ 1.62⁎⁎⁎ 3.84⁎⁎⁎ (12.64) (8.19) (12.45) (8.23) (13.17) (7.13) (8.27) Poland 0.56 1.46⁎⁎⁎ (1.32) (4.24) Denmark 0.72⁎⁎⁎ (4.21) Sweden 5.47⁎⁎⁎ (7.78) Ireland −0.15 (−0.44) Japan 0.93⁎⁎ (2.01)
Note: t-statistics of the estimated coefficients are reported in parentheses under the corresponding estimated coefficients. ⁎⁎⁎ Indicates significance at 1% level.
⁎⁎ Indicates significance at 5% level. ⁎ Indicates significance at 10% level.
3
We provide the decomposition of each country's exports to the ISIC-3 four-digit
prior to that time, the UAE had a share of less than 1%. When we consider that the sample essentially starts in 2002, the coefficient of foreign income for UAE exports becomes positive and statistically significant. For the samples and the other trading partners for Basic Metals, the coefficient of foreign income is very high, with Spain having the highest. These re-sults suggest that exports for this sector are highly dependent on the for-eign income of developed countries such as Spain, the UK, and the US. Therefore, we expect that these exports will increase with recovery from the global crisis. In other words, this sector's cycle is highly correlated to the business cycle of its trading partners.
Textiles: The estimated foreign income coefficient in the equation of Textiles exports is greater than 2 for three countries: the US, Spain, and Greece; however, it is statistically significant at the 1% level and greater than or equal to 1 for Bulgaria, France, Italy, Romania, and the UK. It is sta-tistically significant and less than 1 for Belgium and the Netherlands. We determine that exports to these countries are normal/luxury products. On the other hand, Textile exports to Germany are statistically significant at the 1% level but negatively related to foreign income; therefore, such products could also be viewed as inferior. The effect for Poland is not sta-tistically significant.
Machinery and Equipment n.e.c. (not elsewhere classified): The foreign income coefficient is positive and statistically significant for all coun-tries for Machinery and Equipment. Overall, this sector has the lowest foreign demand coefficients for all the major trading partners. This re-sult may suggest that these partners import machinery from Turkey as an income inelastic good. The developing countries in our sample, however (namely Romania, Greece, and Bulgaria), increase imports from Turkey when their incomes increase; therefore, their foreign de-mand coefficients are higher than 1. The income elasticity is also higher than 1 for Italy, France, Spain, the Netherlands, and Belgium.
Food Products and Beverages: The estimated foreign income coef fi-cients in Food Products and Beverages equations are statistically signif-icant, with low coefficients for all countries except the US, Spain, and the Netherlands. This result is expected because these products are catego-rized as non-durable and income insensitive; therefore, exports are not highly correlated with income changes. In addition, regulations around these products, especially from the EU, are very strict and have become a major determinant in this sector's exports. To save space, we did not discuss the estimated coefficients for other sectors.
We are also interested in the estimated coefficients of the real ex-change rate (rer),5and report them inTable A2in theAppendix A. Real
exchange rate elasticity is always below 1 (non-elastic) for Plastic and Rubber products. This coefficient is above 1 (elastic) for Textiles, Machin-ery and Equipment, and Food Products and Beverages. Thus, we may claim that the sectors face an inelastic demand. On the other hand, for Motor Vehicles, Basic Metals, Fabricated Metals, Radio–TV, and Electrical Machinery, real exchange rate elasticity is above 1 for three countries out of the seven to 12 countries that we consider for each exporting sector. When we compare across countries, none of the real exchange rate coef-ficients is above 1 for Germany, Turkey's biggest export market. Real ex-change rate elasticities are above 1 forfive exporting sectors for Romania, and for four sectors for Spain. Last, negative and statistically significant coefficients for real exchange rate at the 5% level is observed for five countries for different sectors without any particular pattern.6
Overall, our results regarding income elasticities reflect the findings in the literature. Many studies, such asSenhadji and Montenegro
(1999),Akal (2010), andCosar (2002), suggest that income elasticity
for aggregate exports is greater than 1, while real exchange rate elastic-ity is low. We contribute to the literature by measuring variations in in-come elasticities and real exchange rate elasticities across sectors and countries. Within the same sector, some countries have higher income elasticities and some have lower. Therefore, sectoral policies could be designed using our results, and growth rate forecasts for trading part-ners would help predict export sector paths.
To test for a structural break in 2001, we also estimate the model using a shorter sample. Although we see minor changes in the sample covering 2001:3 to 2009:12 compared to the full sample, our results do not change significantly. Therefore, in agreement withAydın et al.
(2007), we could notfind support for a structural break in 2001.
6. Simulations
We perform a simulation exercise regarding how a 1% increase from its historical average in each exporting country's GDP affects exports for each sector. During this exercise we increase the income of one country at a time while keeping the income growth rates of other countries at their historical averages.7The increases in exports as a percentage for each country are reported inTable 3.8Table A3repeats the exercise
but income increases are from 2009:12 rather than 1% above historical averages. The symbol * inTable 3represents the highest increase in the export of the corresponding sector with respect to an increase in the growth rate of the country in the corresponding row.
There are some interesting results fromTable 3. AsTable 1suggests, Germany has the largest export shares in the most sectors. However, a rise in German GDP increases export growth in respective sectors less than the increases in GDP in some other countries. This result clearly suggests that not only the export share, but also the income elasticity of exports is important. In this respect, we analyze below the impact of each country's recovery from the crisis on each sector as an interpre-tation ofTable 3.
Three countries appear the most important for Turkish exports: Germany, France, and Italy.Table 1clearly suggests that Germany has the highest export share in eight out of 11 sectors. Also note that the Motor Vehicle sector has the highest export share of the eight. Turkey has vertically integrated automotive industries with France and Italy, thus, growth performance of all these countries might be important for Turkish export demand.
An increase in UK income increases Turkish exports the most for Wearing Apparel, Radio–TV, Plastic and Rubber, and Electrical Machin-ery. Thus, if the UK recovers quickly from the crisis, these sectors would benefit the most. The US is the driving force for Textiles exports because of the above-discussed point that USfirms producing products in Turkey increase production as US income increases. When we ana-lyze the simulation results of the Food sector, no country leads in export demand: the impacts shown inTable 3are very small compared to the other sectors; therefore, this sector does not depend on the growth rate of a particular country or group of countries.
InTable 3we observe high numbers in the Fabricated Metals sector.
We also observe market diversification, with the EU-15 countries, the US, Bulgaria, and Greece the most effective markets. Each country's re-covery would thus contribute to an increase in exports for this sector.
Our simulations suggest that Radio–TV is the most demand-driven sector sampled. An increase in a country's growth rate would signi fi-cantly increase this sector's growth rate. Germany, Italy, Spain, France, and the UK have the highest income elasticities of this sector.
5For robustness reasons, we use several real exchange rate definitions in addition to the
average real exchange rates calculated separately for each country. First, we use the real ef-fective exchange rate for Turkey announced by the CBRT, which calculates it by considering the weighted average of the major trading partners. Second, we calculate the real exchange rate with respect to the specific country the sector is exporting to. Third, we use weighted three-period averages\namely, current and two lags\of the real exchange rates relative to the individual countries. The three estimates with three different exchange rates are ro-bust. We do not report those results here to save space, but they are available upon request.
6
We repeat the same exercise with the quarterly data. The estimates for the foreign in-come countries and the real exchange rates are mostly similar.
7As a historical average we took the averages between 2004 and 2007, which was a
more stable period for Turkish exports.
8
Simulations for various countries for various growth levels might also be of interest. A spreadsheet for different simulation exercises is available athttp://www.bilkent.edu.tr/ ~berument/TES.xlsfor the interested reader.
The simulation results for 2009:12 suggest that if France and the UK re-cover quickly from the global crisis, Turkey's Motor Vehicle exports would increase rapidly. Germany, Italy, and Spain would also contribute to this increase, thus, the recoveries of developed countries, more specifically the EU-15, are key for increasing Turkey's Motor Vehicle exports. Although Turkey has integrated its automotive industry (the largest share in Turkish exports) with France and Italy, the increase in exports as a result of a 1% increase in GDP for Spain, Germany, and UK is more than for France and Italy. These results are again due to lower income elasticity for France and Italy compared to the other three countries. It seems that higher levels of vertical integration decreases income elasticity for these two countries. Recovery in the EU would also result in increased exports in Machin-ery, Chemical Products, Electrical MachinMachin-ery, and Plastic and Rubber Products. The UK appears to be the driving force for the majority of the sectors (seven out of 11), based on 2009:12 simulations. Therefore, the recovery of the UK or an unexpected growth performance would be very beneficial for Turkish exports.
The simulation analysis shows an important drawback of Turkey's ex-port structure: market diversification is very weak. The EU-15 countries dominate the Turkish export market and therefore a problem in the EU-15 immediately affects the Turkish export channel. Because these countries have the largest share in Turkish exports, this result should not be surprising. Interestingly, it seems that US growth (even if its port share is small but its income elasticity is high) increases Turkish ex-ports more compared to individual EU-15 countries for Wearing, Basic Metal, Textiles, and Fabricated Metals (these analyses are not reported here to save space), but this interpretation should be viewed with care: First, the US is a much bigger economy compared to individual EU-15 countries, thus this result is sensible. Second, it is quite likely that the cor-relations of EU-15 countries' growth rates are high. Thus, once this corre-lation is accounted for, the recovery in EU-15 countries as a whole may still stimulate Turkish exports more than Turkish exports to the US do in those four sectors. Because this simulation requires assuming/ calculating various correlation coefficients among the EU-15 countries' growth rates, carrying it out is not easy. However, if the correlation among the EU-15 countries is taken as 1, then EU-15 countries' growth stimulates Turkish exports more than any non-EU-15 country.
7. Caveat
This study has various limitations. First, the export substitution is fixed when we perform the simulations. Thus, while the income of one country decreases, we assume that export demand to other
countries for the same industry is unaffected. Second, in our estima-tions, we assume that the (real) exchange rate remains constant. In re-ality, however, as the income level of the importing country changes, it is likely that the (real) exchange rate also changes.
Third, in this study we model export demand by foreign income de-mand and the real exchange rate. Although it is common to assume that these factors are the main determinants of export demand, we disre-gard the fact that there would be other determinants, such as uncertain-ty and investment, as suggested bySahinbeyoglu and Ulasan (1999).
Fourth, due to the unavailability of data, we do not include countries such as China, Russia, some Eastern European countries, Iraq, or Iran in our analysis; however, for some sectors they are Turkey's main trading partners and may significantly affect the results.
8. Conclusion
Although the recent crisis began in developed countries, it has also affected developing countries; how and when the recovery starts, and in which countries, are important questions. Developing countries, in-cluding Turkey, rely on the recovery of developed countries because the export channel is important to their growth. In this context, the paper sectorally analyzes the income elasticities of Turkish exports to understand the effects of other countries' growth rates and the impact of their recoveries on Turkey.
To perform a detailed analysis, we separately model the export de-mand for each sector in ISIC-3 two-digit classifications. Moreover, we estimate a system of equations for each sector, where each equation stands for a destination country. In this framework, we obtain foreign demand elasticities for each sector and for each country.
First, the results of our estimations on income elasticities suggest that Basic Metals, Radio–TV, Motor Vehicles, Plastic and Rubber Products, Fab-ricated Metals, and Electrical Machinery (for most of the destination countries) are highly dependent on foreign income, and that in Machin-ery, the income elasticities of developing countries are significantly higher than those of developed countries. On the other hand, income elasticities are not statistically significant for many countries in the Food sector be-cause Food Products and Beverages are income inelastic and non-durable. Moreover, regulations, especially in the EU, are the main deter-minant of these exports. The Wearing Apparel and Textiles sectors appear to depend on the UK and the US. Second, the results of our estimates on real exchange rate elasticities suggest that the three sectors for which countries consider the real exchange rate as a major determinant of their import decisions are Wearing Apparel, Machinery, and Plastic and
Table 3
Simulations of the relationship between exports and foreign demand: the effect of a one percentage point increase in each country's growth rate on each sector's export (percentage point differences from the baseline scenario of 1% growth for all the countries, based on 2004–2007 averages).
Motor V. Wearing B. Metals Textiles Machinery Food Chemical F. Metals Radio–TV Plastic Elec. Mac. Germany 0.69 0.03 0.10 −0.11 0.19 0.09 0.20 0.25 0.42 0.27 0.04 UK 0.64 0.41⁎ 0.36 0.14 0.15 0.09 0.09 0.26 1.69⁎ 0.31⁎ 0.66⁎ Italy 0.32 0.04 0.42 0.13 0.14 0.21⁎ 0.53⁎ 0.21 0.57 0.17 0.37 US 0.30 0.55 0.30⁎ 0.16 −0.02 0.10 0.33⁎ 0.04 France 0.41 0.09 0.24⁎ 0.03 0.14 0.53 0.10 0.41 Spain 0.70⁎ 0.04 1.07⁎ 0.09 0.18 0.02 0.46 0.14 0.51 0.08 0.26 Nether. 0.16 0.10 0.03 0.05 0.02 0.12 0.70 0.01 Romania 0.17 0.03 0.10 0.16 0.10 0.05 0.08 0.20 0.07 UAE 0.04 0.03 0.20 Greece 0.30 0.11 0.12 −0.05 0.19 0.07 0.04 Belgium −0.02 0.01 0.06 0.09 0.21 0.25 0.00 Bulgaria 0.22 0.05 0.14 0.08 0.20 0.10 0.33 Poland 0.02 0.05 Denmark 0.03 Sweden 0.21 Ireland 0.00 Japan 0.03 Share of countries 62.56 74.81 51.24 61.22 46.73 41.24 36.87 41.61 81.84 49.79 36.53 Note.
Rubber. On the other hand, for Basic Metals, Radio–TV, and Electrical Ma-chinery, real exchange rate is not a major determinant.
Overall, our results are in agreement with the literature. Previous studies suggest that income elasticity is greater than 1 for aggregate ex-ports, whereas they suggest that the real exchange rate elasticity is less than 1. In many sectors, wefind income elasticity to be greater than 1; however, we observe significant variations across countries. This find-ing is the major contribution of our study.
In the second stage of this paper, we perform simulations to under-stand the effects of destination countries' growth rates on Turkish exports.
In brief, for different periods, we simulate the impact of an increase in each country's growth by one percentage point while keeping the other countries' growth rates constant. The simulation results suggest that EU countries lead most sectors. Moreover, most sectors' market di-versification is limited to EU countries, hence Turkey would benefit from diversifying its exports.
Each country will have a different pace of recovery from the global cri-sis. Because each country has a different impact on each sector of Turkey's exports, policymakers could take sectoral measures to speed Turkey's re-covery by following forecasts for different countries' growth rates.
Table A1
Decomposition of ISIC Rev. 3 sectors to four digits for each country.
Germany Belgium Italy Spain France Nether. UK Romania Denmark US UAE Greece Bulgaria Poland Japan Sweden Ireland Motor V. 3410 52.65 76.19 84.08 92.99 80.64 87.57 79.62 88.09 3420 2.02 0.11 0.89 0.07 1.31 1.53 0.24 1.00 3430 45.34 23.70 15.03 6.94 18.05 10.90 20.14 10.91 Wearing 1810 99.13 98.11 99.22 98.48 99.68 99.89 99.80 97.87 1820 0.87 1.89 0.78 1.52 0.32 0.11 0.20 2.13 B. Metals 2710 48.99 70.08 91.64 67.96 87.48 94.88 86.25 90.33 65.22 2720 51.01 29.92 8.36 32.04 12.52 5.12 13.75 9.67 34.78 Textiles 1711 14.55 30.18 41.94 36.78 15.26 16.81 18.07 54.12 21.54 45.76 53.59 62.41 1721 34.86 31.81 11.93 26.61 38.56 30.32 24.66 4.78 54.72 13.56 4.25 5.79 1722 2.18 4.08 1.60 1.03 1.15 1.32 1.30 9.99 10.98 11.99 2.19 8.72 1723 0.02 0.02 0.00 0.03 0.02 0.01 0.01 0.15 0.00 0.10 0.11 0.01 1729 5.83 5.88 7.34 12.78 5.64 3.66 4.27 7.47 4.46 9.06 6.30 15.75 1730 42.57 28.03 37.19 22.77 39.37 47.88 51.70 23.49 16.42 19.52 33.56 7.33 Machinery 2911 1.40 1.29 1.04 0.49 0.33 14.17 4.13 0.09 3.10 0.32 0.07 2912 14.20 14.94 5.85 2.21 4.83 8.94 6.16 12.25 19.90 3.09 6.06 2913 7.40 4.47 5.06 2.11 4.50 2.24 6.87 2.56 5.14 0.76 0.82 2914 1.91 0.29 0.58 0.11 0.53 0.46 0.15 0.61 0.08 1.01 0.48 2915 1.82 0.94 0.47 0.84 1.45 6.82 0.34 2.29 6.11 2.55 3.19 2919 9.06 10.03 8.13 8.23 8.43 7.06 5.90 15.93 7.69 18.92 16.40 2922 4.69 2.99 4.76 8.08 1.82 5.72 1.32 7.64 4.25 6.46 12.42 2923 0.33 0.50 0.61 1.82 0.35 0.03 0.71 0.32 1.24 0.66 0.29 2924 10.88 17.40 12.69 3.12 4.23 7.59 8.14 4.38 4.70 1.27 4.09 2925 0.64 0.66 1.14 0.21 0.57 1.81 0.15 3.50 0.58 3.78 2.93 2926 1.39 1.64 1.78 0.55 0.77 0.65 1.37 1.24 1.28 1.39 2.23 2927 1.73 0.94 3.55 1.37 1.87 0.54 2.07 0.19 15.47 0.48 0.94 2930 40.94 39.58 41.28 68.13 64.37 38.40 61.32 36.81 8.05 51.73 35.10 2931 0.00 0.00 0.00 0.00 0.00 0.00 0.00 0.00 0.00 0.00 0.00 2921 0.19 1.92 5.22 0.41 3.07 0.86 0.30 4.01 0.00 3.23 5.08 Food 1511 0.06 0.62 1.68 0.15 0.43 0.00 0.51 0.00 0.03 1512 1.53 4.35 7.65 20.55 8.43 9.67 0.40 1.50 28.07 1513 79.36 71.40 47.14 32.26 66.63 80.01 83.15 61.97 54.33 1514 0.63 1.50 31.88 32.80 0.51 0.39 0.10 22.62 9.20 1520 0.06 0.01 0.00 0.00 0.00 0.01 0.00 0.98 0.20 1531 5.43 1.27 0.26 0.05 1.96 1.41 1.46 2.55 0.04 1532 0.09 9.62 0.05 4.91 0.01 0.26 1.78 0.55 0.00 1533 0.01 0.02 0.00 0.01 0.00 0.00 0.01 0.00 0.00 1541 2.90 1.11 0.24 0.75 0.97 0.70 0.80 2.40 0.47 1542 0.25 0.00 0.04 0.00 0.17 0.00 0.01 0.01 0.00 1543 3.00 3.95 2.85 0.95 2.02 1.32 7.30 4.41 3.04 1544 0.42 0.42 0.06 0.01 0.05 0.32 0.13 0.75 2.63 1549 2.28 2.09 6.91 7.46 17.24 4.10 1.50 1.62 1.62 1551 1.78 0.13 1.02 0.03 0.76 1.13 0.08 0.15 0.05 1552 0.38 2.13 0.00 0.01 0.23 0.04 0.28 0.17 0.21 1553 0.19 0.14 0.22 0.06 0.24 0.11 0.46 0.10 0.11 1554 1.65 1.24 0.00 0.00 0.35 0.53 2.04 0.19 0.01 Chemical 2411 11.99 40.55 42.93 48.06 51.44 14.38 9.32 33.03 29.06 7.12 2413 9.00 11.75 19.62 6.30 2.32 6.76 16.30 1.19 28.41 16.32 2421 0.15 0.13 0.04 0.03 0.76 0.27 3.64 0.01 0.37 1.34 Appendix A
Table A1 (continued)
Germany Belgium Italy Spain France Nether. UK Romania Denmark US UAE Greece Bulgaria Poland Japan Sweden Ireland 2422 0.94 0.20 1.45 0.38 1.65 3.56 13.61 0.74 3.34 10.75 2423 38.82 18.25 2.27 13.45 6.95 32.15 4.00 20.02 1.76 2.51 2424 9.95 1.32 1.56 1.01 8.28 9.46 31.42 10.36 7.15 29.18 2429 8.40 0.63 1.41 1.69 13.16 4.77 5.47 2.45 5.68 10.14 2430 20.75 27.14 27.32 25.10 15.42 27.69 14.22 29.56 18.00 22.28 2412 0.00 0.03 3.41 3.97 0.02 0.97 2.01 2.65 6.24 0.36 Fabricated Met. 2811 7.33 4.74 7.69 13.40 3.15 18.76 6.58 38.24 9.87 35.49 2812 18.02 27.52 28.87 10.23 60.84 31.08 0.79 28.38 52.19 13.76 2813 0.76 1.70 1.59 0.37 0.19 0.28 0.32 0.24 0.68 0.64 2893 10.02 3.96 6.44 16.48 7.84 22.51 2.59 6.45 5.61 14.33 2899 63.87 62.08 55.41 59.52 27.97 27.37 89.72 26.68 31.66 35.78 Radio–TV 3210 0.44 0.48 0.91 0.47 1.60 0.92 0.32 0.67 0.03 3220 3.32 2.25 0.74 1.24 3.26 1.53 6.07 1.53 1.71 3230 96.24 97.26 98.35 98.29 95.14 97.55 93.61 97.79 98.26 Plastic 2511 30.71 74.38 57.88 53.25 26.32 11.60 34.33 4.46 25.91 20.37 6.37 31.41 2519 37.55 7.37 18.06 16.00 14.75 45.68 8.91 17.29 54.03 9.36 10.42 28.12 2520 31.74 18.25 24.05 30.75 58.93 42.71 56.76 78.25 72.94 70.27 83.21 40.47 Elec. Mac. 3110 31.16 7.87 42.16 16.98 10.59 12.01 52.23 6.02 7.58 3120 25.34 41.69 10.17 44.95 4.39 17.41 17.75 22.74 1.28 3130 25.42 29.02 26.03 10.54 66.83 40.32 18.29 60.18 86.98 3140 0.58 0.49 0.09 0.87 1.05 4.98 4.69 0.95 1.54 3150 5.01 1.34 4.36 4.74 3.95 16.53 5.00 6.52 0.76 3190 12.51 19.59 17.20 21.92 13.19 8.75 2.04 3.59 1.86 Table A2
Export demand specification: real exchange rate elasticities of individual countries.
Motor V. Wearing B. Metals Textiles Machinery Food Chemical F. Metals Radio–TV Plastic Elec.Mac. Germany 0.34 0.25⁎⁎⁎ 0.06 0.03 0.34⁎⁎ 0.24⁎ 0.77⁎⁎⁎ 0.49⁎⁎⁎ −0.62 0.02 0.10 (1.53) (2.80) (0.23) (0.27) (2.16) (1.92) (2.88) (3.47) (−1.38) (0.19) (0.53) UK 0.19 1.24⁎⁎⁎ 0.37 0.64⁎⁎⁎ 0.37⁎ 0.27⁎⁎ −0.53⁎⁎ 0.78⁎⁎⁎ 0.90⁎⁎ 0.55⁎⁎⁎ 0.12 (0.50) (10.78) (1.18) (8.33) (1.66) (2.46) (-2.46) (4.15) (2.44) (4.28) (0.61) Italy 1.29⁎⁎⁎ 0.10 0.18 0.15 0.70⁎⁎⁎ 1.43⁎⁎⁎ 0.35 0.22 1.40 0.25⁎ 0.70⁎⁎⁎ (2.81) (0.60) (0.46) (1.19) (3.71) (3.99) (1.58) (1.26) (1.40) (1.75) (2.61) US 1.70⁎⁎⁎ 1.09⁎⁎⁎ 1.29⁎⁎⁎ 0.82⁎⁎⁎ 0.37⁎⁎⁎ −0.08 −0.38 0.65⁎⁎⁎ (12.80) (2.81) (13.66) (5.45) (3.33) (−0.41) (−1.03) (2.80) France 0.04 0.52⁎⁎⁎ 0.30⁎⁎ 0.83⁎⁎⁎ 0.06 0.29 −0.82 −0.05 −0.80⁎⁎ (0.08) (5.00) (2.33) (4.70) (0.46) (1.64) (−1.54) (−0.32) (−2.41) Spain 1.90⁎⁎⁎ 0.03 1.52⁎⁎⁎ 0.27⁎ 0.46 0.65⁎ 1.06⁎⁎⁎ 1.24⁎⁎⁎ 0.03 0.76⁎⁎⁎ −2.16⁎⁎⁎ (3.76) (0.12) (2.93) (1.68) (1.64) (1.67) (3.45) (3.90) (0.06) (3.78) (−3.39) Nether. 0.48 0.19 0.04 0.31 −0.13 1.93⁎⁎ 0.93 0.76⁎⁎⁎ (0.37) (1.27) (0.36) (1.00) (−1.02) (2.02) (1.23) (3.54) Romania 1.85⁎⁎⁎ 1.32⁎⁎⁎ 0.66⁎⁎⁎ 0.76⁎⁎⁎ 0.93⁎⁎⁎ 1.54⁎⁎⁎ 2.94⁎⁎⁎ 0.41⁎⁎ 1.19⁎⁎⁎ (3.24) (3.30) (3.16) (2.93) (4.63) (6.30) (3.19) (2.36) (2.82) UAE −1.05⁎⁎⁎ −0.39 0.12 (−2.19) (−0.69) (0.22) Greece 0.10 −0.38⁎ 0.87⁎⁎⁎ 0.46⁎ 1.54⁎⁎⁎ 1.49⁎⁎⁎ 0.91⁎⁎⁎ (0.20) (−1.84) (3.27) (1.73) (5.43) (3.03) (4.12) Belgium −1.05 −0.31 0.19 −0.21 0.42⁎⁎⁎ −0.09 (−1.11) (−1.68) (0.91) (−0.99) (3.62) (−0.26) Bulgaria −0.34 0.03 1.13⁎⁎⁎ −0.32⁎⁎ 0.19 0.49⁎⁎ 2.01⁎⁎⁎ (−1.00) (0.20) (4.54) (−2.12) (0.77) (2.06) (4.11) Poland 0.31 −0.39⁎⁎ (1.40) (−2.20) Denmark 0.89⁎⁎⁎ (5.07) Sweden −0.57 (−0.87) Ireland 4.50⁎⁎⁎ (7.31) Japan 0.37 (1.50)
Note: t-statistics of the estimated coefficients are reported in parentheses under the corresponding estimated coefficients. ⁎⁎⁎ Indicates significance at 1% level.
⁎⁎ Indicates significance at 5% level. ⁎ Indicates significance at 10% level.
References
Akal, A., 2010.Estimating trade elasticities of Turkey with OECD countries: a panel approach. Eur. J. Soc. Sci. 15 (3), 371–381.
Aydın, F., Çıplak, U., Yücel, E., 2004.Export supply and import demand models for the Turkish economy. Central Bank of the Republic of Turkey Working Paper No.04/09.
Aydın, F., Saygılı, H., Saygılı, M., 2007.Empirical analysis of structural change in Turkish exports. Central Bank of the Republic of Turkey Working Paper No. 07/08.
Cosar, E., 2002.Price and income elasticities of Turkish exports: a panel data application. Central Bank Review, 2, pp. 19–53.
Dincer, N., Kandil, M., 2010.The effects of exchange ratefluctuations on exports: a sector-al ansector-alysis for Turkey. J. Int. Trade Econ. Dev. 20 (6), 809–837.
Fullerton, T., Sawyer, C., Sprinkle, R., 1999.Latin American trade elasticities. J. Econ. Financ. 23 (2), 143–156.
Funke, M., Ruhwedel, R., 2001.Export variety and export performance: empirical ev-idence from East Asia. J. Asian Econ. 12 (4), 493–505.
Funke, M., Ruhwedel, R., 2002.Export variety and export performance: empirical evidence for the OECD countries. Rev. World Econ. 138 (1), 97–114.
Neyaptı, B., Taşkın, F., Üngör, M., 2007.Has European Customs Union agreement really affected Turkey's trade? Appl. Econ. 39 (16), 2121–2132.
Nowak-Lehmann, F., Herzer, D., Martinez-Zarzoso, I., Vollmer, Sebastian, 2007.The impact of a Customs Union between Turkey and the EU on Turkey's exports to the EU. J. Common Mark. Stud. 45 (3), 719–743.
Sahinbeyoglu, G., Ulasan, B., 1999.An empirical examination of the structural stability of export function. Central Bank of the Republic of Turkey Working Paper No. 99/07.
Saygili, H., 2010.Sectoral export dynamics of Turkey: a panel co-integration analysis. Empir. Econ. 38, 378–384.
Senhadji, A.S., Montenegro, C.E., 1999.Time series analysis of export demand equations: a cross-country. IMF Staff. Pap. 46 (3), 259–273.
Table A3
Simulations of the relationship between exports and foreign demand: The effect of a one percentage point increase in each country's growth rate on each sector's export (percentage point differences from the baseline scenario of 1% growth for all countries, 2009:12).
Motor V. Wearing B. Metals Textiles Machinery Food Chemical F. Metals Radio–TV Plastic Elec.Mac. Germany 0.43 0.03 0.11 −0.11 0.20 0.10 0.23 0.26 0.44 0.25 0.04 UK 0.67⁎ 0.34⁎ 0.58⁎ 0.14 0.17 0.08 0.14 0.32⁎ 1.28⁎ 0.28⁎ 0.73⁎ Italy 0.31 0.06 0.19 0.11 0.11 0.11 0.51⁎ 0.18 0.88 0.18 0.36 US 0.11 0.25 0.26⁎ 0.14 −0.03 0.15 0.36⁎ 0.07 Spain 0.38 0.07 0.19 0.14 0.20 0.01 0.31 0.12 0.68 0.10 0.26 France 0.68⁎ 0.00 0.10 0.31⁎ 0.03 0.22 0.91 0.15 0.57 Nether. 0.04 0.09 0.03 0.06 0.03 0.13 0.11 0.01 Romania 0.14 0.02 0.11 0.14 0.05 0.03 0.04 0.15 0.05 UAE 0.08 0.02 0.28 Greece 0.09 0.09 0.08 −0.05 0.19 0.09 0.05 Belgium −0.05 0.02 0.07 0.10 0.23 0.18 Bulgaria 0.08 0.05 0.07 0.07 0.19 0.08 0.13 Poland 0.02 0.07 Denmark 0.04 Sweden 0.17 Ireland 0.00 Japan 0.02
Change in exports (million $) 23.4 4.2 6.4 4.5 4.7 0.8 2.1 2.5 7.3 2.2 2.4 Realized exports in 2009:12 932 623 425 490 318 181 125 133 177 149 104 Percent of total increase in exports 2.5 0.7 1.5 0.9 1.5 0.4 1.7 1.9 4.1 1.5 2.3 Share of countries 62.56 74.81 51.24 61.22 46.73 41.24 36.87 41.61 81.84 49.79 36.53 Note.