silica polymorph system
G. Ozkan, and P. OrtolevaCitation: The Journal of Chemical Physics 112, 10510 (2000); View online: https://doi.org/10.1063/1.481685
View Table of Contents: http://aip.scitation.org/toc/jcp/112/23
A mesoscopic model of nucleation and Ostwald ripening
Õ
stepping:
Application to the silica polymorph system
G. Ozkana) and P. Ortoleva
Laboratory for Computational Geodynamics, Department of Chemistry, Indiana University, Bloomington, Indiana 47405
共Received 10 September 1999; accepted 20 March 2000兲
Precipitation is modeled using a particle size distribution共PSD兲 approach for the single or multiple polymorph system. A chemical kinetic-type model for the construction of the molecular clusters of each polymorph is formulated that accounts for adsorption at a heterogeneous site, nucleation, growth, and Ostwald ripening. When multiple polymorphs are accounted for, Ostwald stepping is also predicted. The challenge of simulating the 23 order of magnitude in cluster size 共monomer, dimer, . . . , 1023-mer兲 is met by a new formalism that accounts for the macroscopic behavior of large clusters as well as the structure of small ones. The theory is set forth for the surface kinetic controlled growth systems and it involves corrections to the Lifshitz–Slyozov, Wagner 共LSW兲 equation and preserves the monomer addition kinetics for small clusters. A time independent, scaled PSD behavior is achieved both analytically and numerically, and the average radius grows with Rave⬀t1/2law for smooth particles. Applications are presented for the silica system that involves five
polymorphs. Effects of the adsorption energetics and the smooth or fractal nature of clusters on the nucleation, ripening, and stepping behavior are analyzed. The Ostwald stepping scenario is found to be highly sensitive to adsorption energetics. Long time scaling behavior of the PSD reveals time exponents greater than those for the classical theory when particles are fractal. Exact scaling solutions for the PSD are compared with numerical results to assess the accuracy and convergence of our numerical technique. © 2000 American Institute of Physics.关S0021-9606共00兲70123-1兴
I. INTRODUCTION
Precipitation typically involves four distinct processes— adsorption at a heterogeneous site, nucleation, Ostwald rip-ening, and Ostwald stepping. These processes underlie many key phenomena associated with chemical processing, as well as, in nature 共weathering, sedimentary, metamorphic, igne-ous, and other environments兲. Precipitation phenomena in nature include the nucleation and ripening of new solid phases, selected precipitation of preferred polymorphs, Lise-gang banding, agates, and igneous orbicules.1–5 While the importance of these phenomena has long been recognized, their simulation has been limited due to numerical difficul-ties involved in describing the growth of particles over 23 orders of magnitude in size共i.e., from monomer to cm-scale crystals兲. A complete model of precipitation must therefore integrate the microscopic, mesoscopic, and macroscopic lev-els of description.
Several approaches have been used to model precipita-tion kinetics.6–9 In nucleation-growth studies, a critical nucleus size is defined such that further growth is a free energy reducing process and thus a supracritical cluster may grow to macroscopic dimensions. Studies on the nucleation stage focus on the behavior of clusters smaller than this criti-cal size and on criti-calculating the total number of supercriticriti-cal clusters but not on the transition from the nucleation stage to that of macroscopic particles.
Studies of the coarsening of precipitates after the
nucle-ation stage are usually based on the theory of Lifshitz and Slyozov10 and Wagner,11 and its modifications.12–15 The classical and modified versions of the LSW theory yield a power law relation between the mean particle size and time at long times and a scaling form for the particle size distri-bution 共PSD兲. The low volume fraction theories of Mar-quesse and Ross14and Tokuyama and Kawasaki,16although each employed a different statistical averaging procedure, all predict a scaled particle size distribution which is broader than the LSW form.
In this study, we developed a model of precipitation phe-nomena which uses the same chemical rate formulation for both the early nucleation stage共the kinetics of monomer ad-sorption, dimer creation, growth of small surface-attached clusters兲 and the growth and ripening stage to create macro-scopic crystals. In the model, nucleation is initiated as an adsorption event. Further monomer addition results in the formation of small clusters whose dynamics becomes in-creasingly independent of the adsorption site properties as they grow. However, we do not separately treat the sub- and supracritical clusters. Rather, we apply the same chemical rate equation over the whole size range by using a size-dependent rate coefficient and free energy, giving a unity and continuity to the theory.
Our formulation adds a higher order derivative term to the LSW theory that introduces a diffusive-type behavior with respect to the particle size axis; this tends to broaden the PSD. For simplicity here, we refer to all PSD evolution theo-ries in the macroscopic particle limit to the LSW theotheo-ries. In the present work, however, we focused on the
reaction-a兲Current address: Department of Mathematics, Bilkent University, Bilkent,
Ankara 06533, Turkey.
10510
limited case, and not the diffusion-limited case of the classic LSW theory. A second contribution is an efficient numerical simulation technique that allows for the solving of these equations for 23 orders of magnitude in cluster size. Finally, we simulate PSD dynamics in multiple polymorph systems to investigate Ostwald stepping and the commonly observed selected precipitation of higher free energy solids or the skip-ping of intermediate free energy ones. We illustrate the rela-tion of nuclearela-tion site energetics to the latter.
The present study focused on the SiO2system due to its
importance in many geologic and engineering processes and the availability of ample rate and thermodynamic data.17–19 A model is set forth of the precipitation of SiO2into a set of polymorphs which compete for the shared pool of SiO2. Par-ticles of the same polymorph but of different size also com-pete to yield ripening of the PSD of each polymorph. The resulting model thus incorporates Ostwald ripening and step-ping. The approach is easily generalized to other mineraliza-tion 共carbonates, feldspars, etc.兲.
The formulation of our model is given in the next three sections. Numerical simulations based on our model for the SiO2 system of initially amorphous silica are discussed in
Sec. V. These simulations show the selective nucleation of some polymorphs and the competitive evolution of poly-morphs as SiO2cascades from the amorphous state initially
in the system, through several polymorphs, and finally to the long time dominance by the lowest free energy phase, quartz 共e.g., Ostwald stepping兲. After the stepping phase is com-pleted, larger quartz crystals grow at the expense of the smaller ones. A power law for the mean diameter is demon-strated. The PSD attains a LSW limiting scaled form in the ripening phase. The simulated and exact scaled PSD are compared to evaluate the accuracy of the numerical methods. Conclusions are drawn in Sec. VI. The detailed formulations for the model and the SiO2data used in the numerical
simu-lations are discussed in the Appendices.
II. FORMULATION
The model developed here is based on the classic chemi-cal kinetic theory of nucleation through monomer addition modified for heterogeneous systems and which integrates the chemical kinetic and continuous 共macroscopic兲 particle growth as suggested in Ref. 1. Modifications of the free en-ergy are introduced to account for the heterogeneous nature of initiation and early small cluster growth as well as surface energy for larger clusters.
The assumed kinetics of heterogeneous nucleation and growth is based on monomer addition discussed here in terms of the SiO2 system due to its importance in many
geologic and engineering processes and the availability of ample rate and thermodynamic data,17–19but the approach is easily generalized to other mineralization. Let Snmbe a cluster of polymorph m with n SiO2 units on a heterogeneous site.
The monomer addition reaction is taken to be Snm⫹SiO2共aq兲⇔Sn⫹1
m . 共2.1兲
Let nmbe the fraction of sites occupied by m,n-cluster in a macrovolume element havingTidentical sites per unit
vol-ume. The total number of sites in the macrovolume element is assumed to be constant during the evolution; it is the sum of the numbers of clusters for every polymorph cluster and the number of unoccupied surface sites available for nucle-ation. During evolution the number of sites occupied by vari-ous m,n-clusters and the shared pool of SiO2共aq兲 are
con-stantly shifting due to competition among polymorphs and among different size clusters of a given polymorph. The frac-tion of empty sites,0, is given in terms of the fractions of
m,n-cluster-occupied sites via
0⫽1⫺
兺
m⫽1 M兺
n⫽1 ⬁ n m , 共2.2兲where M is the number of polymorphs.
The dynamics of the site occupation fractions is assumed to take the chemical kinetic form
d0 dt ⫽⫺m
兺
⫽1 M W0m, 共2.3兲 dnm dt ⫽Wn⫺1 m ⫺W n m n⫽1,2, . . . ,⬁ m⫽1,2, . . . ,M.The rates Wnmare assumed to take the mass action form W0m⫽k0m共K0mc0⫺1 m兲, W n m⫽k n m 共Kn m cnm⫺nm⫹1兲, 共2.4兲 for size-dependent rate coefficient knm, equilibrium constant Knm, and SiO2(aq) molar concentration c. The data for silica polymorphs are described in the next section.
These equations describe the dynamics of the site occu-pancy probabilities共fractions兲. Thenmare the PSD’s of the polymorphs in the present formulation. The kinetics depends on the SiO2共aq兲 concentration variation with time in the mac-rovolume element. This variation is obtained by equating the rate of change of total SiO2 units in the macrovolume共both
in aqueous phase or in cluster form兲 to the total rate of flux into the volume. The SiO2共aq兲 concentration thus evolves via
c t ⫹ t
冉
T N0 m兺
⫽1 M兺
n⫽1 ⬁ nnm
冊
⫽冉
Total SiO2 flux intothe volume element
冊
, 共2.5兲 whereis the porosity and N0is Avogadro’s number. If Vinis the volume of inert solid in the medium, the porosity is calculated by subtracting the volume fraction of all poly-morphs and inert solid from unity,
⫽1⫺Vin VT ⫺T
兺
m⫽1 M 1 N0 n兺
⫽1 ⬁ V ¯ n m n m , 共2.6兲where V¯nmis the molar volume of a polymorph m cluster of n units and VTis the volume of the macrovolume element.
Equations共2.3兲–共2.6兲 conclude the chemical kinetic for-mulation of the PSD dynamics of polymorph growth via monomer addition. These equations constitute a set of non-linear differential equations for c, the PSDs of all poly-morphs, the fraction of empty sites and the porosity. These equations are solved by Newton–Raphson algorithm with second order time approximation.
To complete the formulation, we must specify the n-dependence of V¯nm, knm, and Knm. We assumed that the volume of clusters is proportional to the cluster number. The phenomenology of kn
m and Kn
m
are developed further in Sec. IV.
III. THE MESOSCOPIC TRANSITION FROM NUCLEUS TO MACROPARTICLE
The chemical kinetic formulation bridges the transition from monomer and dimer to macroparticle (1023-mer兲.
How-ever, there are several challenges presented by this formula-tion. First, one must solve on the order of 1023 equations because the cluster size ranges over this scale. Second, the knm increase as surface area 共as n2/3 for small particles兲 and
hence become extremely large as n→1023. The latter
situa-tion presents us with a problem in stiff differential equasitua-tions, i.e., equations with coefficients that differ by many orders of magnitude. The result is that to maintain accuracy, one must know the factors Knmcnm⫺nm⫹1 to an accuracy of order 1/knm. Thus even if one could solve 1023 equations numeri-cally, the accuracy required would make the calculation un-feasible.
The resolution of these difficulties resides in the realiza-tion that very large clusters act like macroparticles and thus obey macroscopic-type growth equation. A quartz crystal of 0.1 m diameter is modeled as 1.4⫻107-mer cluster. For
cm-scale crystals, the number n of SiO2 units goes up to 1023. Also, ripening makes PSD dynamics a type of moving boundary problem, i.e., the range of cluster sizes grows with time. This makes the computational range infinitely large, with infinite number of equations. These difficulties are over-come by dividing the cluster size domain into two parts at a cluster number N 共say, N⫽100). For n⬍N, the discrete chemical kinetic formulation given in Eqs.共2.3兲 and 共2.4兲 is applied. But for larger clusters, we transform the discrete kinetic equations into a continuous form by introducing the continuous site fraction, ˜ , and continuous cluster volume fraction, y, via n m共t兲⫽
冕
n⫺1/2 n⫹1/2 ˜m共n,t兲dn, 共3.1兲 ym共n,t兲⫽n˜m共n,t兲. 共3.2兲The quantities˜ and y are assumed to be smooth functions of n so that they and the first two derivatives with respect to n are well defined for all n⬎N.
When n⬎N, we assume that for 兩␦兩⭐1, we may write ym共n⫹␦,t兲⫽ym共n,t兲⫹y m n 共n,t兲␦⫹ 1 2 2ym n2 共n,t兲␦ 2. 共3.3兲 With this specific meaning of smoothness of ymwith respect to n, insertion of these definitions and Eq. 共3.3兲 into 共2.3兲 yields the continuous equation for the PSD,
ym t ⫹ x
冋
v mym⫺Dmy m x册
⫽0, n⭓N, 共3.4兲where x⫽ln(n), and v and D are related to the chemical parameters via vm共n,c兲⫽kn⫺1/2 m n
冋冉
1⫹ 1 2n冊
Kn⫺1/2 m c⫺冉
1⫺ 1 2n冊册
, 共3.5兲 Dm共n,c兲⫽kn⫺1/2 m 2n2 共Kn⫺1/2 m c⫹1兲. 共3.6兲The derivation of these results is given in Appendix A. Note that Eq. 共3.4兲 yields the classical LSW equation when the 1/n2 term in v is ignored and the diffusionlike D term is
neglected. Thus Eq. 共3.4兲→LSW as n→⬁. However, for finite n the PSD is broader than that of the LSW due to diffusive spreading from D⫽0.
The boundary conditions between the discrete and con-tinuous formulations are obtained from the continuity of the
˜ or y and from Eq. 共2.2兲. At the interface, the boundary condition to be imposed on Eq. 共3.4兲 is
冋
vmym⫺Dmy m x册
x⫽x0⫽ln兵N⫺1/2其 ⫽WN⫺1 m , 共3.7兲and for Eq. 共2.3兲 the boundary condition is
N m共t兲⫽ N⫺1 m 共t兲⫹2y m共N⫺1/2,t兲 N⫺1/2 . 共3.8兲
With this discrete and continuous formulation, numerical simulation of the mesoscopic transition becomes feasible as the solution of the following integrated problem:
d0 dt ⫽⫺m
兺
⫽1 M W0m, 共3.9兲 dn m dt ⫽Wn⫺1 m ⫺W n m n⫽1,2, . . . ,N⫺1, 共3.10兲 ym t ⫹ x冋
v mym⫺Dmy m x册
⫽0, x⭓ln共N⫺1/2兲 共3.11兲 with W0m⫽k0m共K0mc0⫺1 m兲, 共3.12兲 Wnm⫽knm共Knmcnm⫺nm⫹1兲, 共3.13兲 c t ⫹ t冉
T N0 m兺
⫽1 M兺
n⫽1 N⫺1 nnm⫹T N0 m兺
⫽1 M冕
x0 ⬁ exym共x,t兲dx冊
⫽0, 共3.14兲 where ⫽1⫺Vin VT ⫺T兺
m⫽1 M 1 N0 n兺
⫽1 N⫺1 V ¯mn n m ⫺T兺
m⫽1 M 1 N0冕
x0 ⬁ V ¯mexym共x,t兲dx. 共3.15兲In the numerical analysis of this system, the continuous range is truncated at a sufficiently large value of x such that y is negligible beyond this value. The continuous problem is solved by finite element discretization, i.e., the x axis be-tween ln N and the cutoff value is divided into NF equal segments. With this, the system size is reduced to the num-ber of finite elements, NF, plus N, with N⫹NFⰆ1023 共typi-cally N⫹NF is taken to be between 300 and 4000 in the results presented here, yielding an improvement of 1020 in the size of the problem order that stated in Sec. II兲. Finally, as knm is always divided by at least one factor of n in the equation of motion for y, the stiffness of the problem has also been removed. The system is solved by the Newton– Raphson algorithm with an upwinding scheme for the con-tinuous part.
IV. EQUILIBRIUM AND RATE PHENOMENOLOGIES The size dependent equilibrium constant is obtained from dilute solution equilibrium equation. At equilibrium, assuming a dilute aqueous SiO2solution,
gn m⫹ SiO2共aq兲 ** ⫹RT ln
冉
1 Knm冊
⫽gn⫹1 m , 共4.1兲 whereSiO 2共aq兲** is the reference potential of SiO2共aq兲, R is the
gas constant, T is absolute temperature, and gnm is the free energy of an n-mer of polymorph m共referred as m,n cluster in this document兲. The (Knm)⫺1 is the saturation SiO2共aq兲
concentration of the m,n cluster. The free energy of an n-mer is classically related to the surface free energy and bulk free energy via
共gn m兲cl⫽a
mn⫹bmn2/3, 共4.2兲
where am is the Gibbs free energy of bulk m per SiO2unit
共i.e., the molar free energy divided by Avogadro’s number兲. The bmfactor is related to the surface free energy 共free en-ergy per area兲m via
bm⫽m
冉
V ¯ m N0冊
2/3 , 共4.3兲where N0 is Avogadro’s number andis a geometry factor relating molar volume V¯m to grain surface 关for spherical grains⫽(36)1/3].
The above formulation must be supplemented with a term that reflects the adsorption of SiO2units onto
heteroge-neous nucleation sites in the sediment. One might expect this to be proportional to the number of adsorbed SiO2 units.
Hence, for small n we assume the independent adsorption energy behavior gnm⬃dmn for a coefficient dmrelated to the binding free energy of a SiO2 unit to the site surface. To
create an interpolation between the small and larger n formu-las, consider the ansatz
gnm⫽共n兲dmn⫹共1⫺共n兲兲共gn
m兲cl, 共4.4兲
for weighting factor (n) that varies between 1 and 0 as n varies between 1 and infinity. For concreteness, in this study we assume
共n兲⫽ 1 1⫹共n⫺1兲/n0
共4.5兲 for parameter n0 that fixes the transition number of SiO2
units beyond which the (gnm)clterm should dominate. These formulas determine the n-dependence of the saturation SiO2(aq) concentration for m,n-mer.
The adsorption effect also included in the rate coefficient in a similar way. For small clusters the rate coefficient is proportional to the area of the nucleation sites and as the cluster grows, the crystal surface area becomes dominant for the kinetics rate. In our model, we used the same weighting factor(n) for interpolation of rate coefficients as
knm⫽k¯m
冋
共n兲A0⫹共1⫺共n兲兲冉
V ¯ m N0冊
2/3 n2/3册
, 共4.6兲where k¯m is the rate coefficient per surface area for poly-morph m and A0 is the average area of the nucleation sites. The porosity,共i.e., the volume fraction of fluid with aque-ous species兲 is included in the rate coefficient expression to model the effect of volume fractions of crystals in chemical rate. As the volume fraction of solids increases the kinetic rate decreases since the contact area of solids with liquids decreases.
The rate and equilibrium constants are temperature de-pendent. These expressions for silica polymorphs are ob-tained from literature and the forms used in this study are given in Table I.
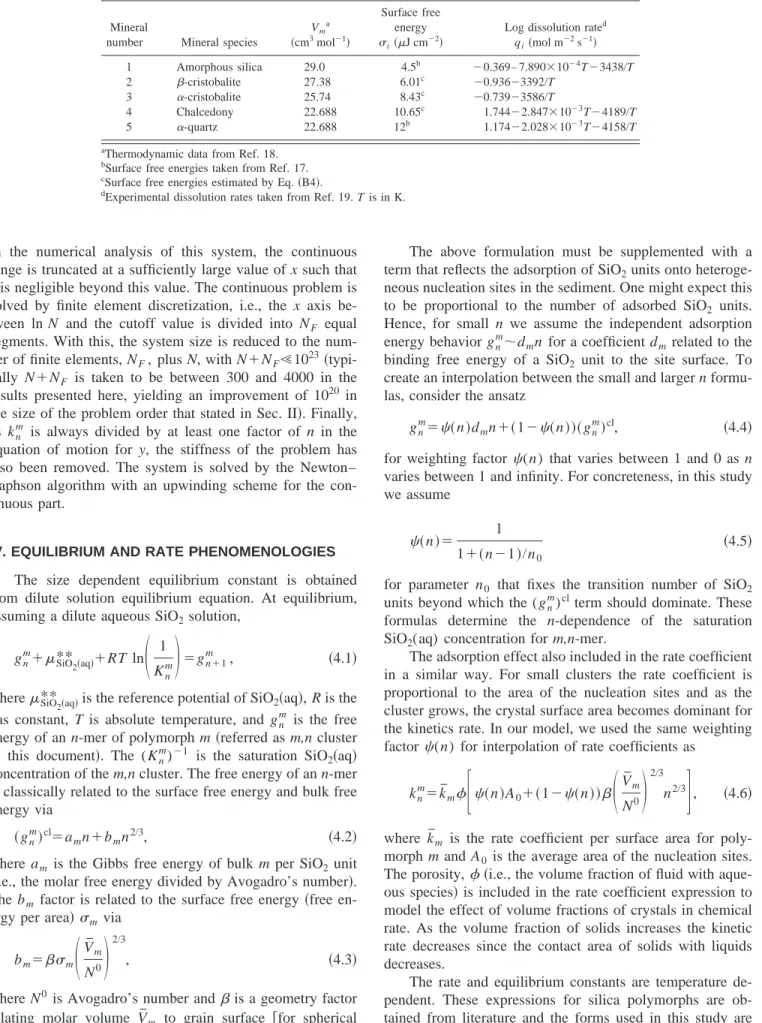
TABLE I. Silica polymorph data.
Mineral
number Mineral species
Vma
共cm3mol⫺1兲
Surface free energy
i共J cm⫺2兲
Log dissolution rated
qi共mol m⫺2s⫺1兲 1 Amorphous silica 29.0 4.5b ⫺0.369– 7.890⫻10⫺4T⫺3438/T 2 -cristobalite 27.38 6.01c ⫺0.936⫺3392/T 3 ␣-cristobalite 25.74 8.43c ⫺0.739⫺3586/T 4 Chalcedony 22.688 10.65c 1.744⫺2.847⫻10⫺3T⫺4189/T 5 ␣-quartz 22.688 12b 1.174⫺2.028⫻10⫺3T⫺4158/T
aThermodynamic data from Ref. 18. bSurface free energies taken from Ref. 17. cSurface free energies estimated by Eq.共B4兲.
V. SIMULATED OSTWALD PROCESSES: THE SiO2
SYSTEM
A. Numerical simulations
Ostwald processes in the multiple polymorph SiO2
sys-tem were investigated for using our model and numerical algorithm. An initially amorphous silica-rich, closed system with 60% porosity filled with an aqueous SiO2solution was
allowed to evolve at either 23 °C or 100 °C via our model. The initial amorphous silica PSD was assumed to be log-normal with a mean diameter of 0.01 m. The five silica polymorphs listed in Table II were allowed to nucleate, grow and compete for the total SiO2pool. The initial concentration
c(0) of SiO2共aq兲 was chosen be that in equilibrium with the
initial average size, amorphous silica cluster at the tempera-ture of the run. The heterogeneous sites have radius of 50 Å and the adsorption energies for all minerals are chosen to be the same, i.e., dm⫽aqz for all polymorphs except as noted below where special cases were simulated to illustrate how the energetics of the nucleation site can thwart the normal Ostwald stepping sequence 共see Sec. V D below兲. For the numerical simulations, the cluster number for transition from discrete to continuous behavior is chosen as N⫽100, and the continuous range of the logarithmic cluster number axis is divided into 200 segments (NF⫽200) with ⌬x⫽0.25. With this numerical data, the cluster size ranges from monomer to 5⫻1023-mer is simulated for the five polymorphs, and a total of 1497 equations are solved at each time step. The results of the simulations are as follows.
The simulations illustrated a richness of nucleation and Ostwald processes. The higher free energy polymorphs pre-cipitate first 关at the expense of amorphous silica through SiO2共aq兲 dissolved from the latter兴 but eventually lower free
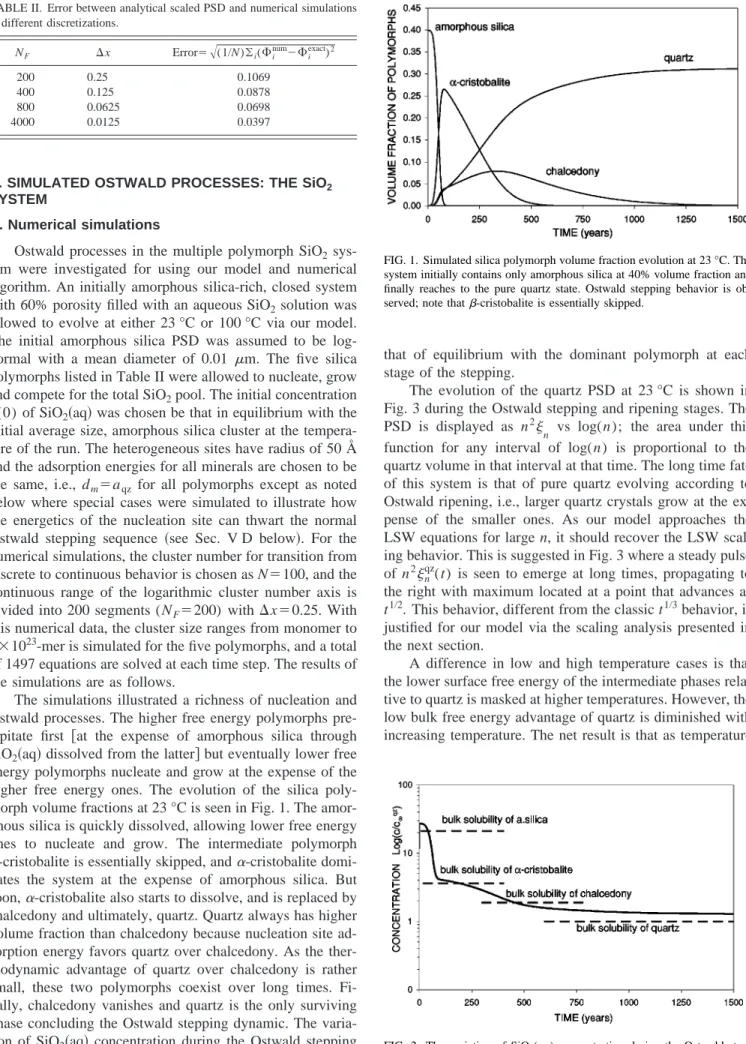
energy polymorphs nucleate and grow at the expense of the higher free energy ones. The evolution of the silica poly-morph volume fractions at 23 °C is seen in Fig. 1. The amor-phous silica is quickly dissolved, allowing lower free energy ones to nucleate and grow. The intermediate polymorph
-cristobalite is essentially skipped, and␣-cristobalite domi-nates the system at the expense of amorphous silica. But soon,␣-cristobalite also starts to dissolve, and is replaced by chalcedony and ultimately, quartz. Quartz always has higher volume fraction than chalcedony because nucleation site ad-sorption energy favors quartz over chalcedony. As the ther-modynamic advantage of quartz over chalcedony is rather small, these two polymorphs coexist over long times. Fi-nally, chalcedony vanishes and quartz is the only surviving phase concluding the Ostwald stepping dynamic. The varia-tion of SiO2共aq兲 concentration during the Ostwald stepping
stage is shown in Fig. 2. The SiO2共aq兲 concentration drops to
that of equilibrium with the dominant polymorph at each stage of the stepping.
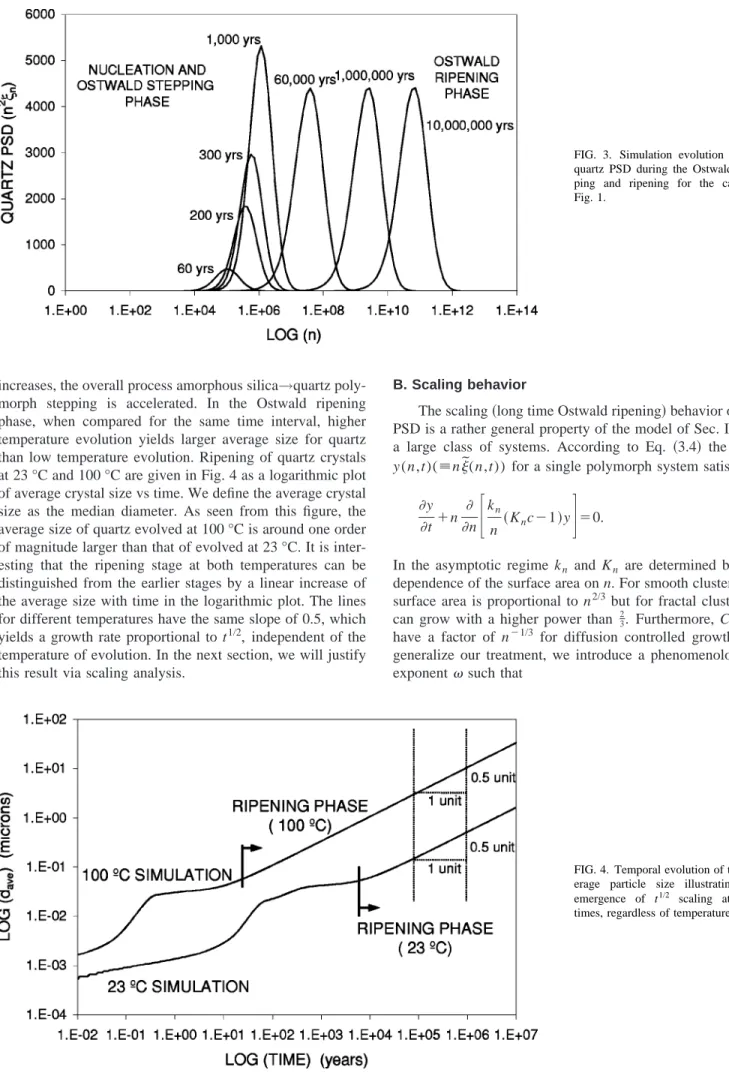
The evolution of the quartz PSD at 23 °C is shown in Fig. 3 during the Ostwald stepping and ripening stages. The PSD is displayed as n2
n vs log(n); the area under this function for any interval of log(n) is proportional to the quartz volume in that interval at that time. The long time fate of this system is that of pure quartz evolving according to Ostwald ripening, i.e., larger quartz crystals grow at the ex-pense of the smaller ones. As our model approaches the LSW equations for large n, it should recover the LSW scal-ing behavior. This is suggested in Fig. 3 where a steady pulse of n2
n
qz(t) is seen to emerge at long times, propagating to
the right with maximum located at a point that advances as t1/2. This behavior, different from the classic t1/3behavior, is justified for our model via the scaling analysis presented in the next section.
A difference in low and high temperature cases is that the lower surface free energy of the intermediate phases rela-tive to quartz is masked at higher temperatures. However, the low bulk free energy advantage of quartz is diminished with increasing temperature. The net result is that as temperature TABLE II. Error between analytical scaled PSD and numerical simulations
at different discretizations. NF ⌬x Error⫽冑(1/N)兺i(⌽i num⫺⌽ i exact )2 200 0.25 0.1069 400 0.125 0.0878 800 0.0625 0.0698 4000 0.0125 0.0397
FIG. 1. Simulated silica polymorph volume fraction evolution at 23 °C. The system initially contains only amorphous silica at 40% volume fraction and finally reaches to the pure quartz state. Ostwald stepping behavior is ob-served; note that-cristobalite is essentially skipped.
FIG. 2. The variation of SiO2(aq) concentration during the Ostwald step-ping for the simulation of Fig. 1.
increases, the overall process amorphous silica→quartz poly-morph stepping is accelerated. In the Ostwald ripening phase, when compared for the same time interval, higher temperature evolution yields larger average size for quartz than low temperature evolution. Ripening of quartz crystals at 23 °C and 100 °C are given in Fig. 4 as a logarithmic plot of average crystal size vs time. We define the average crystal size as the median diameter. As seen from this figure, the average size of quartz evolved at 100 °C is around one order of magnitude larger than that of evolved at 23 °C. It is inter-esting that the ripening stage at both temperatures can be distinguished from the earlier stages by a linear increase of the average size with time in the logarithmic plot. The lines for different temperatures have the same slope of 0.5, which yields a growth rate proportional to t1/2, independent of the temperature of evolution. In the next section, we will justify this result via scaling analysis.
B. Scaling behavior
The scaling共long time Ostwald ripening兲 behavior of the PSD is a rather general property of the model of Sec. III for a large class of systems. According to Eq. 共3.4兲 the PSD y (n,t)(⬅n˜ (n,t)) for a single polymorph system satisfies
y t⫹n n
冋
kn n 共Knc⫺1兲y册
⫽0. 共5.1兲In the asymptotic regime kn and Kn are determined by the dependence of the surface area on n. For smooth clusters the surface area is proportional to n2/3but for fractal clusters it can grow with a higher power than 23. Furthermore, C may
have a factor of n⫺1/3 for diffusion controlled growth. To generalize our treatment, we introduce a phenomenological exponentsuch that
FIG. 3. Simulation evolution of the quartz PSD during the Ostwald step-ping and ripening for the case of Fig. 1.
FIG. 4. Temporal evolution of the av-erage particle size illustrating the emergence of t1/2 scaling at long times, regardless of temperature.
Kn ⬃ n→⬁ 1 c⬁
冋
1⫺ ␣ n册
, 共5.2兲 kn n n⬃→⬁ k n, 共5.3兲where⫽1/3 for the simulations of the previous section. In arriving at this ansatz we restrict our treatment to the reaction-limited case; for the diffusion-limited case kn should vanish as n⫺⫺(1/3)and not as n⫺. Furthermore, we assume that the surface area increases as n1⫺ as n→⬁.
Introducing the supersaturationvia c⬁⫽c⫺c⬁, Eq.共5.1兲 becomes in the asymptotic regime,
y t⫹n n
冋
k n冉
⫺ ␣ n冊
y册
⫽0. 共5.4兲Let us now investigate similarity solutions of Eq. 共5.4兲 that generalize the LSW asymptotic results for the present
-system. To do so we introduce the similarity variable and a modified timesuch that
⫽n
␣ , d⫽
k
␣ 2dt. 共5.5兲
With this we find
冉
y 冊
n⫹ 冋
1 冉
1⫺ 1 冊
y册
⫽0. 共5.6兲In this equation we have made explicit the fact that the first term is a partial derivative with respect toat constant n共not
兲.
Conservation of SiO2 units during ripening yields
Q⫽⫹ 1 c⬁
冕
0⬁
y共n,t兲dn, 共5.7兲
where Q has a constant, finite value determined by the initial conditions. In the asymptotic regime,→0 and this equation takes the form,
Q⫽ 1
c⬁
冕
0⬁ ny共n,兲
d, 共5.8兲
which suggests that as Q is constant, there may be solutions such that ny (n,t) might be a function of the similarity vari-able only. Defining Y ()⫽ny(n,t)/1⫹(1/) and substitut-ing into Eq.共5.6兲, the modified PSD function Y satisfies
⫺Y⫹dd关u共,␥兲Y 兴⫽0, 共5.9兲 where u共,␥兲⫽⫺1
冋
2⫺ 1 ␥ ⫹ 1 ␥册
, 共5.10兲and␥ is defined via
␥⫽⫺1 dd⫽⫺k␣ 1
3
d
dt . 共5.11兲
If Y is to be a similarity solution共i.e., Y is a function ofbut not of兲, then␥must be a constant. The mass conservation equation with the new variables has the form
Q⫽ 1
c⬁
冕
0⬁
1/Y共兲d. 共5.12兲
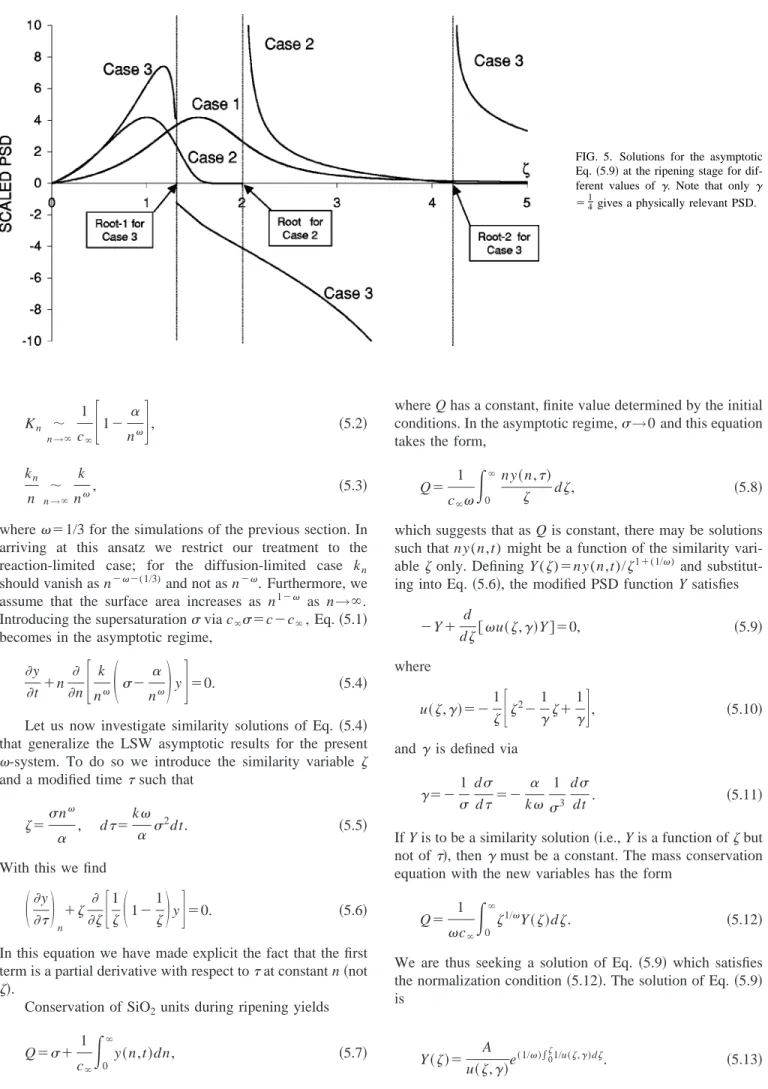
We are thus seeking a solution of Eq. 共5.9兲 which satisfies the normalization condition共5.12兲. The solution of Eq. 共5.9兲 is
Y共兲⫽ A u共,␥兲e
共1/兲兰01/u共,␥兲d. 共5.13兲 FIG. 5. Solutions for the asymptotic Eq.共5.9兲 at the ripening stage for dif-ferent values of␥. Note that only ␥
⫽1
This equation has three types of solution depending on the value of␥. These solutions correspond to the cases where u has no root, one double root and two distinct roots. We ex-amine each case separately to determine the value of ␥ for which the solution共5.13兲 is physically relevant.
Case 1. No real roots:⌬⫽1/␥2⫺4/␥⬍0, Y共兲⫽A1
共2⫺共1/␥兲⫹1/␥兲1⫹共1/2兲
⫻e兵共1/␥冑⫺⌬兲arctan关2共1/␥兲/冑⫺⌬兴其. 共5.14a兲
Case 2. One double root: 1⫽2⫽2 (␥⫽1/4),
Y共兲⫽A2
共2⫺4⫹4兲1⫹共1/2兲e
关2/共⫺2兲兴. 共5.14b兲
Case 3. Two distinct roots: 1,2⫽1/2␥⫾(1/2)
冑
⌬, and ⌬ ⫽1/␥2⫺4/␥⬎0, Y共兲⫽冦
A3 共1⫺兲1⫹共1/2兲⫺共1/2␥冑⌬兲共2⫺兲1⫹共1/2兲⫹共1/2␥冑⌬兲 , ⬍1 ⫺A4 共⫺1兲 1⫹共1/2兲⫺共1/2␥冑⌬兲共 2⫺兲 1⫹共1/2兲⫹共1/2␥冑⌬兲, 1⬍⬍2 A5 共⫺1兲1⫹共1/2兲⫺共1/2␥冑⌬兲共⫺2兲1⫹共1/2兲⫹共1/2␥冑⌬兲 , ⬎2 共5.14c兲for constants A1, . . . ,A5 to be determined. In Fig. 5, these
three cases are plotted. In all cases independent of , the large behavior of the integrand in Eq. 共5.12兲 is 1/Y ()
→large1/; therefore the largecontribution to the integral appears to be logarithmically divergent. Therefore, Y () should have an augmented form: it is one of the solutions given in Eq. 共5.14兲 between 0⭐⭐* and it must be equal to zero after the point⫽*.
The key to the divergency dilemma is basically an argu-ment of causality. If at time zero, there were only finite size particles, then in any finite time the PSD must be identically zero for allbeyond a cutoff value*.
The D-term in Eq.共3.4兲 involves, in the present notation, a term of the form d2Y /d2 if these correction terms were
retained. Thus, dY /d must be continuous for all ; other-wise the D-term would be infinite and the above solutions would be unphysical as the D-terms were assumed to be small. By a similar argument, the transformation of the dis-crete chemical kinetic model to the continuous one yields a sum of terms involving all derivatives. Thus, if any deriva-tive of Y with respect tois discontinuous at⫽*, then the solution will also be unphysical. More dramatically, these types of lack of smoothness in Y would imply a breakdown of the entire continuum theory, a physically nonintuitive re-sult. Thus, this implies, Y and all of its derivatives must be zero at⫽*.
For the Case 1 (␥⬎1
4), Y has no zero for 0⬍⬍⬁. In
Case 3 (␥⬍1
4), the solution has a divergence to the left of
where it has its first zero so that it cannot be a physical solution if ␥⬍(4⫹2)/(4⫹I)2⫽␥*. For ␥*⬍␥⬍14, a
surprising situation arises: there is a one parameter family of scaling solutions for which Y and its first derivative is zero at the first root, 1. For a given , with ␥ in this acceptable
range, the mode particle sizes of these solutions have the
same scaling exponent of time共see below兲. We do not inves-tigate further here which of these solutions is the most stable. However, as noted above all derivatives of Y with respect to
must vanish at*. This is the only case for␥⫽1
4, Case 2.
For Case 2 (␥⫽14), Y and all its derivatives vanish at ⫽2.
Note that for this case␥⫽14 and from Eq.共5.10兲 we see that
u and du/dvanish at⫽2 where Y vanishes. Thus, we find
␥⫽1
4 and*⫽2. With this the asymptotic PSD is given by
Y共兲⫽
冦
A*共1/兲e共1/兲 共*⫺兲2⫹共1/兲e ⫺共1/兲关*/共*⫺兲兴, for ⭐*⫽2 0, for ⭓* . 共5.15兲 The constant A is obtained from the mass conservation con-dition共5.12兲 one findsA⫽ Qc⬁ 兰0**1/e1/ 1⫹共1/兲 共*⫺兲2⫹共1/兲e⫺共1/兲关*/共*⫺兲兴d . 共5.16兲 In conclusion, ␥ is determined as an eigenvalue and A is implied by normalization. The cutoff at *⫽2 is a property of the form of the PSD equation and is required by the cau-sality. The vanishing of all derivatives at⫽*and the con-tinuity of dY /dfor 0⭐⭐*shows the self-consistency of our continuum approximation to the discrete chemical kinet-ics model.
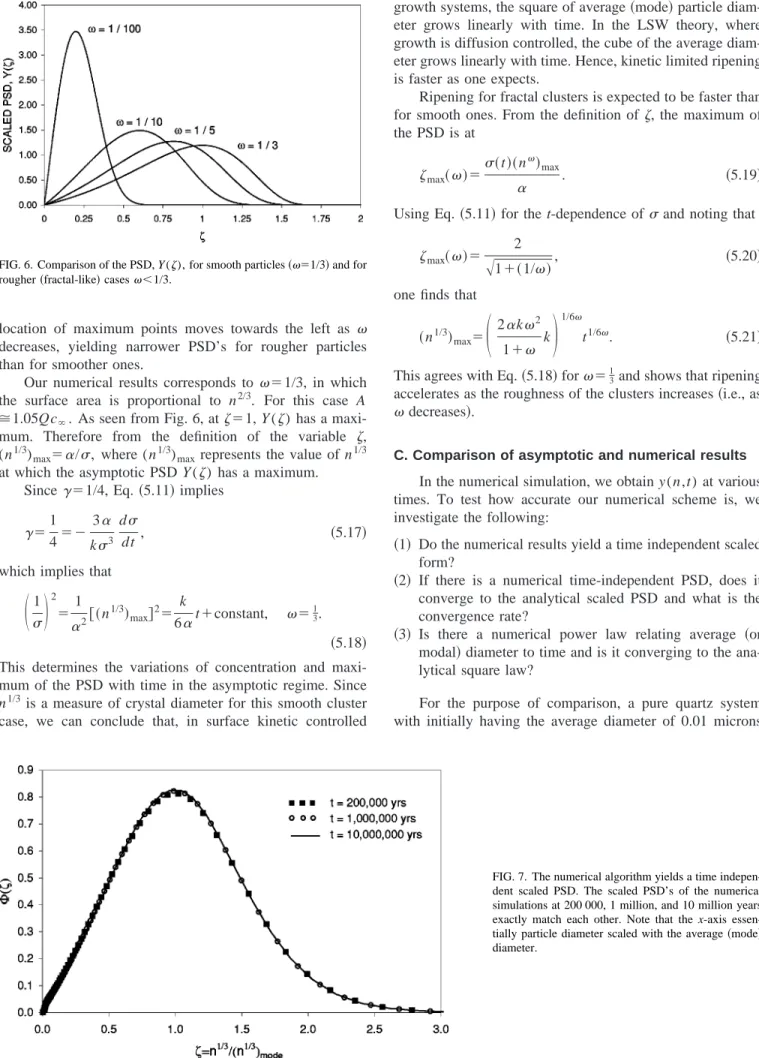
For rough 共fractal兲 particles, ⬍13. Three cases for
⬍1
3 are compared with the smooth particle case in Fig. 6.
The PSD’s are scaled to have unit area under the curves. The maximum point of the PSD’s are at */
冑
1⫹(1/), and thelocation of maximum points moves towards the left as decreases, yielding narrower PSD’s for rougher particles than for smoother ones.
Our numerical results corresponds to ⫽1/3, in which the surface area is proportional to n2/3. For this case A ⬵1.05Qc⬁. As seen from Fig. 6, at⫽1, Y() has a maxi-mum. Therefore from the definition of the variable , (n1/3)max⫽␣/, where (n1/3)maxrepresents the value of n1/3
at which the asymptotic PSD Y () has a maximum. Since␥⫽1/4, Eq. 共5.11兲 implies
␥⫽1 4⫽⫺ 3␣ k3 d dt , 共5.17兲
which implies that
冉
1 冊
2 ⫽1 ␣2关共n 1/3兲 max兴2⫽ k 6␣t⫹constant, ⫽ 1 3. 共5.18兲 This determines the variations of concentration and maxi-mum of the PSD with time in the asymptotic regime. Since n1/3 is a measure of crystal diameter for this smooth cluster case, we can conclude that, in surface kinetic controlledgrowth systems, the square of average共mode兲 particle diam-eter grows linearly with time. In the LSW theory, where growth is diffusion controlled, the cube of the average diam-eter grows linearly with time. Hence, kinetic limited ripening is faster as one expects.
Ripening for fractal clusters is expected to be faster than for smooth ones. From the definition of , the maximum of the PSD is at
max共兲⫽
共t兲共n兲
max
␣ . 共5.19兲
Using Eq. 共5.11兲 for the t-dependence ofand noting that
max共兲⫽
2
冑
1⫹共1/兲, 共5.20兲one finds that 共n1/3兲 max⫽
冉
2␣k2 1⫹ k冊
1/6 t1/6. 共5.21兲This agrees with Eq.共5.18兲 for⫽1
3and shows that ripening
accelerates as the roughness of the clusters increases共i.e., as
decreases兲.
C. Comparison of asymptotic and numerical results In the numerical simulation, we obtain y (n,t) at various times. To test how accurate our numerical scheme is, we investigate the following:
共1兲 Do the numerical results yield a time independent scaled form?
共2兲 If there is a numerical time-independent PSD, does it converge to the analytical scaled PSD and what is the convergence rate?
共3兲 Is there a numerical power law relating average 共or modal兲 diameter to time and is it converging to the ana-lytical square law?
For the purpose of comparison, a pure quartz system with initially having the average diameter of 0.01 microns
FIG. 6. Comparison of the PSD, Y (), for smooth particles共⫽1/3兲 and for rougher共fractal-like兲 cases⬍1/3.
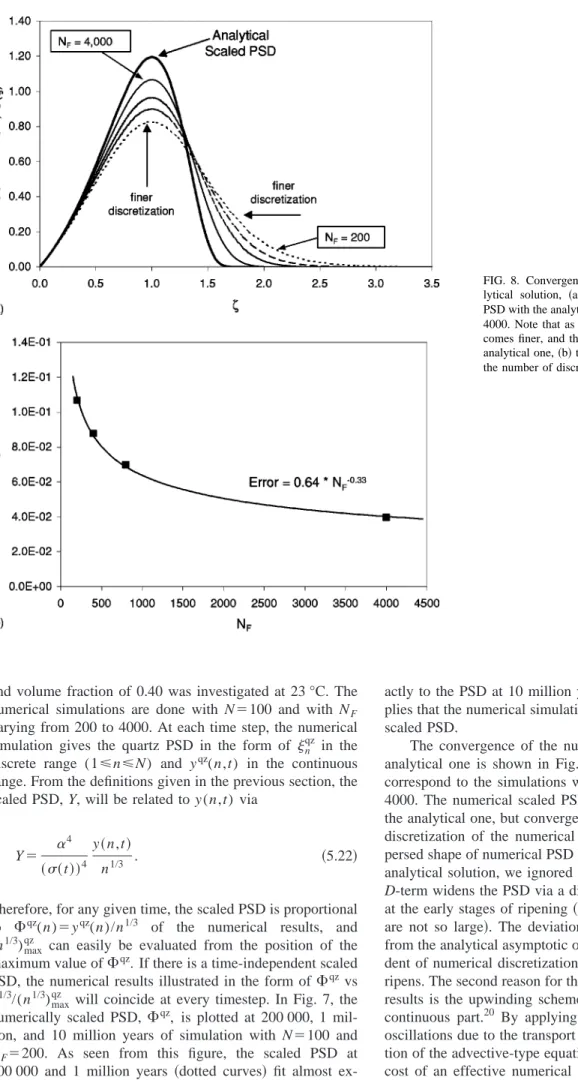
FIG. 7. The numerical algorithm yields a time indepen-dent scaled PSD. The scaled PSD’s of the numerical simulations at 200 000, 1 million, and 10 million years exactly match each other. Note that the x-axis essen-tially particle diameter scaled with the average共mode兲 diameter.
and volume fraction of 0.40 was investigated at 23 °C. The numerical simulations are done with N⫽100 and with NF varying from 200 to 4000. At each time step, the numerical simulation gives the quartz PSD in the form of nqz in the discrete range (1⭐n⭐N) and yqz(n,t) in the continuous range. From the definitions given in the previous section, the scaled PSD, Y, will be related to y (n,t) via
Y⫽ ␣
4
共共t兲兲4
y共n,t兲
n1/3 . 共5.22兲
Therefore, for any given time, the scaled PSD is proportional to ⌽qz(n)⫽yqz(n)/n1/3 of the numerical results, and (n1/3)maxqz can easily be evaluated from the position of the maximum value of⌽qz. If there is a time-independent scaled PSD, the numerical results illustrated in the form of⌽qzvs n1/3/(n1/3)maxqz will coincide at every timestep. In Fig. 7, the numerically scaled PSD, ⌽qz, is plotted at 200 000, 1 mil-lion, and 10 million years of simulation with N⫽100 and NF⫽200. As seen from this figure, the scaled PSD at 200 000 and 1 million years 共dotted curves兲 fit almost
ex-actly to the PSD at 10 million years共solid curve兲. This im-plies that the numerical simulation yields a time-independent scaled PSD.
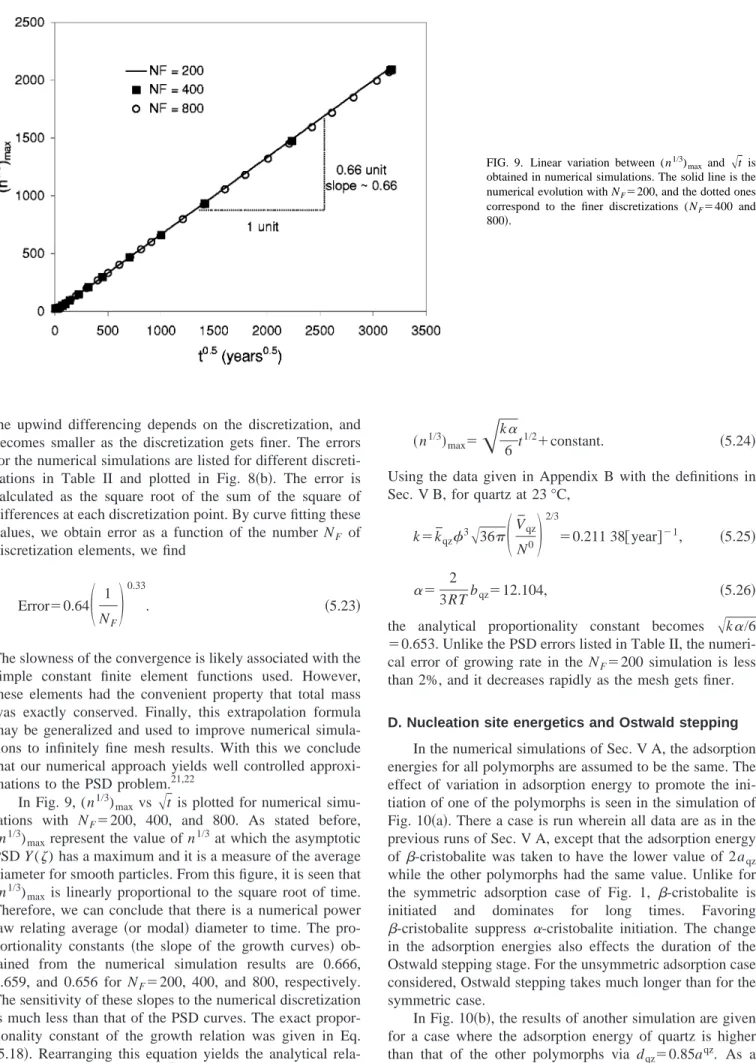
The convergence of the numerical scaled PSD’s to the analytical one is shown in Fig. 8共a兲. The numerical PSD’s correspond to the simulations with NF⫽200, 400, 800, and 4000. The numerical scaled PSD’s are more dispersed than the analytical one, but converge to the analytical PSD as the discretization of the numerical scheme gets finer. The dis-persed shape of numerical PSD has two origins. First, for the analytical solution, we ignored the D-term of Eq.共3.4兲. The D-term widens the PSD via a diffusionlike effect, especially at the early stages of ripening 共when the typical values of n are not so large兲. The deviation of the numerical solutions from the analytical asymptotic one due to D-term is indepen-dent of numerical discretization, and vanishes as the system ripens. The second reason for the dispersion of the numerical results is the upwinding scheme used in the solution of the continuous part.20 By applying the upwinding scheme, the oscillations due to the transport errors in the numerical solu-tion of the advective-type equasolu-tion共3.4兲 are overcome at the cost of an effective numerical dispersion. The error due to
FIG. 8. Convergence of numerical results to the ana-lytical solution, 共a兲 comparison of numerical scaled PSD with the analytical one for NF⫽200, 400, 800, and
4000. Note that as NFincreases, the discretization
be-comes finer, and the numerical results approach to the analytical one,共b兲 the error of numerical results versus the number of discretization elements NF.
the upwind differencing depends on the discretization, and becomes smaller as the discretization gets finer. The errors for the numerical simulations are listed for different discreti-zations in Table II and plotted in Fig. 8共b兲. The error is calculated as the square root of the sum of the square of differences at each discretization point. By curve fitting these values, we obtain error as a function of the number NF of discretization elements, we find
Error⫽0.64
冉
1 NF冊
0.33
. 共5.23兲
The slowness of the convergence is likely associated with the simple constant finite element functions used. However, these elements had the convenient property that total mass was exactly conserved. Finally, this extrapolation formula may be generalized and used to improve numerical simula-tions to infinitely fine mesh results. With this we conclude that our numerical approach yields well controlled approxi-mations to the PSD problem.21,22
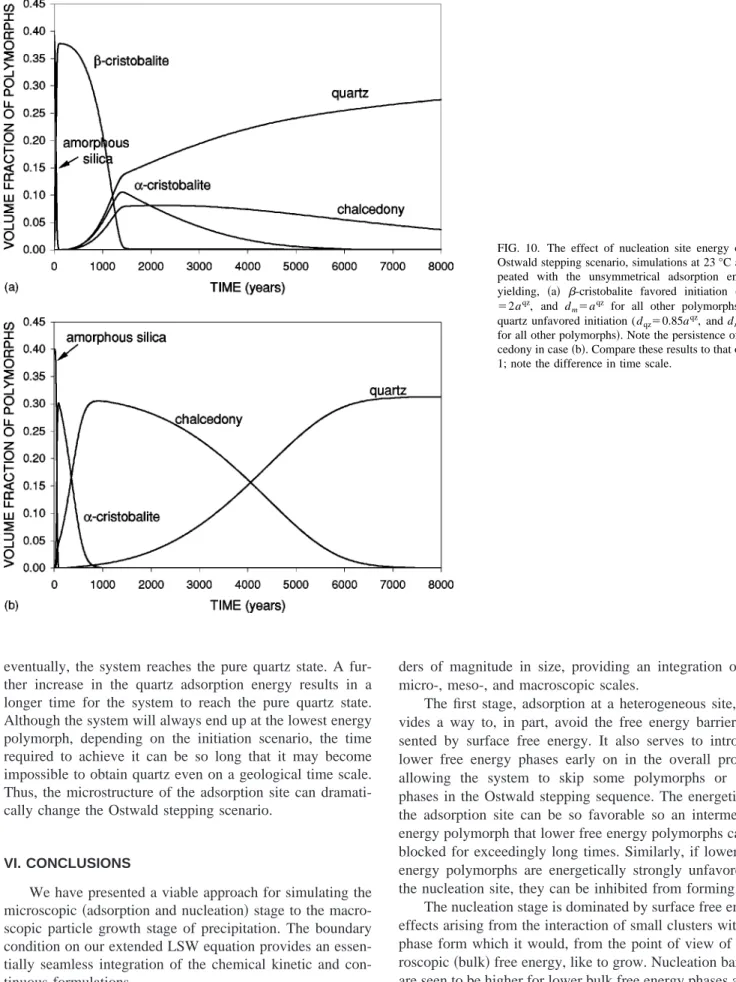
In Fig. 9, (n1/3)maxvs
冑
t is plotted for numericalsimu-lations with NF⫽200, 400, and 800. As stated before, (n1/3)maxrepresent the value of n1/3at which the asymptotic
PSD Y () has a maximum and it is a measure of the average diameter for smooth particles. From this figure, it is seen that (n1/3)maxis linearly proportional to the square root of time.
Therefore, we can conclude that there is a numerical power law relating average 共or modal兲 diameter to time. The pro-portionality constants 共the slope of the growth curves兲 ob-tained from the numerical simulation results are 0.666, 0.659, and 0.656 for NF⫽200, 400, and 800, respectively. The sensitivity of these slopes to the numerical discretization is much less than that of the PSD curves. The exact propor-tionality constant of the growth relation was given in Eq. 共5.18兲. Rearranging this equation yields the analytical rela-tion between (n1/3)maxand
冑
t as共n1/3兲
max⫽
冑
k␣ 6 t
1/2⫹constant. 共5.24兲
Using the data given in Appendix B with the definitions in Sec. V B, for quartz at 23 °C,
k⫽k¯qz3
冑
36冉
V ¯ qz N0冊
2/3 ⫽0.211 38关year兴⫺1, 共5.25兲 ␣⫽ 2 3RTbqz⫽12.104, 共5.26兲the analytical proportionality constant becomes
冑
k␣/6 ⫽0.653. Unlike the PSD errors listed in Table II, the numeri-cal error of growing rate in the NF⫽200 simulation is less than 2%, and it decreases rapidly as the mesh gets finer.D. Nucleation site energetics and Ostwald stepping In the numerical simulations of Sec. V A, the adsorption energies for all polymorphs are assumed to be the same. The effect of variation in adsorption energy to promote the ini-tiation of one of the polymorphs is seen in the simulation of Fig. 10共a兲. There a case is run wherein all data are as in the previous runs of Sec. V A, except that the adsorption energy of -cristobalite was taken to have the lower value of 2aqz while the other polymorphs had the same value. Unlike for the symmetric adsorption case of Fig. 1, -cristobalite is
initiated and dominates for long times. Favoring
-cristobalite suppress ␣-cristobalite initiation. The change in the adsorption energies also effects the duration of the Ostwald stepping stage. For the unsymmetric adsorption case considered, Ostwald stepping takes much longer than for the symmetric case.
In Fig. 10共b兲, the results of another simulation are given for a case where the adsorption energy of quartz is higher than that of the other polymorphs via dqz⫽0.85aqz. As a
result, chalcedony dominates over quartz for a long time; but
FIG. 9. Linear variation between (n1/3)
maxand 冑t is obtained in numerical simulations. The solid line is the numerical evolution with NF⫽200, and the dotted ones
correspond to the finer discretizations (NF⫽400 and
eventually, the system reaches the pure quartz state. A fur-ther increase in the quartz adsorption energy results in a longer time for the system to reach the pure quartz state. Although the system will always end up at the lowest energy polymorph, depending on the initiation scenario, the time required to achieve it can be so long that it may become impossible to obtain quartz even on a geological time scale. Thus, the microstructure of the adsorption site can dramati-cally change the Ostwald stepping scenario.
VI. CONCLUSIONS
We have presented a viable approach for simulating the microscopic共adsorption and nucleation兲 stage to the macro-scopic particle growth stage of precipitation. The boundary condition on our extended LSW equation provides an essen-tially seamless integration of the chemical kinetic and con-tinuous formulations.
The four stages of precipitation can each profoundly af-fect the evolution of the system. Our conclusions are based on a new treatment of the chemical kinetic model of precipi-tation that captures the evolution of clusters on over 23
or-ders of magnitude in size, providing an integration of the micro-, meso-, and macroscopic scales.
The first stage, adsorption at a heterogeneous site, pro-vides a way to, in part, avoid the free energy barrier pre-sented by surface free energy. It also serves to introduce lower free energy phases early on in the overall process, allowing the system to skip some polymorphs or other phases in the Ostwald stepping sequence. The energetics of the adsorption site can be so favorable so an intermediate energy polymorph that lower free energy polymorphs can be blocked for exceedingly long times. Similarly, if lower free energy polymorphs are energetically strongly unfavored at the nucleation site, they can be inhibited from forming.
The nucleation stage is dominated by surface free energy effects arising from the interaction of small clusters with the phase form which it would, from the point of view of mac-roscopic共bulk兲 free energy, like to grow. Nucleation barriers are seen to be higher for lower bulk free energy phases as the latter appear to have higher surface energy. The surface free energy barriers are thwarted by higher temperature or when the spatial range of influence of the heterogeneous site ex-ceeds the critical nucleus size. While not considered here, it
FIG. 10. The effect of nucleation site energy on the Ostwald stepping scenario, simulations at 23 °C are re-peated with the unsymmetrical adsorption energies yielding, 共a兲 -cristobalite favored initiation (d⫺cr ⫽2aqz, and d
m⫽aqz for all other polymorphs兲, 共b兲
quartz unfavored initiation (dqz⫽0.85aqz, and dm⫽aqz
for all other polymorphs兲. Note the persistence of chal-cedony in case共b兲. Compare these results to that of Fig. 1; note the difference in time scale.
is clear that differences in adsorption components in the growth medium with the surface of the various polymorphs can also dramatically change the order in which the various polymorphs nucleate.
The Ostwald stepping stage, the competition of the vari-ous phases for common building blocks关here SiO2共aq兲]
al-ways results in the final stage with the low free energy phase. As the difference in the bulk free energies of the latter de-creases, the persistence of near lowest bulk free energy phases increases. Both temperature and nucleation site ener-getics can dramatically change the stepping scenario.
The ripening stage, which may overlap with stepping, leads to the long time state of fewer but larger particles. At long times LSW-type scaling is achieved but with a time scaling that depends on both the rate limiting growth process 共attachment kinetics versus diffusion兲 as well as the rough-ness of the particles. For smooth particles, ripening is slower than for rough共fractal兲 particles.
The methods used in this study can be generalized to multimineralic systems or to more complex 共multicompo-nent兲 growth media. These generalizations and the extension to open and spatially nonuniform systems shall enable us to analyze the effects of the infiltration of fluids into seafloor sediments and metasomatic, weathering and many other geochemical systems as well as engineering contexts where precipitation plays an important role. In all such contexts, the methodology presented should provide an effective frame-work for simulating the microscopic→macroscopic transi-tion underlying precipitatransi-tion dynamics.
ACKNOWLEDGMENT
We thank the Division of Earth Sciences of Directorate for Geosciences of National Science Foundation for support of this project.
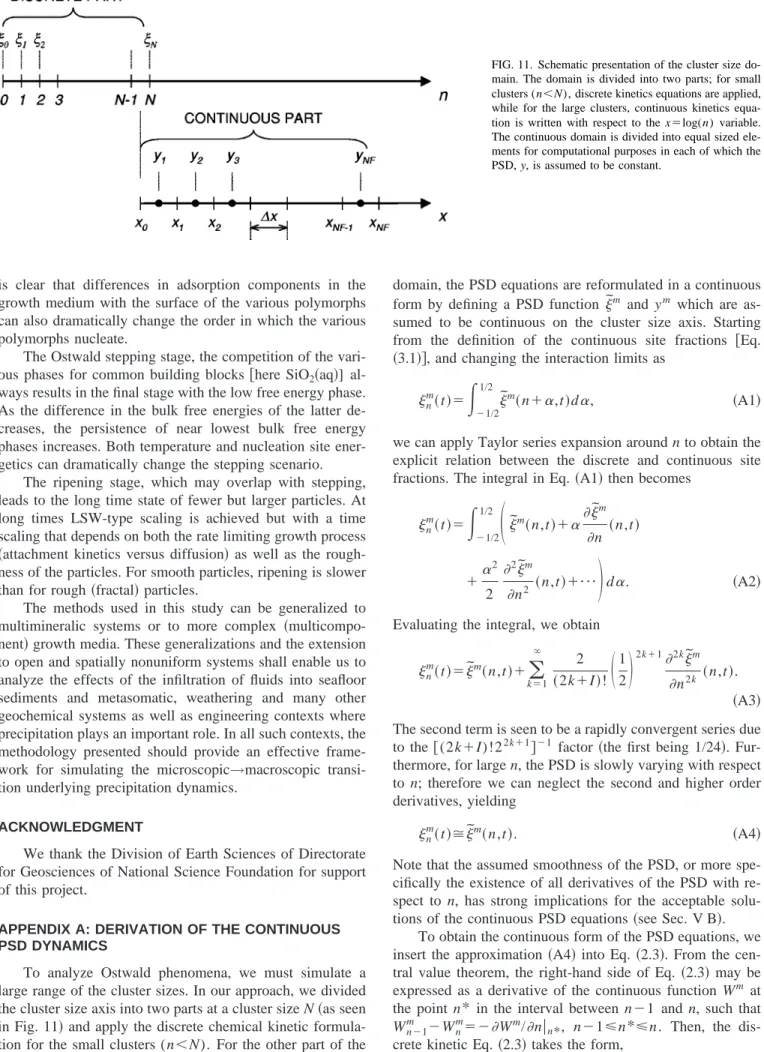
APPENDIX A: DERIVATION OF THE CONTINUOUS PSD DYNAMICS
To analyze Ostwald phenomena, we must simulate a large range of the cluster sizes. In our approach, we divided the cluster size axis into two parts at a cluster size N共as seen in Fig. 11兲 and apply the discrete chemical kinetic formula-tion for the small clusters (n⬍N). For the other part of the
domain, the PSD equations are reformulated in a continuous form by defining a PSD function˜m and ym which are as-sumed to be continuous on the cluster size axis. Starting from the definition of the continuous site fractions 关Eq. 共3.1兲兴, and changing the interaction limits as
n m共t兲⫽
冕
⫺1/2 1/2 ˜m共n⫹␣,t兲d␣, 共A1兲we can apply Taylor series expansion around n to obtain the explicit relation between the discrete and continuous site fractions. The integral in Eq. 共A1兲 then becomes
n m共t兲⫽
冕
⫺1/2 1/2冉
˜m共n,t兲⫹␣ ˜m n 共n,t兲 ⫹␣ 2 2 2˜m n2 共n,t兲⫹¯冊
d␣. 共A2兲 Evaluating the integral, we obtainn m共t兲⫽˜m共n,t兲⫹
兺
k⫽1 ⬁ 2 共2k⫹I兲!冉
1 2冊
2k⫹12k˜m n2k 共n,t兲. 共A3兲 The second term is seen to be a rapidly convergent series due to the 关(2k⫹I)!22k⫹1兴⫺1 factor共the first being 1/24兲.Fur-thermore, for large n, the PSD is slowly varying with respect to n; therefore we can neglect the second and higher order derivatives, yielding
n
m共t兲⬵˜m共n,t兲. 共A4兲
Note that the assumed smoothness of the PSD, or more spe-cifically the existence of all derivatives of the PSD with re-spect to n, has strong implications for the acceptable solu-tions of the continuous PSD equasolu-tions 共see Sec. V B兲.
To obtain the continuous form of the PSD equations, we insert the approximation共A4兲 into Eq. 共2.3兲. From the cen-tral value theorem, the right-hand side of Eq. 共2.3兲 may be expressed as a derivative of the continuous function Wm at the point n* in the interval between n⫺1 and n, such that Wnm⫺1⫺Wnm⫽⫺Wm/n兩n*, n⫺1⭐n*⭐n. Then, the dis-crete kinetic Eq. 共2.3兲 takes the form,
FIG. 11. Schematic presentation of the cluster size do-main. The domain is divided into two parts; for small clusters (n⬍N), discrete kinetics equations are applied, while for the large clusters, continuous kinetics equa-tion is written with respect to the x⫽log(n) variable. The continuous domain is divided into equal sized ele-ments for computational purposes in each of which the PSD, y, is assumed to be constant.
˜m共n,t兲 t ⫽⫺ Wm n
冏
n * ⫽⫺ n关kn m共K n mc˜m共n,t兲⫺˜m共n⫹1,t兲兲兴 n*. 共A5兲 Using a first order Taylor expansion of˜m around n, with n⫺n*⫽⌬, yields ˜m t ⫽⫺ n冋
kn⫺⌬ m冉
共Kn⫺⌬ m c⫺I兲˜m ⫺共Kn⫺⌬ m c⌬⫹共1⫺⌬兲兲 ˜m n冊
册
. 共A6兲 The value of⌬ is chosen in our approach to insure that the summation/integration of the site fractions over the whole range of cluster size should be unity at all times. Therefore, the time derivative of site fractions adds up to zero over full range of n, d0 dt ⫹m兺
⫽1 M兺
n⫽1 ⬁ d n m dt ⫽0, 共A7兲where all the variables are the same as defined in Sec. II. Applying the discrete formulation up to cluster size N⫺1 and the continuous formulation for the region N⫺12⭐n⬍⬁
共as suggested in Fig. 11兲, the conservation of nucleation sites takes the form
d0 dt ⫹m
兺
⫽1 M再
n兺
⫽1 N⫺1 dn m dt ⫹冕
n⫺1/2 ⬁ ˜m t dn冎
⫽0. 共A8兲 Using Eqs.共2.3兲 and 共A6兲, we obtain兺
m⫽1 M再
⫺WN⫺1 m ⫹冉
k n⫺⌬ m 共K n⫺⌬ m c⫺1兲˜m共n,t兲 ⫺kn⫺⌬ m 共K n⫺⌬ m c⌬⫹共1⫺⌬兲兲 ˜m n 共n,t兲冊
N⫺1/2冎
⫽0. 共A9兲 Equation共A9兲 is to be satisfied for all possible cases; thus it must hold for situations in which the˜m, n
mare zero for all but one polymorph only. In this way, Eq. 共A9兲 holds for every polymorph separately. Inserting the expression for Wn
m given in Eq. 共2.4兲 and evaluating the continuous part at n ⫽N⫺1 2, one obtains kNm⫺1共KNm⫺1cNm⫺1⫺Nm兲 ⫽kN⫺共1/2兲⫺⌬ m
冉
共K N⫺共1/2兲⫺⌬ m c⫺1兲˜m共N⫺1 2,t兲 ⫺共KN⫺共1/2兲⫺⌬ m c⌬⫹共1⫺⌬兲兲 ˜m n 共N⫺ 1 2,t兲冊
. 共A10兲From Eq. 共A10兲, it can be concluded that, ⌬⫽12, and the
boundary conditions for the discrete and continuous formu-lations at the interface which satisfy Eq. 共A10兲 are
N⫺1 m ⫽ ˜m兩 n⫽N⫺共1/2兲⫺ 1 2 ˜m n
冏
n ⫽N⫺1/2 , 共A11兲 N m⫽˜m兩 n⫽N⫺共1/2兲⫹ 1 2 ˜m n冏
n⫽N⫺共1/2兲 .Inserting ⌬⫽12 into Eq.共A6兲, the continuous PSD equation
takes the form,
˜m t ⫽⫺ n
冋
kn⫺共1/2兲 m冉
共K n⫺共1/2兲 m c⫺1兲˜m ⫺12共Kn⫺共1/2兲 m c⫹1兲 ˜m n冊
册
. 共A12兲In terms of the continuous cluster volume fraction function ym, where ym(n,t)⫽n˜m(n,t), Eq.共A12兲 takes the form
ym t ⫽⫺ 1 n n
冋
kn⫺共1/2兲 m冉再
1 n共Kn⫺共1/2兲 m c⫺1兲 ⫹ 1 2n2共Kn⫺共1/2兲 m c⫹1兲冎
ym ⫺ 1 2n共Kn⫺共1/2兲 m c⫹1兲y m n冊
册
. 共A13兲Changing from n to x⫽ln(n), the continuous equations for the PSD takes the form of Eq.共3.4兲.
APPENDIX B: SiO2DATA
Rearranging Eqs. 共4.1兲–共4.4兲, the equilibrium constant for an m,n-cluster is given by
RT ln
冉
1 Kn m冊
⫽gn⫹1 m ⫺g n m⫺ SiO2共aq兲 **⫽共n兲dm⫹共1⫺共n兲兲am⫺SiO**2共aq兲⫹共1⫺共n兲兲
⫻bm关共n⫹1兲2/3⫺n2/3兴. 共B1兲 For large crystals, n→⬁, the solubility 共i.e., 1/Knm) only de-pends on the bulk free energy via
RT ln
冉
1K⬁m
冊
⫽RT ln共c⬁m兲⫽a
m⫺SiO**2共aq兲, 共B2兲
where c⬁mis the concentration共mol/l兲 of SiO2共aq兲 in equilib-rium with bulk polymorph m. With this, the equilibequilib-rium con-stant of m,n-cluster becomes
ln共Knm兲⫽⫺ln共c⬁m兲⫺共n兲
冉
dm⫺SiO**2共aq兲 RT ⫺ln共c⬁ m兲冊
⫺共1⫺共n兲兲bm RT关共n⫹1兲 2/3⫺n2/3兲. 共B3兲To calculate Knmat a specific temperature, the bulk solubility (c⬁m), surface free energy (bm), and adsorption energy (dm) of polymorph m are needed.
1. Bulk solubility„cⴥm…
Walther and Helgeson18 calculated bulk solubilities for silica polymorphs at temperatures ranging from 0 to 600 °C and these calculated solubilities are in agreement with ex-perimentally derived values. In our numerical simulations, the bulk solubilities at a given temperature are calculated by polynomial approximation of the curves given by Walther and Helgeson.18
2. Surface free energy„bm…
Where experimental data are available, surface free en-ergies can be estimated using the observed dependence of solubility on specific surface area. These experiments have been reported for amorphous silica and quartz.17 If the SiO2
units on the surface of a grain partially project into the aque-ous medium and partly reside in the bulk, then we might assume that the interfacial free energy is a weighted sum of the bulk and solution free energies; thus we conjecture
m⫽共ASiO**2共aq兲⫺Bam兲 ⌬m
V ¯
m
, 共B4兲
wherem⫽surface free energy of m in contact with an aque-ous solution; ⌬m⫽(V¯m/N0)1/3⫽ lattice spacing normal to the surface 共on the order of the thickness of the surface layer兲; A⫽3.39643, B⫽0.53.
The coefficients A and B were determined by substitut-ing known m values for quartz and amorphous silica into Eq. 共B4兲.
The surface free energy coefficient, bm, is calculated from mvia bm⫽4m
冉
3V¯m 4N0冊
2/3 . 共B5兲3. Adsorption energy„dmÀSiO
2„aq…
** …
The kinetics of small clusters and nucleation initiation are strongly affected by the adsorption energy of SiO2 units
to the site of nucleation. Clearly this quantity depends strongly on the atomic-scale geometry and chemical nature of the heterogeneous nucleation site. Values of dmare there-fore most likely to be best estimated using molecular me-chanics software and is beyond the scope of this study.
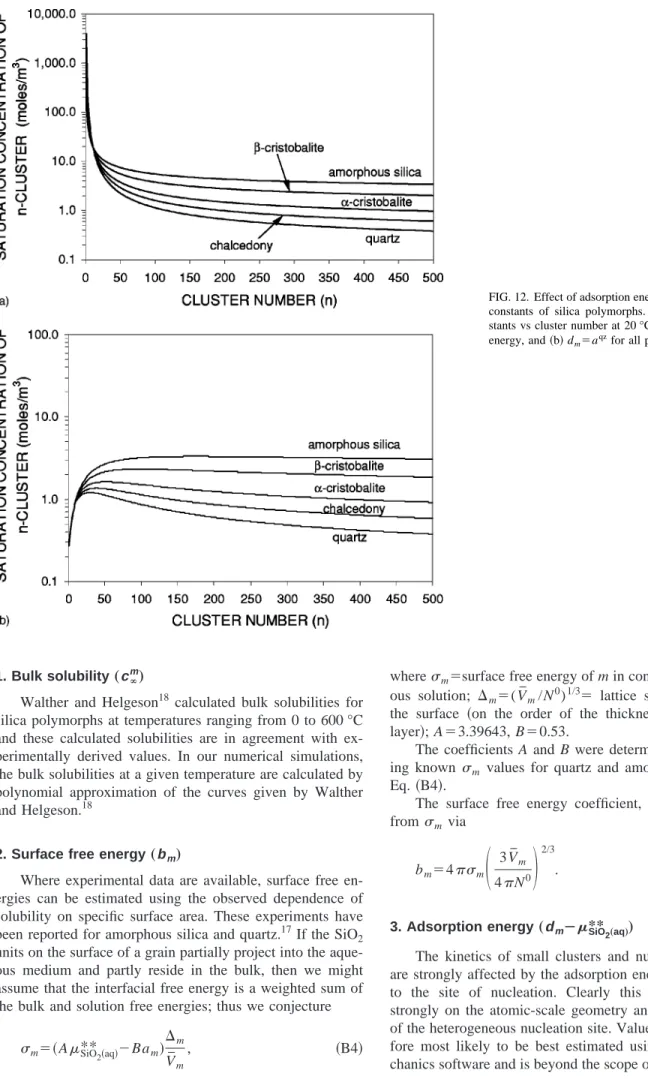
How-FIG. 12. Effect of adsorption energy on the equilibrium constants of silica polymorphs. The equilibrium con-stants vs cluster number at 20 °C for共a兲 no adsorption energy, and共b兲 dm⫽a
qz
ever, we have included this parameter in our study to investigate the sensitivity of the nucleation and Ostwald pro-cesses to this parameter. In Fig. 12, the effect of adsorption energy on saturation concentrations (Knm)⫺1 are shown. In these figures, temperature is 20 °C and the diameter of the nucleation site is assumed to be 100 Å. If there is no adsorp-tion energy, the initiaadsorp-tion of quartz needs a huge supersatu-ration as seen in Fig. 12共a兲. Therefore, with no adsorption energy, at 20 °C the initiation of quartz is practically impos-sible. In Fig. 12共b兲, the adsorption energies for all polymor-phs are chosen to be the same, i.e., dm⫽aqz. This selection
enables the initiation of quartz, even at the saturation con-centration of bulk quartz.
4. Rate coefficients„k¯m…
We obtained rate coefficients from experimental data as follows. The rate of change of the number of SiO2 units in
the solid phase per unit time is given by d
dt
冉
number of units in solid state per unit system volume
冊
⫽T兺
m,n ndn m dt ⫽T兺
m,n Wn m⫽ T兺
m,n kn m关K n m cn m⫺ n⫹1 m 兴, 共B6兲where the variables are the same as described in Sec. II. Consider a monomineralic, monodisperse system of particles of mineral m, where nm⫽0 for n⫽n
⬘
, nm⬘⫽1. When n⬘
is sufficiently large, the rate coefficient varies slowly with re-spect to n, and thus, we can assume kn⬘⫺1
m ⬇k
n⬘ m
. With these, the change in number of SiO2in monodisperse systems
be-comes d dt
冉
number of units in solid state per unit system volume
冊
⫽Tkn⬘ m
共Kn⬘ m
c⫺1兲. 共B7兲
From experimental data 共see Refs. 19 and 23兲 the crystal growth rate is
dr
dt⫽V¯mqm共Kn⬘ m
c⫺1兲, 共B8兲
where qm⫽experimental first order rate coefficient for disso-lution共mol m⫺2s⫺1兲; r⫽grain radius 共m兲.
The change of number of units in one grain of mineral m per unit time is
d dt
冉
number of units in one grain冊
⫽N 0 V ¯ m 4r2dr dt⫽冉
Surface area of the grain冊
N 0q m共Kn⬘ m c⫺1兲. 共B9兲 In the monomineralic, monodisperse system T is the total number of grains per unit system volume, and, using Anm⬘for the surface area of an n⬘
cluster, one findsd dt
冉
number of units in solid state per unit system volume
冊
⫽TAn⬘ m N0q m共Kn⬘ m c⫺1兲. 共B10兲 Comparing Eqs. 共B7兲 and 共B10兲 yields knm⬘⫽Anm⬘N0qm. For sufficiently large, smooth clusters, the rate coefficient is in-dependent from the adsorption effects the rate coefficient per unit area is related to the experimental dissolution rate via
k ¯
m⫽qmN0. 共B11兲
1
P. Ortoleva, Geochemical Self-Organization 共Oxford University Press, New York, 1994兲.
2J. W. Morse and W. M. Casey, Am. J. Sci. 288, 537共1988兲. 3J. W. Morse and Q. Wang, Am. J. Sci. 296, 989共1996兲. 4
C. I. Steefel and P. Van Cappelen, Geochim. Cosmochim. Acta 54, 2657
共1990兲.
5K. Miyazaki, Geochim. Cosmochim. Acta 60, 277共1996兲.
6W. D. Carlson, C. Denison, and R. A. Ketcham, Geological J. 30, 207 共1995兲.
7
M. Tomellini, Appl. Surf. Sci. 99, 67共1996兲.
8R. R. Bitti and P. E. di Nunzio, Scr. Mater. 39, 335共1998兲. 9R. Poduri and L.-Q. Chen, Acta Mater. 46, 3915共1998兲.
10I. M. Lifshitz and V. V. Slyozov, J. Phys. Chem. Solids 19, 35共1961兲. 11
C. Wagner, Ber. Bunsenges. Phys. Chem. 651, 581共1961兲.
12
A. J. Ardell, Acta Metall. 20, 61共1972兲.
13M. Tsumuraya and Y. Miyate, J. Mater. Sci. 32, 2001共1983兲. 14J. A. Marqusee and J. Ross, J. Chem. Phys. 80, 536共1984兲. 15P. W. Voorhees, J. Stat. Phys. 38, 231共1985兲.
16
M. Tokuyama and K. Kawasaki, Physica A 123, 386共1984兲.
17P. M. Dove, ‘‘Kinetic and thermodynamic controls on silica reactivity in
weathering environments,’’ in Chemical Weathering Rates of Silicate Minerals, Reviews in Mineralogy, edited by A. F. White and S. L. Brant-ley共Mineralogical Society of America, Washington, 1995兲, Vol. 31.
18
J. V. Walther and H. C. Helgeson, Am. J. Sci. 277, 1315共1977兲.
19J. D. Rimstidt and H. L. Barnes, Geochim. Cosmochim. Acta 44, 1683 共1980兲.
20C. A. J. Fletcher, Computational Techniques for Fluid Dynamics 2:
Spe-cific Techniques for Different Flow Categories共Springer-Verlag, Berlin, 1991兲.
21S. Kai, S. C. Muller, and J. Ross, J. Chem. Phys. 76, 1392共1982兲. 22V. Nasreddine and R. Sultan, J. Phys. Chem. A 103, 2934共1999兲. 23P. J. N. Renders, C. H. Gammons, and H. L. Barnes, Geochim.