THE PERFORMANCE OF IPOS IN ISTANBUL STOCK
EXCHANGE IN YEAR 2000
2000 YILINDA STANBUL MENKUL KIYMETLER BORSASIN’DA HALKA LK ARZI YAPILAN H SSE SENETLER N N PERFORMANSI
Suat TEKER , Ömer EK T
Istanbul Technical University
ABSTRACT : Initial public offering (IPO) may be the lowest cost financing for firms to obtain funds from small and institutional investors. The commissions, fees and other related expenses incurred are considerably small compared to those of short or long term loan or bond financing. This empirical study examines the performance of all IPOs in Istanbul Stock Exchange during the year of 2000. The study employs standard event study methodology for 34 IPOs over a 30 day event window. The empirical findings are consistent with most of the previous literature. The results support that the first two days of IPOs generally provide positive abnormal returns.
Keywords: Initial public offering, underpricing, abnormal return, event-study
ÖZET : Firmaların halka ilk arz yoluyla küçük ve kurumsal yatırımcılardan fon
toplaması dü ük maliyetli finanslama yollarından biri olabilir. Tahvil ihracı ve bankalardan kısa ve uzun vadeli kredi almanın maliyetleri, halka ilk arzın komisyon ve di er maliyetleriyle kar ıla tırıldı ında oldukça yüksek olabilir. Bu ampirik çalı ma 2000 yılında Istanbul Menkul Kıymetler Borsasında halka ilk arzı yapılan hisse senetlerinin performanslarını incelemektedir. Bu analizde literatürde yaygın olarak kullanılan “event-study” yöntemi uygulanarak halka ilk arzı yapılan 34 firmanın 30 günlük arz sonrası performansı ölçülmü tür. Ampirik bulgular literatürde geçen di er çalı malar sonuçlarıyla uyumludur. Elde edilen sonuçlara göre, halka arzın ilk iki gününde yatırımcıların normal üstü getiri elde etmeleri mümkündür.
Anahtar Kelimeler: Halka ilk arz, dü ük fiyatlama, normal üstü getiri,
olay-çalı ması.
1. Introduction
The purpose of this empirical study is to analyse the aftermarket performance of initial public offerings (IPOs) in Istanbul Stock Exchange (ISE) in year 2000. There are total of 35 IPOs in year 2000. One of the initial offerings is eliminated due to data problems. This study examines only short-term aftermarket performances in a 30-day event window by employing standard event study methodology.
The first part of the paper reviews some useful methods for evaluation of common stocks. Next, previous literature about IPO aftermarket performances is briefly
summarized. Then, data and methodology used in the study are explained. Finally, empirical findings and conclusions are presented.
2. IPO Pricing
Pricing of stocks in IPOs may be the most critical stage of the whole going public process since the stock prices calculated for IPOs deeply affect the aftermarket performance of IPOs.
The expectations of issuing firms, investors and underwriters in IPO pricing are considerably different. Issuing firms like to get the highest issuing price to maximize cash flows to the firm. Investors like to purchase shares at a deep discounted price so that they can realize good returns in a short investment period. Underwriters act as an intermediary between investors and issuing firms. If an underwriter determines IPO prices low, the issuing firm may withdraw or switch to another underwriter. If an underwriter determines IPO prices relatively high, investors may be reluctant to buy new issues which results low commissions and/or unwantedinvestment in stocks for the underwriter.
Number of models are available in the literature for valuation of common stocks. Among these, p/e ratio, market-to-book value (m/b), book value (bv) and discounting future cash flows may be the most common models employed in IPO pricing.
2.1. p/e Ratio
Application of this model requires identifying number of similar companies. Then, market prices of common stocks and earnings of firms are averaged and used the stock price determination in IPOs.
IPO share price = (p/e)ave (eiss.firms) (1)
p/e represents average price per share over earnings per share of similar companies for a certain period. Earnings per share (e) is computed by dividing net income available shareholders to the number of common shares outstanding. After computing p/e ratio of similar firms, earnings per share of IPO firm is estimated by dividing the expected net income to shareholders by the number of common shares expected to be outstanding after IPO. Finally, average p/e ratio of similar firms is multiplied by the estimated e of IPO firm.
There may be two advantages of this method. p/e ratio shows the attractiveness of IPO shares at the issuing date compared to similar shares at the market. Moreover, p/e ratio provides a comparison of share prices of similar firms. The major disadvantage of this model is that p/e ratio doesn’t consider future outlook of the firm which ignores the firms’ ability to generate revenue and cash in the future.
2.2. Book Value
This model assumes that all assets on the balance sheet of the issuing firm are carried at market values. Therefore, the deduction of liabilities from total assets provides the book value of the issuing firm. The book value of the firm is then divided by the number of common shares to compute IPO pricing.
IPO Share Price = (T.Assets – T. Liabilities) / Num. of Com. Shares Outstanding (2) The most crucial disadvantage of this model is that accounting figures on financial statements provide very little information about the real value of the firms.
2.3. Market-to-Book Value (m/b)
This model uses market value per share over book value per share of similar firms as a reference point to determine share price in IPOs. As the average market prices of shares of similar firms may be chosen daily, weekly or monthly prices. Book value per share is simply the division of net worth to the number of shares outstanding. Next, the book value of IPO firm is computed and multiplied by the average m/b ratio of similar firms.
IPO share price = (m/b)ave (biss.firm) (3)
2.4. Discounting Cash Flows
This model first predicts the expected future free cash flows to common shareholders. Free cash flows could be defined as the amount of cash available to common shareholders after making all required cash payments for expenses and cash investments in assets. The predicted cash flows may mainly be composed of cash dividends. The model assumes that cash dividend payments may have no growth or grow at a constant rate or various rates for some years then converges to a constant rate through infinity. Finally, all predicted dividends are discounted to today. The weighted average cost of capital is often applied as the discount rate in the model.
The weighted average cost of capital can be computed as follows; k= wd(1-T)kd +
wpskps + wcskcs. The discounted value is determined to be the share price of issuing
firm.
IPO share price = ∞t=1 CFt /(1+k)t (4)
3. Factors Affecting IPO Pricing
Underwriters tend to determine IPOs underpriced to stimulate the demand for new issues. There could be a number of factors proposed by the previous literature explaining underpricing.
Asset Size- A firm possessing larger amount of total assets may have less uncertainty
about its existence in the future. Therefore, there may be less tendency for underpricing for larger firms.
Firm’s Age- The more number of years the firm in operations, the less uncertainty
for investors, and therefore, the less tendency for underpricing.
Total IPO Size- Smaller dollar amount IPOs may be more speculative for investors.
Therefore, larger underpricing may be expected for smaller dollar value IPOs.
Market Return- The market’s average return may increase during the time between
the determination of IPO price and first day of trading. This may cause IPOs to look underpriced.
Going Public Ratio- This ratio may signal investors in two different ways. A small
ratio of going public may signal less uncertainty that major shareholders are very confident about the firm. On the other hand, a small ratio of going public may also signal more uncertainty that major shareholders look hesitating sharing earnings and
control of the firm. Therefore, going public ratio may affect underpricing either positively or negatively.
Standard Deviation- Higher the standard deviation in earnings presents higher
uncertainty for investors and so more tendency for higher underpricing.
Type of Public Offering- Public offerings could be made by issuing new common
shares for new investors or sales of major shareholders’shares or mixture of both. In the first type of public offerings, the cash generated is used by the firm. In the later type of public offerings, the cash generated may not be used by the firm. Therefore, the second and third type of offerings poses more uncertainty for investors.
4. Underpricing of IPOs
Previous literature argues that asymmetric information among issuers to investors, and investors to investors may cause underpricing of IPOs.
Baron (1982) proposes that issuing firms accept the underwriter determined price since issuing firm doesn’t have sufficient information about the level of its market price. Therefore, the issuing firms accept underpricing.
Another factor that accounts for the underpricing of IPOs is the institutional lag, which implies the rise of the stock exchange index between pricing and offering periods. (Kıymaz, 1997)
Differently informed investors pose an important role in the underpricing of IPOs. For instance, in Rock’s Winner’s Curse Model (1986), informed investors only prefer IPOs they know to be underpriced; and this fact forces underwriters to underprice IPOs. (Rock, 1986)
The empirical results obtained in Kıymaz’s study (1997) for Istanbul Stock Exchange support Rock’s asymmetric information hypothesis. Informed investors would only buy shares if they are underpriced. Knowing this, underwriters tend to underprice IPOs.
5. Data and Methodology
A total of 34 IPOs in ISE in year 2000 are examined by using standard event study methodology. The daily adjusted stock returns are downloaded form ISE web page. The performance of IPOs are measured by abnormal returns over CAPM predicted returns.
Event study methodology is based on acceptance of efficient market hypothesis. The theory states that the value of a security is equal to the discounted value of its all future cash flows and this value includes all information about the firm. Security market line formulation is used in event studies to compute market adjusted stock returns.
Rit = Rf + (Rm – Rf) bit (5)
If an unexpected information becomes available for market participants, the value of security changes to reflect the value of new information. The firm value affected by a new information could be captured by abnormal returns.
ARit = Rit - Rmt (6)
R represents actual stock’s returns, Rmt represents market adjusted stock returns
while AR represents abnormal returns.
Firstly, a similar firm based on industry classification and the size of total assets and sales is chosen for each IPO. Next, beta coefficient of similar firm is computed by using previous 91-day returns (Appendix B). Then, risk-free rate is determined by using 91-day T-Bills interest rates (Appendix A).
Finally, utilizing security market line equation, market adjusted stock returns are computed in the event window. Next, the difference between actual returns and computed returns are calculated. The differences are called abnormal returns. Abnormal returns of each IPO are computed, and accumulated for 30-day event window.
6. Empirical Findings
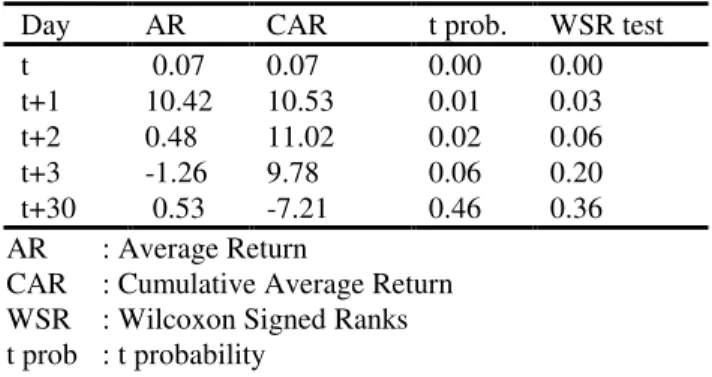
Event day is identified as day t, and aftermarket performances of IPOs are examined for next 30 days. For computed abnormal returns, t test statistics and Wilcoxon Signed Ranks Test statistics are applied. Table 1 summarizes the empirical findings;
Table 1: Abnormal and Cumulative Abnormal Returns of IPOs
Day AR CAR t prob. WSR test
t 0.07 0.07 0.00 0.00 t+1 10.42 10.53 0.01 0.03 t+2 0.48 11.02 0.02 0.06 t+3 -1.26 9.78 0.06 0.20 t+30 0.53 -7.21 0.46 0.36 AR : Average Return
CAR : Cumulative Average Return WSR : Wilcoxon Signed Ranks t prob : t probability
Abnormal returns for t, t+1 and t+2 are statistically different from zero and positive. The total cumulative abnormal returns is 11.02% on the initial two trading days. However, cumulative abnormal returns for whole30-day event window are statistically insignificant and negative. (Graph 1 and 2)
When IPOs in year 2000 are classified considering up or down trends of the market, four turns were visually observed in the stock market. Since all IPOs are made in the last few days of trend1, trend1 is considered as an extension of trend2. Overall, three turns are used for classifying IPOs. (Graph 3)
Trend 2 starts in mid February and ends early May. There are 13 IPOs in this upward trend and abnormal returns in day t are positive and significant. (Appendix 2)
0,00 5,00 10,00 15,00 20,00 25,00 t t+2 t+4 t+6 t+8 t+10 t+12 t+14 t+16 t+18 t+20 t+22 t+24 t+26 t+28 t+30 day re tu rn (% ) actual returns market adjusted returns
Graph 1: Actual vs Calculated Returns
-10,00 -5,00 0,00 5,00 10,00 15,00 t t+2 t+4 t+6 t+8 t+10t+12t+14t+16t+18t+20 t+22 t+24 t+26 t+28 t+30 day re tu rn (% ) abnormal returns
Graph 2: Abnormal Returns
Trend 3 starts in early May and ends mid September. There are 16 IPOs conducted in this downturn trend. However, abnormal returns in in none of the event windows are significant.
Trend 4 starts in mid September and continue through November. The rest part of the year is not included in the study since there was no IPO. There are only 5 IPOs conducted in this upward trend. None of the abnormal returns in this period is significant.
Next, all IPOs are reclassified based upon type of going public; increasing paid-in capital by issuing new shares or selling existing shares of major shareholders, or mixture of both. The reclassification results 22 IPOs for capital increase type, only 4 IPOs for sales of existing shares of major shareholders type, and 8 IPOs in mixture of both. Empirical findings show that the market positively responds to increase in capital by providing significant abnormal returns in day t through day t+3. Nevertheless, for the later types of IPOs the market provides positive and significant abnormal returns only at day t.
The empirical results are summarized in Table 2 to develop an investment strategy. Table 2: Investment Strategies for IPOs
SOE NSI MIX
Market
Trend Day % Str % Str % Str
0 - Buy - Buy - Buy
t 6.35 Sell 8.31 Hold 8.98 Sell
t+1 13.42 Hold t+2 14.41 Sell t+3 12.58 B ul lis h t+30 14.85
0 - Buy - Buy - Buy
t 5.83 Sell 6.24 Hold 6.20 Sell
t+1 15.45 Hold t+2 16.89 Hold t+3 16.95 Sell B ea ri sh t+30 Str : Investment Strategy NSI : New Shares Issues SOE : Sales of Existing Shares MIX : Mixture of NSI and SOE.
% : Abnormal Return in Percentage
Investors should invest in capital increase IPOs and liquidate shares at day t+2 if the market is bullish, or liquidate at day t+3 if the market is bearish. This strategy provides a cumulative 14.41% abnormal return in bullish, 16.95% on bearish markets over 3-day period. Investors should also invest in public sale of existing shares or in mixture of two and sell the shares in the same trading day.
This strategy provides a 6.35% abnormal return on the average for public sales of existing shares while 8.98% abnormal return on the average for mixture of public sales of existing shares in bullish markets. The abnormal returns for public sales of existing sales and mix type in bearish markets are lower relative to bullish markets, 5.83% and 6.20% respectively.
7. Conclusions
Empirical findings considering trends in the market and type of going public are also evaluated for developing an investment strategy. If the market trend is upward, investors should invest in IPOs not considering the type of going public. If the reason of going public is to acquire additional capital, investor should hold his/her investments three days and then liquidate. For all other types of going public, investor should liquidate his/her position in the same day. If the market trend is downward, investor may invest in all type of IPOs. Investor should hold his/her position four days for only capital increase IPOs. For all others, investor should liquidate his/her position in the same trading day.
Overall, the empirical results may be applied to develop investment strategies. Three criteria for investment making could be suggested for investors. First, investors should compute IPO price of shares by utilizing various stock valuation models. Then, investors should expect that IPOs are to be underpriced. Next, investors should consider type of going public. Empirical findings support that the capital increase IPOs provide the highest abnormal returns. Lastly, the market trends should be paid attention. Capital increase IPOs in market downturns provides the highest abnormal returns for investors.
References
AGGARWAL, R. & CONROY, P., (2000) Price discovery in ınitial public offerings and the role of the lead underwriter, The Journal of Finance, vol. LV, no. 6, pp. 2903-2921.
AGGARWAL, R., (2000) Stabilization activities by underwriters after ınitial public offerings, The Journal of Finance, vol. LV, no. 6, pp.1075-1102.
AGRAWAL, J., KAMAKURA, W.A., (1995). The Economic worth of celebrity endorsers : an event study analysis. Journal of Marketing, 59, pp. 56-62.
ASQUITH, D., JONES, D. J., KIESCHNICK, R., (1998). Evidence on price stabilization and underpricing in early IPO returns, The Journal of Finance, vol. LIII, no. 5, pp. 1759-1773.
AYDO AN, K., GÜNEY, A., (1997) Hisse senedi fiyatlarının tahmininde F/K oranı ve temettü verimi, MKB Dergisi, cilt 1, no:1, 83-96. ss.
BARON, D. P. (1982) A Model of the demand for Investment Bank advising and distribution services for new issues. Journal of Finance, 45, pp. 1045-1067. BRAV, A., GOMPERS, P.A., (1997) Myth or reality? the long-run
underperformance of initial public offerings : evidence from venture and non-venture backed capital companies, The Journal of Finance, vol. LII, no. 5, pp. 2903-2921.
CASARES, L., (1996) Is institutional investment in initial public offerings related to the long-run performance of these firms? Abstracts of Papers Presented at the 1996 AFA Meetings, The Journal of Finance, pp. 1039-40.
CHEN, H.C., RITTER, J.R., (2000) The Seven percent solution, The Journal of Finance, vol. LV, no. 3, pp. 1105-1130.
ELLIS K., MICHAELY R., O’HARA M., (2000) When the underwriter is the market maker : an examination of trading in the IPO aftermarket, The Journal of Finance, vol. IV, no. 3, pp.1039-1073.
FAYMAN, J. T, GREENBERG, J., (2000) Price is right, Best's Review, Oldwick, vol. 100, issue 10, pp. 99-102.
JAIN, B.A., KINI, O., (2000). The Post-issue operating performance of IPO firms, The Journal of Finance, vol. XLIX, no. 5, pp. 1699-1721.
KIYMAZ, H., (1997) MKB’de halka arzedilen mali sektör hisse senetlerinin uzun dönem performanslarını etkileyen faktörler. MKB Dergisi, cilt 1, no:2, 69-89. ss. KRIGMAN, L., SHAW, W.H., WOMACK, K.L., (1999) The Persistence of IPO mispricing and the predictive power of flipping, The Journal of Finance, vol. LIV, no.3, June, pp. 1015-1045.
LEE, P.J., TAYLOR, S.L., WALTER, T.S., (1999) IPO underpricing explanations: implications from investor application and allocation schedules, Journal of Financial and Quantitative Analysis, Seattle, vol. 34, issue, 4, pp.425-444. McCARTHY, E., (1999), Pricing IPOs : science or science fiction?, Journal of
Accountancy New York, vol. 58, issue, 3, Sept., p.51.
McWILLIAMS, A., SIEGEL, D., (1997) Event studies in management research : theoretical and empirical issues. Academy of Management Journal, vol. 40, issue 3, pp. 626-657.
McWILLIAMS, A., SIEGEL, D., TEOH, S.H., (1999). Issues in the use of event study methodology : a critical analysis of corporate social responsibility studies, Organizational Search Methods, vol. 2, no. 4, pp.340-365.
PAGANO, M., PANETTA, F., ZINGALES, L., (1999). Why do companies go public? an empirical analysis, Journal of Finance, vol. LIII, no. 1, pp.27-62. ROCK, K., (1986) Why new issues are underpriced, Journal of Financial
Economics, 15, pp.187-212
TEOH, H.S., WELCH, I., WONG, T.J., (1998). Earnings management and the long-run market performance of initial public offerings, The Journal of Finance, vol. LIII, no. 6, pp.1935-1973.
TIM, L., RITTER, J.R., (2000). The New issues puzzle, The Journal of Finance, vol. L, no. 1, pp.23-49.
--- 0 --- APPENDIX A
T-Bill Auction Maturity Interest Rate January 2000 91-day 8.52 % February 2000 91-day 9.59 % March 2000 336-day 32.82 % April 2000 91-day 8.32 % May 2000 91-day 8.76 % July 2000 91-day 7.18 % August 2000 91-day 7.06 % August 2000 329-day 29.76 % October 2000 91-day 8.94 % November 2000 91-day 8.80 %
Maturities older than 91 days are converted to 91-day returns using the formula
r
x91
)
1
(
+
,r being interest rate and x being maturity.
APPENDIX B
IPO Firm Similar Firm IPO Date Beta Type of IPO
1 Yazıcılar Otomotiv Koç Holding February 17 0.79 SOE
2 Karsan Otomotiv Otokar February 21 0.49 MIX
3 Nuh Çimento Adana Çimento C February 24 0.63 NSI
4 eker Piliç Banvit February 24 0.35 NSI
5 Anadolu Hayat Anadolu Sigorta February 28 0.68 SOE 6 Türk Ekonomi Bankası Garanti Bankası March 02 1.02 MIX
7 Lio Ya Pınar Süt March 02 0.41 MIX
8 Alkim Alkali Kimya Eczacıba ı laç March 28 0.46 NSI 9 Genel Finansal Kiralama Toprak Leasing March 28 0.45 NSI 10 Do an Burda Rizzoli Hürriyet Gazetecilik March 28 1.07 SOE
11 EGS Holding Koç Holding March 30 0.86 NSI
12 Ersu Pınar Süt March 30 0.46 NSI
13 Soda Sanayi Eczacıba ı laç April 20 0.57 MIX
14 Logo Yazılım Aselsan May 08 0.91 NSI
15 Sezginler Gıda ntema May 11 0.68 NSI
16 Zorlu Enerji Aksu Enerji May 25 0.88 NSI
17 Altınya Kombinaları Pınar Süt May 25 0.64 NSI 18 Sınai Yatırım Bankası Garanti Bankası June 01 0.96 NSI 19 Denta Ambalaj Viking Ka ıt June 08 0.62 NSI 20 Acıbadem Sa lık Hizmetleri Marmaris Altınyunus June 15 0.66 NSI 21 pek Matbaacılık Duran Ofset June 28 0.30 NSI
22 Ak Enerji Aksu Enerji July 07 0.97 NSI
23 Ayen Enerji Aksu Enerji July 05 1.08 MIX
24 Vakıf Risk Sermayesi Yatırım Ortaklı ı Borusan Yatırım July 05 0.87 NSI
25 Turkcell Aselsan July 11 0.97 SOE
26 Escort Computer Aselsan July 20 0.96 NSI
27 MenderesTekstil Kordsa July 27 0.88 NSI
28 Tek-Art Turizm Marmaris Martı July 10 0.64 MIX 29 Favori Dinlenme Yerleri Marmaris Martı August 31 0.60 NSI
30 Sanko Pazarlama Kordsa October 05 0.92 MIX
31 Link Bilgisayar Aselsan October 26 0.90 NSI 32 EGS Finansal Kiralama Toprak Leasing October 26 0.21 NSI 33 Arena Bilgisayar Aselsan November 02 0.92 MIX 34 Alkim Ka ıt Viking Kâ ıt November 02 0.38 NSI NSI: New Shares Issues
SOE: Sales of Existing Shares MIX: Mixture of NSI and SOE.
APPENDIX C CARit IPO Firm t t+1 t+2 t+3 t+30 1 Yazıcılar 3.72 -12.51 -12.37 -14.31 -76.60 2 Karsan 18.32 17.08 24.92 20.35 26.69 3 Nuh Çimento -0.17 7.83 4.50 5.69 -18.15 4 eker Piliç -1.08 4.09 1.54 -2.52 -38.13
5 Anadolu Hayat Sigorta 12.19 16.01 11.51 6.91 -36.57 6 Türk Ekonomi Bankası 4.78 -4.24 -12.56 -17.45 -89.53
7 Lio Ya -1.01 -14.03 -17.31 -18.33 -46.32
8 Alkim Alkali Kimya 18.60 8.45 12.73 9.44 20.72
9 Genel Finansal Kiralama 20.59 31.53 32.80 22.68 59.70 10 Do an Burda Rizzoli 3.13 -4.45 -7.83 -12.26 -26.50
11 EGS Holding 16.99 10.91 11.35 7.03 -20.95
12 Ersu -5.05 17.74 23.57 33.15 85.90
13 Soda Sanayi 21.03 26.66 28.66 28.50 -22.84
14 Logo Yazılım ve Ticaret 20.95 67.38 61.16 59.70 46.12
15 Sezginler Gıda 20.69 7.01 8.98 2.98 -40.54
16 Zorlu Enerji 22.08 64.26 64.28 55.82 36.34
17 Altınya Kombinaları 0.46 -1.41 -6.83 -12.48 -65.83 18 Sınai Yatırım Bankası 5.48 -0.04 0.58 -1.95 -70.94
19 Denta -4.93 -8.56 -10.74 -19.20 -26.29
20 Acıbadem Sa lık -15.41 -21.70 -21.06 -19.41 13.46
21 pek Matbaacılık 2.92 7.21 9.92 15.28 111.17
22 Ak Enerji -6.03 -0.98 -3.98 -8.69 -11.13
23 Ayen Enerji 8.38 5.54 0.64 0.68 -5.31
24 Vakıf Risk Sermayesi Yatırım Ortaklı ı 23.23 71.08 88.74 98.76 118.58
25 Turkcell 5.83 0.61 -2.65 -1.32 -14.29
26 Escort Computer 1.14 -0.89 -2.97 -5.09 11.02
27 Menderes Tekstil -6.61 5.94 12.35 19.86 54.82
28 Tek-Art Turizm 1.82 -5.16 -3.24 -3.20 41.90
29 Favori Dinlenme Yerleri 7.40 49.89 66.68 85.17 39.49
30 Sanko Pazarlama 1.77 0.44 6.89 4.16 11.76
31 Link Bilgisayar 23.88 21.05 21.39 23.38 -59.80
32 EGS Finansal Kiralama 0.01 -10.56 -15.93 -15.93 -102.67
33 Arena Bilgisayar 8.41 4.28 1.50 -7.83 -69.24
34 Alkim Ka ıt 4.56 -2.49 -2.41 -6.93 -81.15
Average 0.07 10.53 11.02 9.78 -7.21
APPENDIX D
Type of IPO Market Trend
SOE NSI MIX Trend 1-2 Trend 3 Trend 4
Sample Size 4 22 8 13 16 5 t 6.22 6.80 7.98 8.62 5.46 7.73 t+1 -0.08 14.90 12.96 8.08 15.01 2.54 t+2 -2.83 16.21 16.27 7.81 16.37 2.29 t+3 -5.24 15.76 16.69 5.30 16.68 -0.63 Mean Return t+30 -38.49 2.81 46.58 -14.05 14.91 -60.22 t 4.15 11.93 7.98 9.55 11.43 9.57 t+1 12.01 25.96 12.96 14.08 29.83 11.69 t+2 10.35 29.31 16.27 16.83 33.55 13.61 t+3 9.91 32.74 16.69 17.55 37.32 15.21 Standard Deviation t+30 26.99 61.99 46.58 50.28 54.77 43.31 t 2.07 2.54 2.82 2.65 2.86 4.28 t+1 6.01 5.53 4.58 3.90 7.46 5.23 t+2 5.18 6.25 5.75 4.67 8.39 6.09 t+3 4.95 6.98 5.90 4.87 9.33 6.80 G en er al S ta tis tic s Standard Error Mean t+30 13.50 13.22 16.47 13.94 13.69 19.37 t 0.058 0.014 0.026 0.014 0.075 0.145 t+1 0.990 0.014 0.432 0.062 0.062 0.652 t+2 0.622 0.017 0.542 0.123 0.070 0.726 t+3 0.367 0.035 0.888 0.304 0.094 0.931 t probability t+30 0.065 0.834 0.284 0.333 0.293 0.036 t 0.068 0.031 0.017 0.079 0.079 0.043 t+1 1.000 0.024 0.401 0.179 0.179 0.686 t+2 0.465 0.026 0.575 0.278 0.278 0.686 t+3 0.273 0.067 0.889 0.408 0.408 0.686 T es t S ta tis tic s Wilcoxon SRT t+30 0.068 0.961 0.327 0.379 0.379 0.080 NSI: New Shares Issues
SOE: Sales of Existing Shares MIX: Mixture of NSI and SOE.