Research Article
Design and Validation of Multichannel Wireless Wearable SEMG
System for Real-Time Training Performance Monitoring
Serkan ¨
Or¨uc¨u
1and Murat Selek
21Ermenek Vocational School, Karamano˘glu Mehmetbey University, Karaman 70400, Turkey 2Vocational School of Technical Sciences, Konya Technical University, Konya 42130, Turkey
Correspondence should be addressed to Serkan ¨Or¨uc¨u; [email protected]
Received 8 April 2019; Revised 20 July 2019; Accepted 16 August 2019; Published 9 September 2019 Guest Editor: Federica Verdini
Copyright © 2019 Serkan ¨Or¨uc¨u and Murat Selek. This is an open access article distributed under the Creative Commons Attribution License, which permits unrestricted use, distribution, and reproduction in any medium, provided the original work is properly cited.
Monitoring of training performance and physical activity has become indispensable these days for athletes. Wireless technologies have started to be widely used in the monitoring of muscle activation, in the sport performance of athletes, and in the examination of training efficiency. The monitorability of performance simultaneously in the process of training is especially a necessity for athletes at the beginner level to carry out healthy training in sports like weightlifting and bodybuilding. For this purpose, a new system consisting of 4 channel wireless wearable SEMG circuit and analysis software has been proposed to detect dynamic muscle contractions and to be used in real-time training performance monitoring and analysis. The analysis software, the Haar wavelet filter with threshold cutting, can provide performance analysis by using the methods of moving RMS and %MVC. The validity of the data obtained from the system was investigated and compared with a biomedical system. In this comparison, 90.95% ± 3.35 for left biceps brachii (BB) and 90.75% ± 3.75 for right BB were obtained. The output of the power and %MVC analysis of the system was tested during the training of the participants at the gym, and the training efficiency was measured as 96.87% ± 2.74.
1. Introduction
In recent years, the monitoring of athlete performance has become indispensable for the health of athletes. Wireless technologies have started to be widely used in order to obtain data for the purpose of examining training efficiency in the monitoring of muscle activation and sport performance of athletes [1, 2]. It is possible to collect information about athlete performance and rehabilitation, about preventing muscle fatigue or injuries through posttraining analysis of SEMG signal obtained during the training [3–5]. Recording of SEMG signals in related muscles during training can be extremely useful in increasing performance and preventing disabilities [6].
Traits of SEMG signals obtained during training (fre-quency, severity, etc.) change depending on the muscle group measured and the severity of contraction [7–9]. In these measurements, surface-type electrodes are used to determine and examine the activity of muscles during
contraction and relaxation of muscles. When academic studies related to this subject are analysed, there are some wearable biometric systems developed for the purpose of the monitoring of performance during training. Some of these systems are intended for recording parameters like heart rate, respiration, location, and velocity or for esti-mating the levels of muscle fatigue [10–13]. Some of them have been produced for the measurement of the SEMG signals in laboratorial environment [14]. Another pro-portion of them has been designed for the purpose of perceiving dynamic muscle contraction during isolated training through the SEMG [15]. The last proportion has carried out low-cost experimental SEMG systems and matched the key features of the system with the existing systems [16–18].
The most reliable method used in the adequacy and examination of muscle activation in physiological studies is the amplitude analysis carried out on SEMG signals, known as MVC (maximum voluntary contraction) normalization
Volume 2019, Article ID 4580645, 15 pages https://doi.org/10.1155/2019/4580645
[19]. Data with MVC normalization enable understanding of what capacity the muscle works, how effective level muscles have reached through training and how much effort a training requires from an athlete [20].
The simultaneous monitorability of athlete performance during the process of training is a must for athletes at the beginner level to being able to carry out healthy training in sports like weightlifting and bodybuilding [21, 22]. This feature enables performance evaluation to be carried out momentarily during the time when there is no trainer or until the motor skills of the athlete concerning movement develop enough. A SEMG system, to be used during the training for this purpose [7, 23–25] has to
(i) Be able to provide the required SEMG data necessary for monitoring training efficiency in performance analysis
(ii) Be able to filter the noise of movement during isotonic exercises and noise and distortions in SEMG signals appearing as a result of other factors (iii) Its procedures like calibration, etc., have to continue
for a short time
(iv) The data obtained have to be at a close accuracy to biomedical systems
(v) Has to be simultaneously usable in a training environment
For use in the industrial field, various systems are available for SEMG data collection and processing. To investigate these, WB-EMG [26], BiometricsDatalog [27], Myo Armband [28], DelsysTrignio [29], BITalino [30], Mbody3 [31], Mpower [32], MyoTrac [33], MyoWare [34], Shimmer [35], and hospital [36] are such systems. The systems specified in [26], [27], and [29] and the systems which we measure in hospital [36] are not wearable during training. The system specified in [44] is wearable and supports wireless transmission but its production is stopped. In terms of the electrodes used, and CMRR, there is no difference in all of these products and they comply with the SENIAM criteria. The systems [26], [27], and [30] do not have noise and data processing filters, and the systems in [28] and [29] use a Notch filter and a band-stop filter with narrow-bandwidth in hardware. The system in [26, 34] is designed for single-channel use but does not support multichannel monitoring. The systems in [31–34] are wearable and do not include contraction detection and simultaneous MVC analysis although they can monitor multiple muscle groups. A summary of these comparisons is presented in Table 1.
When the table is analysed, it is seen that all of these systems can simultaneously observe biopotential changes in muscle or muscle groups monitored during training, but none of them include real-time MVC normalization and con-traction detection procedures for performance analysis during training.
That these features can be monitored simultaneously during the training process may be useful especially for beginner athletes to perform a healthy training in sports
like weightlifting and bodybuilding, for the performance evaluation of the athlete until the motor skills of the movement are improved and at necessary moments in preventing the injury process by intervening in training.
Based on these elements, a new wireless wearable SEMG data collection system has been introduced which enables performance monitoring and analysis at training time with its real-time MVC normalization and contraction detection processes. The SEMG circuit used in our system is designed by us to be used in future studies and to be developed according to our needs.
In the presented system, digital filtering is also used in addition to hardware filtering in SEMG circuit. These nu-merical filters are Haar wavelet filters with Threshold cutting based on (TCHW) and linear Kalman [37, 38]. Each nu-merical filtering method is tested together with hardware filtering. Results obtained from here will be determinative in deciding the filtering structure that can be used in future stages of the system design. Subsequently, filtered data are processed through moving RMS method containing the methods of moving average (MA) and root mean square (RMS), scaled through MVC normalization, and a training support system that can carry out real-time performance analysis and monitoring.
2. Materials and Methods
2.1. Isotonic Contraction. Isotonic contraction encompasses
exercises where muscle tendons get shortened to generate movement. Any kind of movement, ranging from weight-lifting to rowing and running, is in this category [39]. In sport, an isotonic exercise is a training where the most amount of strength is exerted on a particular muscle or muscle group to increase that muscle mass or performance in general. Due to the fact that human activity and athletic performance necessitate these kinds of movement, isotonic exercises form the basis of a lot of training protocols [40]. It is possible to observe pathological changes or efficiency obtained from the training through an examination of SEMG signals generated in muscles during these exercises [41].
2.2. SEMG Circuit Design. The SEMG circuit design details
are given below. The circuit consisting of 4 channels could monitor the biopotential change of 4 different muscle groups at the same time. So, it is possible to monitor biopotential changes occurring in muscles in symmetrical movements that affect multiple muscle groups (e.g., the Bench Press movement affects pectoralis major and triceps muscles). The circuit has in each channel, respectively, one in-strumentation amplifier, a inverting amplifier, a low-pass filter, a high-pass filter, and a full-wave rectifier. The circuit has a diode for input protection, a pointer indicating that the circuit is working, and a start-up button. During working, the LD1117 regulator was used for the Bluetooth feed and the 7805 regulator for the +5 volt and − 5 volt op-amp feed (Figure 1(a)). The SEMG signals we want to process are
MUAP signals whose amplitude is between 0 and 1.5 mVolt (RMS). To process this electrical signal, it must firstly be amplified. In the system, this amplification is done by in-creasing the difference between the two electrodes in bipolar mode. While the obtained common signal is amplified in this mode, the background noise is also suppressed. Two of the probes activated from each channel are connected to the circuit’s soil, like the reference probe [42] which is placed in a more electrically remote area (preferably a neutral or close to the bone region) while going to the amplifier and filter circuits over INA 128P, which operates in a single differ-ential mode. In the first step, amplification was performed by using the INA 128P differential amplifier (Figure 1(b)).
As stated in [43], the reason why we use INA 128P is that the amplitude of the SEMG signal is low and that the amplifier to be used due to other factors like noise must have a high input impedance and a high common mode rejection rate (CMRR > 95 dB). This amplifier has the required fea-tures with CMRR >120 dB and 10 GΩ input impedance. When we set the gain value for the 60 Hz input signal to
G � 74.52 using INA 128P in our system, approximately
108 dB CMRR was obtained as stated in the technical document in [44]. The reason for selecting a 60 Hz input signal in the system design is that the SEMG signal is dominant in the range of 50 Hz to 150 Hz. To obtain a processable signal amplitude in the second stage, TL072 was used as shown in Figure 1(c) as an active inverting amplifier. At this stage was the amplifier gain approximately G � 59 and the CMRR approximately 100 dB by using the 60 Hz input signal as stated in [45].
In SEMG applications, analogue (hardware) and digital (software) filters are used to remove unwanted component noises and process the necessary parts in the SEMG signal [46]. Analogue filters remove anything above or below a selected cut frequency, while digital filters make this process more precise as they can be programmed [47]. This certainty is due to the fact that the features of digital filters can be
changed depending on the input signal parameters [48]. In these applications, analogue filters are used to eliminate noise from the signal in signal amplification and processing circuits, to provide noise immunity, and to obtain the necessary parts of the frequency band [49]. On the contrary, digital filters are used to filter signal residues named artifact after motion and to analyse SEMG signal (feature extraction, time-frequency analysis, contraction detection, performance analysis, etc.) [41, 50].
In the circuit, analogue filtering is performed by low- and high-pass filters. Ideal SEMG signals are observed between 50 Hz and 500 Hz and should be filtered from frequency components outside this range [51]. For this, the signal from the output of the instrumentation amplifier is first filtered so that the gain is 1 in the high-pass filter (HPF) using TL072 with a cutoff frequency of about 48 Hz (Figure 1(d)). The components of the EMG signal above 500 Hz are filtered through a 2nd order Sallen–Key low-pass filter (LPF) using TL072. Through this section, resistance and capacitor values are designed so that the cutoff frequency is approximately 482 Hz, the quality factor is 0.5, and the gain is 1 (Figure 1(e)). The reason we prefer the Sallen–Key topology we use in the circuit is that this filter has the ability to produce a quadratic low-pass reaction with better selectivity (higher pole) and various possible approaches (Butterworth, Chebyshev, Thomson-Bessel, etc.) [43, 47, 49]. This will help us in our future work.
Then, the whole SEMG signal was moved to the positive level using the full-wave rectifier (Figure 1(f )). With this process, it is possible to analyse the low-frequency oscilla-tions by overcoming the high-pass nature of the SEMG signal [52]. Thus, it is aimed to use the circuit except for the training efficiency, also in the fields of prosthesis control and ergonomics.
The Pic16F1786 microcontroller with connected full-wave rectifier outputs contains 11 12 bit A/D (Analogue/Digital) converters. The data obtained from the rectifier of each channel
Table 1: Comparison of the SEMG acquisition systems.
System Signal type Number of channels Gain ADC resolution (bits)
Wearable Filter type Contraction
detection Real-time MVC norm. CMRR Connection type Proposed
system SEMG 4 4400 12 Yes Hardware + software Yes Yes >90 Bluetooth
WB-EMG SEMG 1 100–10000 12 No No No No >90 Bluetooth
Biometrics
datalog SEMG 8 1000 14 No No No No >90 Bluetooth
Myo
armband SEMG 8 ≥1000 8 Yes Notch No No >90 Bluetooth
Delsys
Trignio SEMG 16 909 16 No Notch No No >90 RF
BITalino SEMG Up to 6 1000 6–10 Yes No No No >90 Bluetooth
Mbody3 SEMG Up to 6 ≥1000 24 Yes Hardware + software No No >90 Bluetooth
Mpower SEMG 4 ≥1000 — Yes Hardware + software No No >90 Bluetooth
MyoTrac SEMG 2 ≥1000 14 Yes Butterworth No No >90 Bluetooth
MyoWare SEMG 1 ≥1000 — Yes No No No >90 Bluetooth
Shimmer SEMG Up to 60 ≥1000 16 Yes Hardware + software No No >90 Bluetooth
in the circuit are connected, respectively, to the RA0-RA3 inputs of this controller. This microcontroller performs the A/D conversion in 20 ms time intervals through the pro-gram we write. The converted channel data are turned into a string, and this sends data from the RC0 output to the Bluetooth module (Figure 1(g)). The transmitted data have a resolution of 2.4 μV in each step. Data sent at 4800 bps speed via the HC-06 Bluetooth module (Figure 1(h)) are
received and processed by the data collection program written in the C# language. The digitalized SEMG data in the data collection program are processed through digital filters. The PCB (printed circuit board) of the circuit is designed to be 10 cm × 10 cm in size, and as stated in [53], the PCB tracks are intended to be exposed to as little noise as possible. The mounted state of the circuit shown in Figure 1(i) is boxed and placed inside a wearable belt. The necessary
R8 R10 R11 R9 R12 U5:B U6:A LPFOUT 10k 10k 10k 10k 10k 6 5 7 3 8 4 2 1 8 4 –5V +5V +5V –5V TL072 TL072 D2 D3 1N4148 1N4148 RectOut + – + – R3 R2 U4:A AMPOUT INAOUT –5V +5V TL072 + – 5.6k 330k 3 1 8 4 2 R5 R4 C5 U4:B AMPOUT hpfOut –5V +5V TL072 + – 8 4 100nf 33k 33k 5 6 7 R7 R6 C6 C7 U5:A LPFOUT HPFOUT –5V +5V TL072 + – 1 8 4 3 2 330k 330k 1nF 1nF –5V +5V + – StereoJack C8 C9 U3 J1 2 2 1 1 3 7 4 6 5 8 100uF 100uF R1 680 RG1 RG2 inaOut REF INA122 (a) (c) (f) (h) (g) (d) (e) (b) C11 C10 C4 C3 C1 C2 100uF 100uF 220uF J2 D1 2 1 POWER 220uF 220uF 220uF –5V +5V U1 U2 U7 VI VO GND V1 VO GND GND IN OUT +3.3V 1 3 1 1 3 3 2 2 2 LD1117V33 7805 7805 1N4007 HC06 Vcc GND GND Tx TX Rx RX +3.3V Tx Rx RECTOUT 23 4 5 6 7 10 9 21 22 23 24 1 11 12 13 14 15 16 17 18 25 26 27 28 U8 RA0 RA1 RA2 RA3 RA4 RA5 RB4 RB5 RA6 RA7 RC0 RC1 RC2 RC3 RC4 RC5 RC6 RC7 RB0 RB1 RB2 RB3 PIC16F1786 RB6/ICSPCLK RB7/ICSPDAT RE3/MCLR/VPP (i) a g h f e d c b In.
Figure 1: Block diagram and mounted state of the SEMG circuit. (a) Regulator circuit. (b) Instrumentation amplifier. (c) Inverting amplifier. (d) 1st-order HPF. (e) 2nd-order Sallen–Key LPF. (f ) Full-wave rectifier. (g) PIC 16F1786. (h) Bluetooth module. (i) Mounted state of the SEMG circuit.
energy for the operation of the circuit was obtained from 1000 mAh lithium batteries. It is intended to minimize power line interference (PLI) without the need for any insulation, as stated in [54] using battery in the system.
2.3. Participants and Setup. Five males and two females
voluntarily participated in our study and have at least 2 years of experience in strength training. The information of the participants is shown in Table 2.
The participants were informed about the content of our study, and a signed consent form was obtained from all of them. All exercises and measurements were made under the supervision of a specialized trainer. As described in the recommendations of the European initiative known as SENIAM (surface electromyography for noninvasive muscle evaluation of muscles) by selecting 10 mm diameter electrodes shown in Figure 2 for SEMG, the bipolar con-figuration is located 1–2 cm away from the centre of the muscle and the reference electrode is placed in a region that is electrically neutral according to the action [51]. The connection between the electrodes and the circuit channels is provided by using armoured cables which have 3.5 mm ends, 3 colour code (red, green, and blue) and labelled contacts (L, F, and R), as shown in Figure 2.
Our experiments consist of 3 parts. In the first part, 8 repetitions and 1 set of alternate dumbbell curl (ADBC) training was performed using a maximum load of 60–70%. In this section, firstly, it is investigated whether the ana-logue filter data obtained from the circuit in the training reflect the biopotential activity changes that occur during the training. In the sequel, the analogue filter data obtained from the circuit are processed by means of Kalman and threshold cut Haar wavelet filter (TCHW) to eliminate noise sources and to investigate the perceptibility of the isotonic contractions.
In the second part, the accuracy of the developed system was compared with the biomedical system (Viking on Nicolet EDX) used in Karaman State Hospital (See Table 1). In this comparison, the RMS values obtained from both systems were used.
In the third part, the availability of moving RMS and %MVC values as the screen output of the system was investigated in terms of performance feedback. For this purpose, first, the moving RMS values obtained by asking users to perform a second ADBC (8 repetitions 1 set) training were recorded. In addition, a %MCV mea-surement was made by asking all users in the training environment to lift 5 kg dumbbell and maximum weight (Men 17.5 kg, 20 kg, and 25 kg dumbbell; women 12.5 kg and 15 kg dumbbell) they can.
2.4. Kalman and TCHW Filters. Kalman filter is used to
estimate the system status from input and output in-formation with the previous inin-formation of a model in a dynamic system indicated by the state-space model [55, 56].
When the system is modelled, it was aimed to minimize the distortions in data by estimating the k parameter specified by
x in SEMG data array at a particular time as Xk:
Xk � Kk· Zk+(1− )Kk· Xk−1. (1)
Here, Zk expresses the measuring data wanted to be
absolutized, Kk the Kalman gain and Xk− 1 the measuring
data belonging to the previous stage. If the system is modelled through this information, a model consisting of calculation (2) and update (3) is obtained.
xk� Axk−1+ Buk+ wk−1, (2)
zk� Hxk+ vk. (3)
In (2), any xkis expressed as a linear combination of the
next control signal k of its previous value and the noise of the process. In (3), any measurement value making certain of the accuracy of which we are not sure is accepted to be a linear combination of the signal value and the noise of the measurement.
In HW, the main wavelet acts as the wavelet transform but is scaled and shifted during this procedure of wavelet transform [35]. Scaling corresponds to the widening and constriction of the signal (f(t)) and the shift to the wave shift (τ) in the timescale axis (t) in the following equation [57, 58]:
F(ω, τ) � f(t)w(t − τ)e− jωtdt. (4)
HW is a wavelet-based, scaled, “square-shaped” array of functions. ψ(t), the main function of HW (5), and also φ(t),
Table 2: Information about age, gender, weight, and height of the subjects.
Participant no. Age Gender Weight (kg) Height (cm)
1 21 Male 80 163 2 25 Male 82.3 178 3 29 Male 87 180 4 33 Male 85 177 5 37 Male 104.6 193 6 24 Female 70 180 7 27 Female 68 172
a scaling function (6), are defined in t time interval given as follows: ψ(t) � 1, 0 ≤ t ≤1 2, −1, 1 2< t ≤ 1, 0, otherwise, ⎧ ⎪ ⎪ ⎪ ⎪ ⎪ ⎪ ⎪ ⎪ ⎪ ⎨ ⎪ ⎪ ⎪ ⎪ ⎪ ⎪ ⎪ ⎪ ⎪ ⎩ (5) φ(t) � 1, 0 ≤ t ≤ 1 2, 0, otherwise, ⎧ ⎪ ⎪ ⎨ ⎪ ⎪ ⎩ (6)
The Haar function ψn,kis defined as shown in
ψn,k(t) �2
n/2
ψ 2nt − k, t∈ R. (7)
Since the SEMG signals are user-based, SEMG signals between isotonic muscle contractions may vary according to the individual. In the method we use with HW, the indi-vidual waits for approximately 2–4 seconds with the weight in his hand before starting training and in the meantime, the procedure of threshold cutting in the system can be carried out. The threshold cutting is based on the calculation of the average value (8), the standard deviation (9), and the signal slope (10): A �1 n∗ n i�1 xi, (8) σ � ������������ 1 N N i�1 xi− μ2 , (9) s �(x − x)(y − y) (x − x)2 . (10)
Here, xiis the value added to the average, μ is the average
value and N is the number of the total value. After the values of the average, standard deviation and slope are calculated and all SEMG signals complying with this condition are equalled to zero. Thus, the signals between the voluntary contractions can be eliminated.
2.5. RMS, MA, and %MVC. After the SEMG signal is
cap-tured, the commonly used RMS or MA values are analysed by using [59]. In RMS analysis, the SEMG signal is subjected to a set of mathematical operations designed to measure the power of change. Thus, the intensity and duration of events like muscle contractions can be investigated. Therefore, the RMS value is a parameter chosen during contraction and reflects the level of physiological activity in the body. Mathematically, the RMS value of a continuous-time waveform is the square root of a function defining the continuous waveform shown in f (t) in the following,
de-fined in the range T1≤ t ≤ T2:
frms� ������������������ 1 T2− T1 T2 T1 [f(t)]2dt , (11) frms�limT⟶∞ ������������ 1 T T 0 [f(t)]2dt . (12)
Another method we use as MA is the technique of analysing changes in a data set to estimate long-term trends.
For a given N time window, if the values s1, s2, s3,. . ., sn
corresponding to this time interval of the S variable shown in
the times t1, t2, t3, . . ., tnare known, the MA window size is
defined as N � 2k + 1 and processed as specified in
MA � 1
N
+k
j�− k
si− j. (13)
Thus, changes in the time window given at the j moment are obtained by averaging the time series of the k time in the j moment. Instead of using the above-mentioned RMS and MA methods separately, the moving RMS method was used in our system by calculating the RMS value in a moving window, which is a combination of these methods. In this method, the operation can be performed at any t time interval of the moving window; therefore, it acts as a filter in a certain time interval, as shown in (14). In this way, the processing of the data obtained according to the variable speed of the replays in the training sets gets easier. In this equation, n refers to the length of the window, while x(k) refers to the data within the window: xRMS[i] � 1 n0 i j�(i− N+1) x2[k] ⎛ ⎝ ⎞⎠ 1/2 . (14)
So, it can be measured how much power is obtained from the muscle through the moving RMS value.
The MVC (maximum voluntary contraction-maximum amplitude of the signal) normalization is widely used in SEMG signals as an amplitude analysis technique. The re-sults are shown as a percentage (%MVC) of the MVC value that can be used to create a common background when comparing data between subjects [60, 61]. SEMG signals depend on the user and have a structure that can cause records to change even when measured from the same position with the same motion. Therefore, MVC normali-zation is used to eliminate this difference and to enable data comparison between subjects [61]. MVC expresses the highest value obtained in a repeat during this measurement to normalize SEMG signals obtained for a specific purpose, while SMVC (submaximal voluntary contraction) refers to the voluntarily recorded SEMG data. %MVC corresponds to the multiplication of the normalized value of according to SMVC’s MVC with 100 [62, 63]:
%MVC � SMVC
MVC
Thus, it can be scaled how much power is obtained from the muscle or muscle groups investigated in repetitions in each set of training.
2.6. Proposed System. Our system has the ability to follow
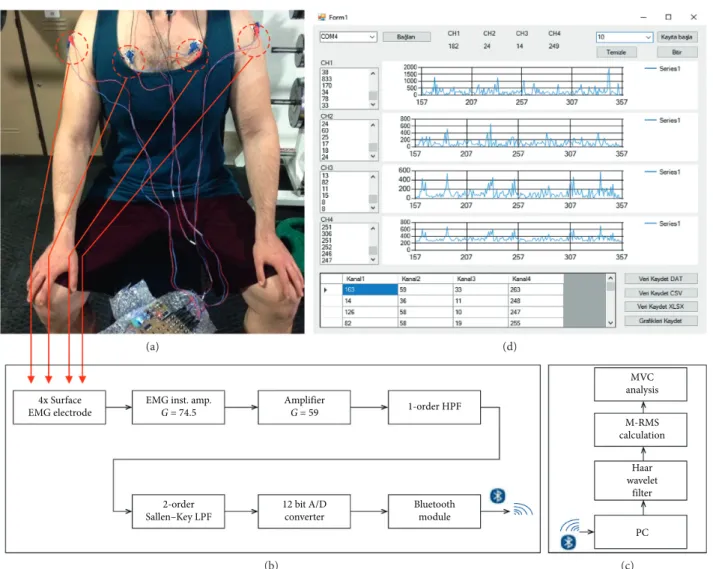
the biopotential changes of four different superficial muscle groups at the same time. The reason why the system is designed with 4 channels is that most movements used in bodybuilding and weight training activate at least 1 or 3 muscle groups at the same time. The system takes the biopotential signals of the muscles that are activated during training through surface electrodes (Figure 3(a)), and then, first it amplifies them in the instrumentation and amplifier
parts in the SEMG circuit, after it filters them with the 1st
-degree high pass and 2nd-degree Sallen–Key low-pass
fil-ters. These analogue-filtered signals are sent to the com-puter via Bluetooth after a 12 bit analogue-to-digital conversion (Figure 3(b)). By the software we developed in C# language, all SEMG channel data received by the computer are digitally filtered and then they calculated the moving RMS values in time windows that vary according to
the training speed (Figure 3(c)). After this process, the SMVC value of each repetition in each set of the training is processed according to the previously saved MVC values. Then, %MVC values are displayed on the screen in separate graphs according to the channels from which the data are taken. Finally, they are saved to the database in “.csv,” “.dat,” and “.xlsx” formats (Figure 3(d)).
3. Results and Discussion
3.1. Analogue + Digital Filtered Data from the System. The
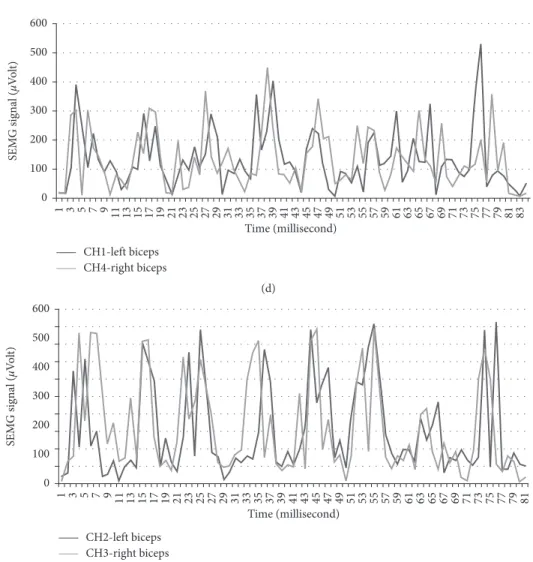
analogue-filtered data of the first 4 repetitions of ADBC training performed by participant number two is shown in Figure 4(a), marked as 4(a) and 4(b) for each repetition.
The left BB (LBB-Left Biceps Brachii) data are obtained from CH1 (first channel of the SEMG circuit), and the right BB (RBB-Right Biceps Brachii) data are obtained from CH2 (the second channel of the SEMG circuit). From the data obtained, some decrease in Rep2b, Rep3a, Rep3b, and Rep4a (between 100 and 200 μV) and a data change during pushing the weight down (relaxation period of the muscle) in Rep 4b were observed. As we consulted with the professor of
(a) (d)
(b) (c)
4x Surface EMG electrode
EMG inst. amp.
G = 74.5 Amplifier G = 59 1-order HPF MVC analysis M-RMS calculation PC Haar wavelet filter 2-order Sallen–Key LPF 12 bit A/D converter Bluetooth module
Figure 3: Overview of the system. (a) Connecting electrodes before training (Photoshoot by Orucu). (b) Block diagram of the SEMG circuit. (c) Block diagram of the analysis software. (d) User interface of the analysis software.
Physical Education and Sports Teaching (Karamano˘glu Mehmetbey University), he stated that the fall was caused by the distortion of movement. According to the consultant professor, this change appeared to have been caused by the prolongation of the activation period of the muscle as a result of pushing the weight down more slowly as specified in [64, 65].
Other data of training performed by participant number four are shown in Figure 4(b). In this training, LBB data were obtained from CH3 (the third channel of the SEMG circuit) and RBB data were obtained from CH4 (the fourth channel of the SEMG circuit). When the results obtained are investigated in accordance with contraction and relaxation situations as specified in [65, 66] which consultant professor pointed, it is observed that BB muscles contract and relax normally in Rep1, Rep5, Rep7, and Rep9 and BB muscles contract fast and relax normally in Rep2. It is observed that the left BB contracts more than the right BB does and both relax normally in Rep3, that the required support is taken from other regions and movement is ruined in Rep4 and that the left BB muscle contracts more, the right BB muscle contracts normally and both relax normally in Rep6 and Rep8. It is observed that the left BB contracts normally and the right BB contracts more and
both relax normally in Rep10, in which distortion in movement appears as a result of fatigue in Rep11 and Rep12. In addition, the data of other participants obtained from these trainings are presented in Figure 5.
In Figure 6, the data, processed with TCHW and Kalman filters, of two repetitions in training, belonging to the right BB muscle, conducted by the participant numbered 4, are shown. In this Figure, 6(a) shows the analogue filtered state of the SEMG signal, and 6(b) shows the preliminary mea-surement of the threshold cut-out. The average and standard deviation measured here were found as 61.11 ± 51.61 μV, and the slope was found as 0.005⁰. The signal filtered with TCHW after this procedure is shown in 6(c), and the signal pro-cessed through Kalman filter is shown in 6(d). Filtering results indicate that the TCHW method produces better results in filtering unwanted signals and contraction de-tection compared to the method of Kalman filter. As a result of these processes, it was decided to use TCHW filter in our system.
3.2. Comparison Results with the Existing Biomedical System.
The accuracy of the data obtained from our system was compared through the data belonging to two men and two Rep1a 500 400 300 200 100 0 Rep1b Rep2a Rep2b Rep3a Rep3b Rep4a Rep4b Time (millisecond) SE M G signal ( μVo lt ) 1 48 95 142 189 236 283 330 377 424 471 518 565 612 659 706 753 800 847 894 941 988 1035 1082 1129 1176 1223 1270 1317 1364 1411 1458 1505 1552 1599 1646 1693 1740 1787 1834 1881 1928 1975 2022 2069 2116 2163 2210 2257
CH2-right biceps brachii CH1-left biceps brachii
(a) 400 300 200 100 0 450 350 250 150 50 Time (millisecond) SE M G signal ( μVo lt )
Rep1 Rep2 Rep3 Rep4 Rep5 Rep6 Rep7 Rep8 Rep9 Rep10 Rep11 Rep12
1 22 43 64 85
106 127 148 169 190 211 232 253 274 295 316 337 358 379 400 421 442 463 484 505 526 547 568 589 610 631 652 673 694 715 736 757 778 799 820 841 862 883 904 925 946 967 988 1009
CH3 CH4
(b)
Figure 4: Sample analogue filtered data obtained from the SEMG circuit during training: (a) Sample results of participant number two, (b) sample results of participant number six.
97 101 105 109 113 117 121 125 129 133 137 141 145 149 153 65 69 73 77 81 85 89 93 57 53 49 45 41 37 33 29 25 21 17 13 9 5 61 1 Time (millisecond) 0 200 400 600 800 1000 1200 1400 SE MG s ig n al (μ Vo lt ) CH1-left biceps CH3-right biceps (a) 0 200 400 600 800 1000 1200 1400 SE MG s ig n al (μ Vo lt ) 6 11 16 21 26 31 36 41 46 51 56 61 66 71 76 81 86 91 96 101 106 111 116 121 126 131 136 141 146 151 156 161 1 Time (millisecond) CH2-left biceps CH4-right biceps (b) 0 200 400 600 800 1000 1200 1400 1600 SE MG s ig n al (μ Vo lt ) 5 9 13 17 21 25 29 33 37 41 45 49 53 57 61 65 69 73 77 81 85 89 93 97 101 105 109 113 117 121 125 129 133 137 141 1 Time (millisecond) CH1-right biceps CH4-left biceps (c) Figure 5: Continued.
1200 CH3-left BB Raw data 1000 800 600 M ea n CH3-lef t BB as μV ra w 400 200 0 0 2000 4000 t as millisecond 6000 8000 (a) 250 200 150 100 50 0 0 1000 2000 3000 4000 5000 SE M G no is e as uV t as millisecond (b) Figure 6: Continued. 0 100 200 300 400 500 600 SE MG s ig n al (μ Vo lt ) 3 5 7 9 11 13 15 17 19 21 23 25 27 29 31 33 35 37 39 41 43 45 47 49 51 53 55 57 59 61 63 65 67 69 71 73 75 77 79 81 83 1 Time (millisecond) CH1-left biceps CH4-right biceps (d) 0 100 200 300 400 500 600 SE MG s ig n al (μ Vo lt ) 3 5 7 9 11 13 15 17 19 21 23 25 27 29 31 33 35 37 39 41 43 45 47 49 51 53 55 57 59 61 63 65 67 69 71 73 75 77 79 81 1 Time (millisecond) CH2-left biceps CH3-right biceps (e)
Figure 5: Data of other participants obtained from these trainings. (a) Results of participant number one. (b) Results of participant number three. (c) Results of participant number five. (d) Results of participant number six. (e) Results of participant number seven.
women with the SEMG device in Karaman State Hospital (Figure 7).
As shown in Table 3, this procedure was carried out through the data of 108 measurements in total, obtained through volunteers being unattached, lifting dumbbells of 5 kg and the maximum weight they could lift isometrically (1 RM) first in the gym, then in the hospital system for three
times with breaks of 90 seconds. In this procedure, first the data given from the hospital system were recorded and then the moving RMS was calculated on the analogue and digital filter data obtained from the system.
In the system designed as a result of this measurement, accuracies of 90.95% ± 3.35 for the left BB and 90.75% ± 3.75 for the right BB were obtained.
(a) (b)
Figure 7: (a) A measurement taken in the hospital environment and a photograph of the current biomedical system. (b) A photograph taken at the gym before training.
CH3-left BB 1200 1000 800 600 CH3-lef t BB as μV wi th t hr esho ld H aa r 400 200 0 0 2000 4000 t as millisecond 6000 8000 (c) 0 500 1,000 1,500 2,000 2,500 3,000 3,500 4,000 4,500 5,000 5,500 6,000 6,500 7,000 773 525 462 417 364 323 297 290 200 180 145 110 86 58 29 1 CH3-lef t BB as μV wi th K alma n f il ter t as millisecond (d)
Figure 6: Comparison of the filtering results. (a) SEMG data without the filter. (b) Premeasurement for threshold filter. (c) SEMG signal with threshold + HW filter. (d) SEMG signal with Kalman filter.
Table 3: Moving RMS Results in Gym and Hospital. Note that “M” denotes the measurement number; “BB” denotes biceps brachii; “S” denotes system; “H” denotes hospital, “MN” denotes muscle name.
Participants/weight (no./kg)
M MN Type 1/idle 2/idle 3/idle 4/idle 1/5 2/5 3/5 4/5 1/25 2/25 3/15 4/12.5
I Left BB HS 70.6967.13 69.7272.31 47.2451.18 43.8245.9 123.69137.42 129.54141.94 108.6697.54 101.0593.64 950.94914.7 1112.53935.98 616.53566.98 547.64604.36 Right BB S 71.4 69.75 49.66 42.45 119.11 127.41 96.86 93.95 960.71 937.69 565.69 515.43 H 69.64 70.51 50.22 43.93 135.57 143.13 107.93 97.14 943.82 1117.15 615.15 545.64 II Left BB S 69.86 68.84 52.03 43.15 121.82 128.9 95.71 93.8 907.35 934.5 563.5 518.06 H 70.39 69.61 51.76 43.75 138.87 139.69 105.78 101.55 942.14 1116.89 614.89 595.59 Right BB S 69.84 71.34 49.01 46.68 122.96 126.95 96.5 93.61 950.6 932.61 562.61 526.48 H 71.82 67.83 50.25 43.27 136.52 142.8 106.73 102.46 1002.4 1110.94 612.94 598.81 III Left BB S 69.45 70.89 50.96 46.22 124.61 128.91 97.88 89.07 907.15 934.34 564.34 511.19 H 68.57 69.97 50.24 46.71 138.81 139.69 106.74 105.67 1000.8 1115.11 614.11 583.55 Right BB S 71.64 67.65 52.01 43.55 122.97 129.74 95.38 92.52 948.63 930.36 562.36 539.49 H 68.56 69.63 49.72 44.79 135.94 145.8 107.5 104.28 1000.9 1110.61 612.61 543.35
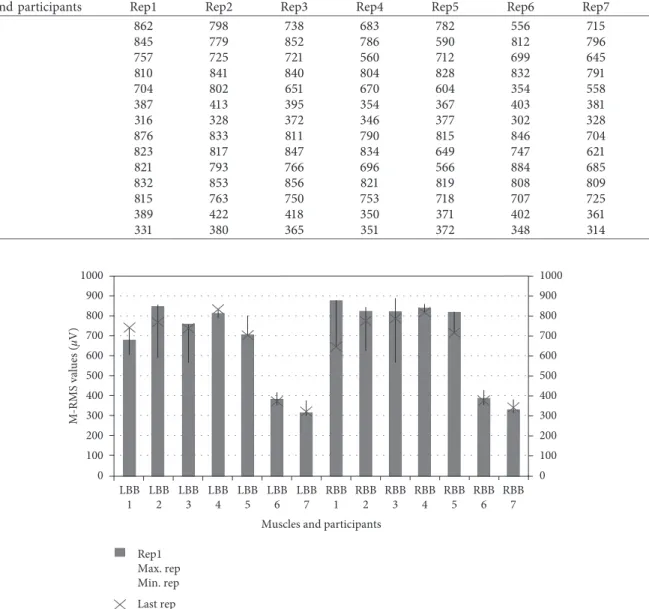
3.3. Moving RMS and %MVC Values. During the training,
the volunteers were asked to perform a second training in order to obtain the moving RMS values given back to the user as feedback. The results are presented in Figure 8 and Table 4 in terms of ease of investigation.
Thus, it can be seen that the system can achieve mini-mum and maximini-mum values of biopotential changes in muscles during training as in [66, 67].
Finally, the users were asked to lift 5 kg of dumbbell and the maximum weight they could lift. Thus, the %MVC was measured to be used in performance feedback through the obtained moving RMS values. The results obtained are presented in Table 5.
If Table 5 is analysed, it can be seen that the system can measure efficiency during training with the success rate of 96.87% ± 2.74 based on %MVC.
When data obtained from the designed SEMG system are compared with data obtained from the systems used in the biomedical field, it is seen that it has 90.85%
accuracy. As digitally filtered data are compared, it is seen that TCHW method produces better results com-pared to Kalman filter. TCHW can soften data as pro-cessable and can also completely filter out unwanted signals between muscle contractions. It also eliminates the distortions in data expressed as artifact. Kalman filter appears to soften the data but not to be able to completely filter the signal between muscle contractions. Moreover, it is seen that the system can scale the strength obtained as moving RMS during the training on the basis of % MVC with the success rate of 96.87% ± 2.74 in terms of efficiency. This allows the data obtained to be used in the simultaneous performance monitoring and analysis of athletes.
4. Conclusion
Thanks to this system, it is thought that athletes will be able to examine their performances instantly for each
Table 4: Moving RMS results in gym as training feedback.
Muscles and participants Rep1 Rep2 Rep3 Rep4 Rep5 Rep6 Rep7 Rep8
LBB 1 862 798 738 683 782 556 715 741 LBB 2 845 779 852 786 590 812 796 766 LBB 3 757 725 721 560 712 699 645 736 LBB 4 810 841 840 804 828 832 791 830 LBB 5 704 802 651 670 604 354 558 701 LBB 6 387 413 395 354 367 403 381 370 LBB 7 316 328 372 346 377 302 328 319 RBB 1 876 833 811 790 815 846 704 653 RBB 2 823 817 847 834 649 747 621 770 RBB 3 821 793 766 696 566 884 685 785 RBB 4 832 853 856 821 819 808 809 815 RBB 5 815 763 750 753 718 707 725 714 RBB 6 389 422 418 350 371 402 361 378 RBB 7 331 380 365 351 372 348 314 341 1000 900 800 700 600 500 M-RMS values ( μV) 400 300 200 100 0 1000 900 800 700 600 500 400 300 200 100 0 LBB 1 LBB 2 LBB 3 LBB 4 LBB 5 LBB 6 LBB 7
Muscles and participants RBB 1 RBB 2 RBB 3 RBB 4 RBB 5 RBB 6 RBB 7 Rep1 Max. rep Min. rep Last rep
training and make their training more efficient. It is possible to create intelligent training corners by using the system in gyms. It is thought that the system can easily be used by athletes, trainers, kinesiologists, and habilitation experts in bodybuilding trainings and re-habilitation processes. It is possible to improve system features by increasing the number of channels, further reducing the PCB size and adding extra sensor. It can be possible to follow more complicated movements (deadlift, barbell row, etc.) by increasing the number of channels. By making the size of system smaller, it can be possible to place it into textile product. In addition, by adding the pulse oximetry sensor to the system, oxygen consumption can be observed during the training. In our future studies, it is being thought of supporting the system with an image processing system in order to determine movement dis-tortions in addition to use it for monitoring training performance and efficiency.
Data Availability
The data used to support the findings of this study are in-cluded within the article.
Conflicts of Interest
The authors declare that there are no conflicts of interest regarding the publication of this paper.
Acknowledgments
The authors would like to thank Assistant Professor Dr. Yusuf Er (Karamano˘glu Mehmetbey University Physical Education and Sports Teaching-Recreation Management) for his helpful advice on various technical issues and Atilla S¨onmezıs¸ık (Antalya Sport Center) for his training support.
References
[1] R. M. Howard, R. Conway, and A. J. Harrison, “Muscle ac-tivity in sprinting: a review,” Sports Biomechanics, vol. 17, no. 1, pp. 1–17, 2018.
[2] D. R. Clark, M. I. Lambert, and A. M. Hunter, “Contemporary perspectives of core stability training for dynamic athletic performance: a survey of athletes, coaches, sports science and sports medicine practitioners,” Sports Medicine-Open, vol. 4, no. 1, pp. 32–42, 2018.
[3] J. Hussain, K. Sundaraj, Y. F. Low, L. C. Kiang, S. Sundaraj, and M. A. Ali, “A systematic review on fatigue analysis in triceps brachii using surface electromyography,” Biomedical
Signal Processing and Control, vol. 40, pp. 396–414, 2018.
[4] R. Lovell, M. Knox, M. Weston, J. C. Siegler, S. Brennan, and P. W. M. Marshall, “Hamstring injury prevention in soccer: before or after training?,” Scandinavian Journal of Medicine
and Science in Sports, vol. 28, no. 2, pp. 658–666, 2018.
[5] S. Skals, J. Vinstrup, E. Sundstrup, M. D. Jakobsen, C. H. Andersen, and L. L. Andersen, “Shoulder and arm muscle activity during elastic band exercises performed in a hospital bed,” The Physician and Sportsmedicine, vol. 46, no. 2, pp. 233–241, 2018.
[6] M. Cardinale and M. C. Varley, “Wearable training-moni-toring technology: applications, challenges, and opportuni-ties,” International Journal of Sports Physiology and
Performance, vol. 12, no. s2, pp. S2–S55, 2017.
[7] A. D. Vigotsky, I. Halperin, G. J. Lehman, G. S. Trajano, and T. M. Vieira, “Interpreting signal amplitudes in surface electromyography studies in sport and rehabilitation sci-ences,” Frontiers in Physiology, vol. 8, pp. 1–15, 2018. [8] E. Zemkov´a and D. Hamar, “Sport-specific assessment of the
effectiveness of neuromuscular training in young athletes,”
Frontiers in Physiology, vol. 9, pp. 1–27, 2018.
[9] M. Vromans and P. Faghri, “Electrical stimulation frequency and skeletal muscle characteristics: effects on force and fa-tigue,” European Journal of Translational Myology, vol. 27, no. 4, pp. 239–245, 2017.
[10] M. Kos and I. Kramberger, “A wearable device and system for movement and biometric data acquisition for sports appli-cations,” IEEE Access, vol. 5, pp. 6411–6420, 2017.
[11] O. Ozkaraca, A. Hakan Isik, and I. Guler, “Biological signals sensing with wearable technologies and an ECG athlete de-sign,” Recent Patents on Biomedical Engineeringe, vol. 4, no. 2, pp. 74–83, 2011.
[12] R. T. Li, S. R. Kling, M. J. Salata, S. A. Cupp, J. Sheehan, and J. E. Voos, “Wearable performance devices in sports medi-cine,” Sports Health: A Multidisciplinary Approach, vol. 8, no. 1, pp. 74–78, 2015.
[13] S. Saponara, “Wearable biometric performance measurement system for combat sports,” IEEE Transactions on
In-strumentation and Measurement, vol. 66, no. 10, pp. 2545–
2555, 2017.
[14] I. S. Dhindsa, R. Agarwal, and H. S. Ryait, “Performance evaluation of various classifiers for predicting knee angle from Table 5: %MVC results in gym.
Muscle name Part. no. kg SMVC (μV) MVC (μV) MVC%
LBB 1 5 138.3 850.26 16.26 17.5 845.47 850.26 99.43 2 255 138.30987.15 992.6992.6 13.9399.45 3 5 152.6 960.13 15,89 20 898.25 960.13 93,55 4 5 155.4 963.30 16.13 20 929.1 963.30 96.44 5 5 158.9 967.5 16.42 20 956.76 967.5 98.88 6 5 89.5 615.7 14.53 15 614.74 615.7 99.84 7 12.55 538.993.5 545.2545.2 17.1498.84 RBB 1 5 136.5 875.9 15.58 17.5 854.15 875.9 97.51 2 5 140.22 996.4 14.07 25 985.92 996.4 98.94 3 5 154.42 972.4 15.88 20 893.56 972.4 91.89 4 5 156.8 968.7 16.18 20 930.76 968.7 96.08 5 5 164.45 972.65 16.90 20 910.5 972.65 93.61 6 5 97.1 614.4 15.80 15 609.9 614.4 99.26 7 12.55 506.392.2 515.16515.16 17.8998.28
electromyography signals,” Expert Systems, vol. 36, no. 3, pp. e12381–14, 2019.
[15] Y. Yin, Y. Zeng, X. Chen, and Y. Fan, “The internet of things in healthcare: an overview,” Journal of Industrial Information
Integration, vol. 1, pp. 3–13, 2016.
[16] V. Bonaiuto, N. Lanotte, C. Romagnoli, N. Silvaggi, and G. Annino, “Design of a wireless wearable DAQ system for the evaluation of sports performances,” Proceedings, vol. 2, no. 6, pp. 290–295, 2018.
[17] S. Heywood, Y. H. Pua, J. McClelland et al., “Low-cost electromyography—validation against a commercial system using both manual and automated activation timing thresholds,” Journal of Electromyography and Kinesiology, vol. 42, pp. 74–80, 2018.
[18] G. Yang, J. Deng, G. Pang et al., “An IoT-enabled stroke rehabilitation system based on smart wearable armband and machine learning,” IEEE Journal of Translational Engineering
in Health and Medicine, vol. 6, pp. 1–10, 2018.
[19] A. Ranavolo, G. Chini, A. Silvetti, S. Mari, M. Serrao, and F. Draicchio, “Myoelectric manifestation of muscle fatigue in repetitive work detected by means of miniaturized sEMG sensors,” International Journal of Occupational Safety and
Ergonomics, vol. 24, no. 3, pp. 464–474, 2018.
[20] A. Cisnal, R. Alonso, J. P. Turiel, J. C. Fraile, V. Lobo, and V. Moreno, “EMG based bio-cooperative direct force control of an exoskeleton for hand rehabilitation: a preliminary study,” in
Converging Clinical and Engineering Research on Neuro-rehabilitation III. ICNR 2018. Biosystems & Biorobotics,
L. Masia, S. Micera, M. Akay, and J. Pons, Eds., vol. 21, Springer, Cham, Switzerland, 2019.
[21] T. D. Williams, D. V. Tolusso, M. V. Fedewa, and M. R. Esco, “Comparison of periodized and non-periodized resistance training on maximal strength: a meta-analysis,” Sports
Medicine, vol. 47, no. 10, pp. 2083–2100, 2017.
[22] R. A. Panariello, T. J. Stump, and F. A. Cordasco, “The lower extremity athlete: postrehabilitation performance and injury prevention training,” Operative Techniques in Sports
Medi-cine, vol. 25, no. 3, pp. 231–240, 2017.
[23] J. Gondin, P. J. Cozzone, and D. Bendahan, “Is high-frequency neuromuscular electrical stimulation a suitable tool for muscle performance improvement in both healthy humans and athletes?,” European Journal of Applied Physiology, vol. 111, no. 10, pp. 2473–2487, 2011.
[24] S. Grosprˆetre, P. Gimenez, L. Mourot, and G. Coratella, “Elastic band exercise induces greater neuromuscular fatigue than phasic isometric contractions,” Journal of
Electromyog-raphy and Kinesiology, vol. 47, pp. 113–120, 2019.
[25] S. C. F. A. Von Werder, T. Kleiber, and C. Disselhorst-Klug, “A method for a categorized and probabilistic analysis of the surface electromyogram in dynamic contractions,” Frontiers
in Physiology, vol. 6, no. 30, pp. 1–8, 2015.
[26] U. Imtiaz, L. Bartolomeo, Z. Lin et al., “Design of a wireless miniature low cost EMG sensor using gold plated dry elec-trodes for biomechanics research,” in Proceedings of the 2013
IEEE International Conference on Mechatronics and Auto-mation, pp. 957–962, Takamatsu, Japan, August 2013.
[27] G. R. Jones, N. A. Neubauer, B. O’Connor, and J. M. Jakobi, “EMG Functional tasks recordings determines frailty phe-notypes in males and females,” Experimental Gerontology, vol. 77, pp. 12–18, 2016.
[28] S. Sadeghi Esfahlani, B. Muresan, A. Sanaei, and G. Wilson, “Validity of the Kinect and Myo armband in a serious game for assessing upper limb movement,” Entertainment
Com-puting, vol. 27, pp. 150–156, 2018.
[29] Delsys, Natick, MA, USA, “Trigno lab,” 2017, http://www. delsys.com/products/wireless-emg/trigno-lab/.
[30] bitalino, Lisbon, Portugal, “EMG 151015,” 2017, http:// bitalino.com/datasheets/EMG_Sensor_Datasheet.pdf/. [31] Muscle Monitor, Kuopio, FINLAND, “myontec,” 2019,
https://www.myontec.com/musclemonitor/manuals/Old/3_ 1/Muscle%20Monitor%20-%20User%20Guide.pdf12. [32] Mpower, Vimpeli, Finland, “Mpower,” 2019,
http://mpower-bestrong.com/manual/MPOWER_user_manual.pdf. [33] MyoTrac, Montreal, Quebec, Canada, “MyoTrac3,” 2019,
http://www.thoughttechnology.com/pdf/mar870-00% 20myotrac3%20rehab.pdf.
[34] H. P. Da Silva, “Physiological sensing now open to the world: new resources are allowing us to learn, experiment, and create imaginative solutions for biomedical applications,” IEEE
Pulse, vol. 9, no. 2, pp. 9–11, 2018.
[35] A. Burns, B. R. Greene, M. J. McGrath et al., “SHIMMER
™
—A wireless sensor platform for noninvasive biomedical research,” IEEE Sensors Journal, vol. 10, no. 9, pp. 1527–1534, 2010.[36] Viking On Nicolet, Planegg, Germany, “Viking on nicolet,” 2019, https://www.neuroswiss.ch/view/data/5962/Nicolet-Viking-EDX.pdf.
[37] K. Biron, K. Englehart, and P. Parker, “A study of kalman filtering applied to myoelectric signal state tracking,” CMBES, vol. 35, pp. 1–4, 2012.
[38] T. Boaventura, L. Hammer, and J. Buchli, “Interaction force estimation for transparency control on wearable robots using a kalman filter,” in Converging Clinical and Engineering
Re-search on Neurorehabilitation II. Biosystems & Biorobotics,
J. Ib´añez, J. Gonz´alez-Vargas, J. Azor´ın, M. Akay, and J. Pons, Eds., vol. 15, Springer, Cham, Switzerland, 2017.
[39] B. J. Schoenfeld, “The mechanisms of muscle hypertrophy and their application to resistance training,” Journal of Strength
and Conditioning Research, vol. 24, no. 10, pp. 2857–2872,
2010.
[40] B. J. Wallace, H. C. Bergstrom, and T. A. Butterfield, “Muscular bases and mechanisms of variable resistance training efficacy,” International Journal of Sports Science and
Coaching, vol. 13, no. 6, pp. 1177–1188, 2018.
[41] E. Barreiro, “Models of disuse muscle atrophy: therapeutic implications in critically ill patients,” Annals of Translational
Medicine, vol. 6, no. 2, p. 29, 2018.
[42] J. Kilby, K. Prasad, and G. Mawston, “Multi-channel surface electromyography electrodes: a review,” IEEE Sensors Journal, vol. 16, no. 14, pp. 5510–5519, 2016.
[43] D. Devaprakash, G. J. Weir, J. J. Dunne, J. A. Alderson, and C. J. Donnelly, “The influence of digital filter type, amplitude normalisation method, and co-contraction algorithm on clinically relevant surface electromyography data during clinical movement assessments,” Journal of Electromyography
and Kinesiology, vol. 31, pp. 126–135, 2016.
[44] Texas instrument, May 2018, http://www.ti.com/lit/ds/symlink/ ina128.pdf.
[45] Texas instrument, June 2018, http://www.ti.com/lit/ds/symlink/ tl072.pdf.
[46] N. Miljkovi´c, N. Popovi´c, O. Djordjevi´c, L. Konstantinovi´c, and T. B. ˇSekara, “ECG artifact cancellation in surface EMG signals by fractional order calculus application,” Computer
Methods and Programs in Biomedicine, vol. 140, pp. 259–264,
2017.
[47] Analog devices, September 2018, https://www.analog.com/en/ analog-dialogue/articles/practical-filter-design-precision-adcs.html.
[48] A. Widmann, E. Schr¨oger, and B. Maess, “Digital filter design for electrophysiological data - a practical approach,” Journal
of Neuroscience Methods, vol. 250, pp. 34–46, 2015.
[49] A. F. T. Ibrahim, V. R. Gannapathy, L. W. Chong, and I. S. M. Isa, “Analysis of electromyography (EMG) signal for human arm muscle: a review,” in Lecture Notes in Electrical
Engineering, pp. 567–575, 2016.
[50] M. B. I. Raez, M. S. Hussain, and F. Mohd-Yasin, “Techniques of EMG signal analysis: detection, processing, classification and applications,” Biological Procedures Online, vol. 8, p. 11, 2006.
[51] SENIAM, March 2017, http://www.seniam.org/.
[52] F. Negro, K. Keenan, and D. Farina, “Power spectrum of the rectified EMG: when and why is rectification beneficial for identifying neural connectivity?,” Journal of Neural
Engi-neering, vol. 12, no. 3, article 036008, 2015.
[53] K. Praveen, A. D. Arun, and M. Sivaramakrishna, “EMI/EMC qualification of differential pressure monitoring system for PFBR—A case study,” in Proceedings of the 2016 International
Conference on ElectroMagnetic Interference & Compatibility (INCEMIC), pp. 1–4, Bangalore, India, December 2016.
[54] J. Zhang, L. Wang, L. Yu, Y. Yang, Y. Zhang, and B. Li, “A low-offset analogue front-end IC for multi-channel physiological signal acquisition,” in Proceedings of the 2009 Annual
In-ternational Conference of the IEEE Engineering in Medicine and Biology Society, pp. 4473–4476, Minneapolis, MN, USA,
September 2009.
[55] C. K. Chui and G. Chen, “Kalman filter: an elementary ap-proach,” in Kalman Filtering, Springer, Cham, Switzerland, 2017.
[56] A. Toprak and ˙I. G¨uler, “Angiograph image restoration with the use of rule base fuzzy 2D Kalman filter,” Expert Systems
with Applications, vol. 35, no. 4, pp. 1752–1761, 2008.
[57] M. Schimmack, S. Nguyen, and P. Mercorelli, “Anatomy of haar wavelet filter and its implementation for signal pro-cessing,” IFAC-PapersOnLine, vol. 49, no. 6, pp. 99–104, 2016. [58] S. Roldan-Vasco, E. Perez-Giraldo, and A. Orozco-Duque, “Continuous wavelet transform for muscle activity detection in surface EMG signals during swallowing,” in Applied
Computer Sciences in Engineering. WEA 2018. Communica-tions in Computer and Information Science, J.
Figueroa-Garc´ıa, J. Villegas, J. Orozco-Arroyave, and P. Maya Duque, Eds., vol. 916, Springer, Cham, Switzerland, 2018.
[59] S. Ranaldi, C. De Marchis, and S. Conforto, “An automatic, adaptive, information-based algorithm for the extraction of the sEMG envelope,” Journal of Electromyography and
Ki-nesiology, vol. 42, pp. 1–9, 2018.
[60] S. Mazumdar, A. Saikia, N. Sahai, S. Paul, and D. Bhatia, “Determination of significant muscle in movement of upper limb using maximum voluntary contraction of EMG signal,” in Proceedings of the 2017 4th International Conference on
Signal Processing and Integrated Networks (SPIN), pp. 96–99,
Noida, India, February 2017.
[61] B. N. Cahyadi, I. Zunaidi, S. A. Bakar et al., “Upper limb muscle strength analysis for movement sequence based on maximum voluntary contraction using EMG signal,” in
Proceedings of the 2018 International Conference on Com-putational Approach in Smart Systems Design and Applica-tions (ICASSDA), pp. 1–5, Kuching, Malaysia, August 2018.
[62] J. Paquin and G. A. Power, “History dependence of the EMG-torque relationship,” Journal of Electromyography and
Kine-siology, vol. 41, pp. 109–115, 2018.
[63] E. N. Rousanoglou, A. E. Oskouei, and W. Herzog, “Force depression following muscle shortening in sub-maximal
voluntary contractions of human adductor pollicis,” Journal
of Biomechanics, vol. 40, no. 1, pp. 1–8, 2007.
[64] D. Roman-Liu and P. Bartuzi, “Influence of type of MVC test on electromyography measures of biceps brachii and triceps brachii,” International Journal of Occupational Safety and
Ergonomics, vol. 24, no. 2, pp. 200–206, 2018.
[65] J. J. D. Van der Gon, B. M. ter Haar Romeny, and E. J. van Zuylen, “Behaviour of motor units of human arm muscles: differences between slow isometric contraction and relaxation,” The Journal of Physiology, vol. 359, no. 1, pp. 107–118, 1985.
[66] R. U. Newton, W. J. Kraemer, K. H¨akkinen, B. J. Humphries, and A. J. Murphy, “Kinematics, kinetics, and muscle acti-vation during explosive upper body movements,” Journal of
Applied Biomechanics, vol. 12, no. 1, pp. 31–43, 1996.
[67] S. Maeo, Y. Yoshitake, Y. Takai, T. Fukunaga, and H. Kanehisa, “Neuromuscular adaptations following 12-week maximal voluntary co-contraction training,” European
Journal of Applied Physiology, vol. 114, no. 4, pp. 663–673,
International Journal of
Aerospace
Engineering
Hindawi www.hindawi.com Volume 2018Robotics
Journal of Hindawi www.hindawi.com Volume 2018 Hindawi www.hindawi.com Volume 2018Active and Passive Electronic Components VLSI Design Hindawi www.hindawi.com Volume 2018 Hindawi www.hindawi.com Volume 2018
Shock and Vibration
Hindawi
www.hindawi.com Volume 2018
Civil Engineering
Advances inAcoustics and VibrationAdvances in
Hindawi
www.hindawi.com Volume 2018
Hindawi
www.hindawi.com Volume 2018
Electrical and Computer Engineering Journal of Advances in OptoElectronics Hindawi www.hindawi.com Volume 2018
Hindawi Publishing Corporation
http://www.hindawi.com Volume 2013 Hindawi www.hindawi.com
The Scientific
World Journal
Volume 2018 Control Science and Engineering Journal of Hindawi www.hindawi.com Volume 2018 Hindawi www.hindawi.com Journal ofEngineering
Volume 2018Sensors
Journal of Hindawi www.hindawi.com Volume 2018 Machinery Hindawi www.hindawi.com Volume 2018 Modelling & Simulation in Engineering Hindawi www.hindawi.com Volume 2018 Hindawi www.hindawi.com Volume 2018 Chemical EngineeringInternational Journal of Antennas and Propagation International Journal of Hindawi www.hindawi.com Volume 2018 Hindawi www.hindawi.com Volume 2018 Navigation and Observation International Journal of Hindawi www.hindawi.com Volume 2018