http://journals.tubitak.gov.tr/medical/ © TÜBİTAK
doi:10.3906/sag-1707-142
Evaluation of the facial nerve and internal auditory canal cross-sectional areas on
three-dimensional fast imaging employing steady-state acquisition magnetic resonance
imaging in Bell’s palsy
Ebru OZAN SANHAL1,*, Hande ARSLAN2
1Department of Radiology, Faculty of Medicine, Ufuk University, Ankara, Turkey
2Department of Otorhinolaryngology, Dışkapı Yıldırım Beyazıt Education and Training Hospital, Ankara, Turkey
1. Introduction
Idiopathic acute facial palsy, known as Bell’s palsy (BP), is a rapid unilateral facial nerve (FN) paresis or paralysis of unknown cause (1). It is hypothesized to result from herpes simplex virus type 1 (HSV-1)-mediated neural edema leading to entrapment of the FN in the facial canal that leads to ischemia and axonal degeneration (2,3).
Several studies reported intraoperative findings of FN swelling in patients with BP (4,5). Furthermore, contrast enhancement of the edematous part of the FN was shown on magnetic resonance imaging (MRI) (3,6,7). Some anatomical studies have evaluated the variations and anomalies of the facial canal and anatomic portions of the facial nerve (8,9). However, despite the extensive research regarding the pathogenic mechanism of BP, the exact etiology remains obscure. As HSV-1 infection is relatively common in comparison to BP, the presence of anatomical differences that may contribute to the risk in BP is an open question.
Therefore, the aim of our study was to evaluate the FN and internal auditory canal (IAC) on three-dimensional fast imaging employing steady-state acquisition (3D-FIESTA) MRI to define possible structural differences in cases of BP. For this purpose, the diameters and cross-sectional areas (CSAs) of the FN and IAC just near the fundus obtained on 3D-FIESTA MRI on the affected and unaffected sides of the patients with BP were compared. We also analyzed whether there was a correlation between these structural differences and disease severity and prognosis. To our knowledge, this study is the first to demonstrate the structural differences of the FN and IAC on 3D-FIESTA MRI in patients with BP.
2. Materials and methods
This study was conducted in the radiology and otorhinolaryngology departments of our institution. Our institutional review board approved the study protocol and all patients signed informed consent forms.
Background/aim: This study aimed to evaluate the facial nerve (FN) and internal auditory canal (IAC) on three-dimensional fast imaging employing steady-state acquisition (3D-FIESTA) magnetic resonance imaging (MRI) to define possible structural differences in cases of Bell’s palsy (BP).
Materials and methods: Fifty-six patients presenting with BP were included in this study. The measurements of the diameters and the cross-sectional areas (CSAs) of the FNs and IACs obtained on 3D-FIESTA MRI both on the affected and unaffected sides of all patients were compared.
Results: A significant difference was found between affected and unaffected sides of the patients in terms of the mean CSA of the FN and IAC (P < 0.001). The CSAs of the FN were larger and the CSAs of the IAC were smaller on the affected sides than the equivalents on the unaffected sides of the patients, respectively. The difference in terms of the ratios of IAC CSA to FN CSA between affected and unaffected sides of the patients was also found to be statistically significant (P < 0.001).
Conclusion: We have found that FN and IAC size differ on the affected sides of patients with BP. These anatomical differences may contribute to the risk for this disease.
Key words: Facial nerve, internal auditory canal, Bell’s palsy, magnetic resonance imaging, three-dimensional fast imaging employing steady-state acquisition, 3D-FIESTA
Received: 22.07.2017 Accepted/Published Online: 05.04.2018 Final Version: 14.06.2018 Research Article
2.1. Patient selection
The medical records of 56 patients with unilateral BP were reviewed in this retrospective clinical study. Patients presenting with acute onset of idiopathic unilateral facial palsy and who underwent temporal bone MRI within 5 days of onset of facial palsy were included in the study. The exclusion criteria were as follows: 1) facial palsy due to congenital, autoimmune, neurovascular, traumatic, neoplastic, or infectious causes; 2) history of temporal bone surgery; 3) history of facial palsy on the opposite side; and 4) bilateral facial palsy. All patients in the study received 10 days of oral prednisone therapy (60 mg of oral prednisone for 5 days with 5 days of gradually decreasing doses) initiated within 72 h of symptom onset. After discharge from the hospital, the patients were followed for at least 3 months. In addition, according to the records of topographic test results, the FN was affected proximal to the geniculate ganglion in all patients. The Schirmer test and acoustic reflex tests were performed for all patients. The Schirmer test was abnormal in all patients and all patients had a negative acoustic (stapedial) reflex response. The degree of FN function was measured according to the House–Brackmann (HB) FN grading system at presentation and at 3 months after initial symptom onset (10). The measurements of the diameters and the CSAs of the FNs and IACs obtained on 3D-FIESTA MRI both on the affected and unaffected sides of all patients were compared. A similar method of measuring has been used in previous studies (11,12).
2.2. Imaging technique
All scans were performed on a General Electric (GE) SIGNA 1.5 T MRI scanner (GE Medical Systems, Milwaukee, WI, USA) with an eight-channel head coil. For high-resolution MR images of the IAC, an axial 3D-FIESTA sequence was used with the following scanning parameters: repetition time, 5.5 ms; echo time, 2.1 ms; bandwidth, 244 Hz/px; section thickness, 0.8 mm; slice gap, 0.6 mm; matrix size, 256 × 256; number of excitations, 4; flip angle, 65°; field of view, 220 mm.
2.3. Postprocessing of data and image analysis
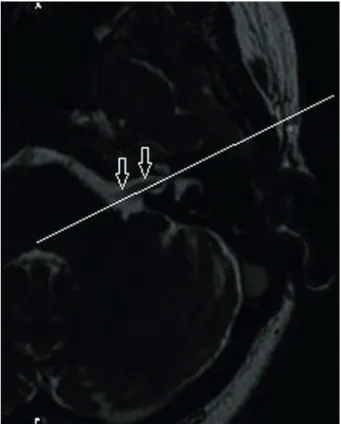
A ClearCanvas Workstation 2.0 (Toronto, Canada) was used to perform the image postprocessing. Oblique sagittal images of 0.4 mm thick perpendicular to the course of the FN were reconstructed (Figure 1) and then magnified 2.5 times. The measurement procedure was performed on the standard images nearest the fundus of the IAC, where the margin of the FN and IAC could be individually identified (Figure 2). All measurements were obtained on the workstation with 0.01-mm electronic calipers. The short diameter (SD) and long diameter (LD) of the FN and IAC were measured on the oblique sagittal images and used to calculate the CSA (π [LD/2] [SD/2]) of the FN and the IAC. The ratios of IAC CSA
to FN CSA were also calculated. Both sides (affected and unaffected) of each patient were measured for comparison. All measurements were obtained independently by two national board-certified radiologists with 10 and 6 years Figure 1. Axial three-dimensional fast imaging employing steady-state acquisition (3D-FIESTA) image shows the facial nerve (FN) (arrows) and the reconstruction plane (straight line) perpendicular to the course of the nerve.
Figure 2. Oblique sagittal three-dimensional fast imaging employing steady-state acquisition (3D-FIESTA) image nearest the fundus of the internal auditory canal (IAC) showing the facial nerve (white arrow), the cochlear nerve (blue arrow), and the superior and inferior vestibular nerves lying posteriorly (red arrow).
of experience in temporal bone radiology, who knew that the patients all had acute facial palsy; however, they were blinded to the original MRI reports and clinical findings. Measurements were performed twice by Reader 1 with a 1-month interval to assess the intraobserver variability. To examine interobserver variability, measurements performed by Reader 2 were compared with the first set obtained by Reader 1. Measurements were then averaged for both readers.
2.4. Statistical analysis
Analysis of the results was performed using IBM SPSS Statistics Version 21.0 for Windows (Armonk, NY, USA). The Kolmogorov–Smirnov test was used for the evaluation of distribution (test of normality). Data were presented as mean and standard deviation. The Pearson correlation coefficient was used to determine the intraobserver variability of the measurements. The paired samples t-test was used for comparison of the measurements between the affected side and unaffected side. Spearman’s correlation analysis was used for the analysis of the correlations among parameters. The Welch t-test was used to compare the mean CSAs found in our study with those in the two previous studies that established the normative CSA of the FN on 3D-driven equilibrium (DRIVE) sequences using 3.0 Tesla MRI and on 3D-constructive interference steady-state (CISS) sequence using 3.0 Tesla MRI, respectively
(9,10). Statistical significance was defined as P < 0.05. The intraclass correlation coefficient (ICC) and the lower and upper limits of the 95% confidence interval (CI) were determined for intraobserver and interobserver variability and interpreted as follows: 0.0–0.2: poor correlation; 0.21– 0.4: fair correlation; 0.41–0.6: moderate correlation; 0.61– 0.8: good correlation; 0.81–1: almost perfect correlation (13).
3. Results
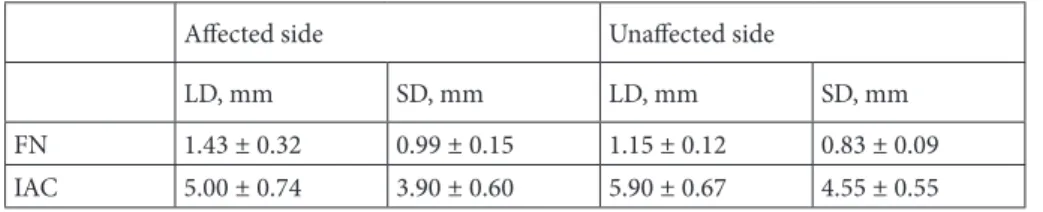
Fifty-six patients (29 [51.7%] women; mean age 47.8 ± 18.5 years) with BP were included in the study. The SD and LD of the FN and IAC by side and CSAs of the FN and IAC by side are shown in Tables 1 and 2, respectively. The intraobserver and interobserver variability were small with the ICCs being 0.976 (0.901–0.994) and 0.957 (0.827– 0.990), respectively. Measurements were then averaged for both readers.
A significant difference was found between affected and unaffected sides of the patients in terms of the mean CSAs of the FN and IAC (P < 0.001). The CSAs of the FN were larger and the CSAs of the IAC were smaller on the affected sides than the equivalents on the unaffected sides of the patients, respectively. The difference in terms of the ratios of IAC CSA to FN CSA between affected and unaffected sides of the patients was also found to be Table 1. The facial nerve and internal auditory canal diameters by side.
Affected side Unaffected side
LD, mm SD, mm LD, mm SD, mm
FN 1.43 ± 0.32 0.99 ± 0.15 1.15 ± 0.12 0.83 ± 0.09 IAC 5.00 ± 0.74 3.90 ± 0.60 5.90 ± 0.67 4.55 ± 0.55 Data are presented as mean ± standard deviation.
FN = Facial nerve; IAC = internal auditory canal; LD = long diameter; SD = short diameter. Table 2. Cross-sectional areas of the facial nerve and internal auditory canal by side.
Affected side Unaffected side
P-value CSA, mm2 CSA, mm2
FN 1.17 ± 0.37 0.73 ± 0.17 P < 0.001 IAC 15.59 ± 4.97 21.32 ± 4.90 P < 0.001 IAC/FN 14.13 ± 7.41 29.61 ± 8.24 P < 0.001 Data are presented as mean ± standard deviation.
FN = Facial nerve; IAC = internal auditory canal; CSA = cross-sectional area; IAC/FN = IAC CSA to FN CSA ratio.
statistically significant (P < 0.001). The ratios of IAC CSA to FN CSA on the affected sides were smaller than those of the unaffected sides of the patients.
A significant positive correlation was found between the SD of the IAC and the IAC CSA to FN CSA ratios, the LD of the IAC and the IAC CSA to FN CSA ratios, and the CSA of the IAC and the IAC CSA to FN CSA ratios on affected sides (r = 0.645, P < 0.001; r = 0.680, P < 0.001; and r = 0.756, P < 0.001, respectively). There was a negative statistical correlation between the SD of the FN, LD of the FN, and CSA of the FN and IAC CSA to FN CSA ratios on the affected sides (r = –0.450, P = 0.001; r = –0.556, P < 0.001; and r = –0.596, P < 0.001, respectively).
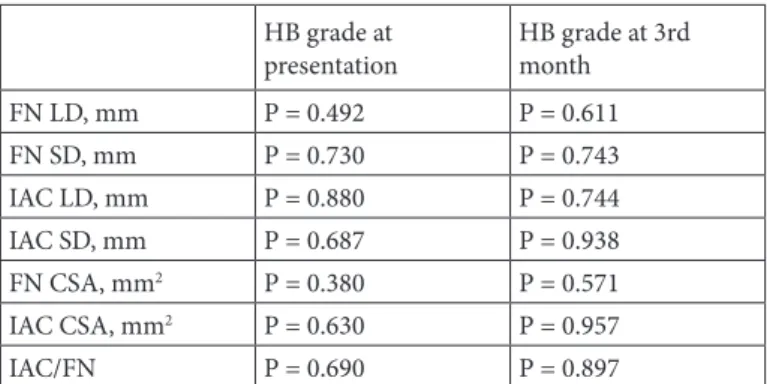
Mean HB grades of the patients at presentation and at 3 months after initial symptom onset were 3.67 ± 1.06 and 1.46 ± 0.82, respectively. No significant correlation was found between any of the measurements of the FN or IAC and HB grades of the patients (Table 3).
The results of comparisons between the mean CSAs of the FN in our study and two previous studies (11,12) are shown in Table 4.
4. Discussion
BP is the most common diagnosis associated with FN paresis or paralysis. While inflammation and edema of the FN associated with HSV-1 infection is suspected, no definite cause for BP has been identified to date (1). On the other hand, it is unclear why some patients experience paralysis while others do not. Moreover, although the majority of cases are self-limited, 30% of patients do not recover completely and have poor outcomes (1). Accordingly, some structural differences of the FN and IAC may arguably contribute to the risk and be associated with disease severity and/or prognosis in BP.
In a recent study, the width of the facial canal (FC) on temporal bone computed tomography (CT) was found to be smaller at the meatal foramen and at the middle part of the labyrinthine segment of the FN on the affected sides of BP patients (14). In another CT study that investigated the role of FC diameter in BP patients, the width at the labyrinthine segment of the FC was found to be significantly smaller in the affected temporal bones (15). However, as the authors of that study stated, only measuring the FC Table 3. The correlation between the measurements and House–
Brackmann grades of the patients. HB grade at
presentation HB grade at 3rd month FN LD, mm P = 0.492 P = 0.611 FN SD, mm P = 0.730 P = 0.743 IAC LD, mm P = 0.880 P = 0.744 IAC SD, mm P = 0.687 P = 0.938 FN CSA, mm2 P = 0.380 P = 0.571 IAC CSA, mm2 P = 0.630 P = 0.957 IAC/FN P = 0.690 P = 0.897
FN = Facial nerve; IAC = internal auditory canal; LD = long diameter; SD = short diameter; CSA = cross-sectional area; IAC/FN = IAC CSA to FN CSA ratio.
Table 4. Comparison of the mean CSAs of the FN in the present study with the previous studies on 3D-DRIVE and 3D-CISS sequences, respectively (11,12).
FN CSA, mm2 P-value
Present study Unaffected side
Previous 3D-DRIVE study P = 0.075 Previous 3D-CISS study P = 0.001* Present study
Affected side
Previous 3D-DRIVE study P < 0.01* Previous 3D-CISS study P < 0.01*
FN = Facial nerve; CSA = cross-sectional area; 3D-DRIVE = 3D-driven equilibrium; 3D-CISS = constructive interference steady state. *P < 0.05.
diameter without considering the FN diameter or the ratio of FC/FN diameter may be inadequate. Moreover, measurement of the CSAs of the FN and FC would be more valuable to draw substantial conclusions.
Several studies investigated the potential of MRI in patients with BP. Most of these studies focused on the enhancement of the FN and made attempts to answer the question of whether or not contrast enhancement of the FN is associated with the disease severity and/or prognosis in BP (3,16,17). Nevertheless, the geniculate ganglion, tympanic, or mastoid segment of the FN may be enhanced in up to 76% of patients without BP due to the rich arteriovenous plexus along the nerve. Furthermore, recent studies that focused on quantitative analysis of FN enhancement on MRI also reported incompatible results (16,18,19). Therefore, to date, diagnostic information based solely on the enhancement of the FN on contrast-enhanced MRI seems to be restricted.
In this study, we have found that the CSAs of the FN were larger and the CSAs of the IAC were smaller on the affected sides than the equivalents on the unaffected sides of the patients. The ratios of the IAC CSA to the FN CSA on affected sides were also found to be smaller than those of the unaffected sides of the patients. Considering the results of our study, we may assume that larger CSAs of the FN on affected sides of the patients may be associated with edema due to inflammation. Nevertheless, the CSAs of the IAC were also found to be smaller on affected sides. Accordingly, the most noteworthy clinical implication of our study is that the difference of the IAC/FN CSA ratios on affected sides of the patients supports the compressive edema and entrapment theory of the FN in BP. These results suggest that there may be structural differences predisposing to the development of compressive edema on one side versus the other and thus contributing to the risk for BP.
The 3D-FIESTA sequence that we used in our study provides much higher spatial resolution than routine MRI sequences and accurate visualization of the cisternal portion of the cranial nerves without the need for intravenous administration of gadolinium-chelate (20,21). This sequence can provide better imaging of the nerves along their courses in the IAC with clearer anatomical details. Moreover, parasagittal images perpendicular to the IAC are useful to clearly distinguish the nerves and to assess their size, position, and structural differences. A number of studies established the normative diameters of the cochlear nerve (CN) and FN on MRI. Herman et al. investigated the CN CSA differences between normal-hearing and deafened patients on MRI (22). Another study evaluated the CN size on MRI in patients with sensorineural hearing loss (23). However, to the best of our knowledge, our study is the first to evaluate the diameters and CSAs of
the FN and IAC in patients with BP. Kang et al. reported normal CSAs of the FN on a 3D-DRIVE sequence using 3.0 Tesla MRI and also evaluated the effect of aging on the sizes of these nerves (11). In a more recent study, the normal diameters of both the FN and CN on 3D-CISS using 3.0 Tesla MRI were reported and the authors stated that the values of FN presented in their study could be used as a standard reference (12). Thus, we compared our results with these two previous studies. No statistical difference was found between the mean CSAs of the FN on unaffected sides of the present study population and the previous 3D-DRIVE study population, while the mean CSAs differed significantly between the unaffected sides of the present study population and the previous 3D-CISS study population. However, both of these previous studies were conducted with different sequences using 3.0 Tesla MRI. Thus, we may assume that measurement differences may be related to this variability of the scanning sequences. On the other hand, we found significant differences between the mean CSAs of the FN on affected sides of the present study population and both of the two previous study populations. However, comparison to a 3D-FIESTA study where measurements were obtained similarly would be more valuable to draw definitive conclusions.
Our study has several limitations. The most important limitation is the lack of control MRI scans of the patients. It would be meaningful regarding anatomical variations to obtain the same measurements on control MRI scans in patients who recovered without sequela after the sixth month of recovery. However, it was not feasible, as we do not routinely obtain new MRI results for patients with BP who have recovered totally in our institution. Further studies to evaluate FN CSA and IAC CSA on control MRI scans in patients with BP who recovered totally would provide more valuable data regarding the issue. We have obtained measurements for the distal IAC just near the fundus that correspond to Bill’s bar, regarding the FN swelling that condenses in this anatomical portion. Nevertheless, measurements obtained on multiple points of the IAC may provide results that are more accurate. Also, only patients with BP were included in our study due to ethical concerns, and we were not able to compare our patients with individuals without BP.
In conclusion, we have found that FN and IAC size differ on the affected sides of patients with BP. This anatomic difference may contribute to the risk for this disease. However, no correlation was found in terms of the grades of the palsy. 3-D FIESTA MRI provides anatomic details of the IAC and may have a diagnostic and/or predictive role in imaging of patients with BP. Our results in this study may serve as a starting point for conducting a study in which larger numbers of patients and controls are utilized in order to draw useful conclusions.
References
1. Baugh RF, Basura GJ, Ishii LE, Schwartz SR, Drumheller CM, Burkholder R, Deckard NA, Dawson C, Driscoll C, Gillespie MB et al. Clinical practice guideline: Bell’s palsy. Otolaryngol Head Neck Surg 2013; 149: S1-27.
2. Piercy J. Bell’s palsy. BMJ 2005; 330: 1374.
3. Yetiser S, Kazkayas M, Altinok D, Karadeniz Y. Magnetic resonance imaging of the intratemporal facial nerve in idiopathic peripheral facial palsy. Clin Imaging 2003; 27: 77-81.
4. Yanagihara N, Honda N, Hato N, Murakami S. Edematous swelling of the facial nerve in Bell’s palsy. Acta Otolaryngol 2000; 120: 667-671.
5. Hagino K, Tsunoda A, Tsunoda R, Kishimoto S. Measurement of the facial nerve caliber in facial palsy: implications for facial nerve decompression. Otol Neurotol 2011; 32: 686-689. 6. Tien R, Dillon WP, Jackler RK. Contrast-enhanced MR
imaging of the facial nerve in 11 patients with Bell’s palsy. AJR Am J Roentgenol 1990; 155: 573-579.
7. Kim IS, Shin SH, Kim J, Lee WS, Lee HK. Correlation between MRI and operative findings in Bell’s palsy and Ramsay Hunt syndrome. Yonsei Med J 2007; 48: 963-968.
8. Nager GT, Proctor B. Anatomic variations and anomalies involving the facial canal. Otolaryngol Clin North Am 1991; 24: 531-553.
9. Dimopoulos PA, Muren C, Smedby O, Waden K. Anatomical variations of the tympanic and mastoid portions of the facial nerve canal: a radioanatomical investigation. Acta Radiol Suppl 1996; 403: 49-59.
10. House JW, Brackmann DE. Facial nerve grading system. Otolaryngol Head Neck Surg 1985; 93: 146-147.
11. Kang WS, Hyun SM, Lim HK, Shim BS, Cho JH, Lee KS. Normative diameters and effects of aging on the cochlear and facial nerves in normal-hearing Korean ears using 3.0-tesla magnetic resonance imaging. Laryngoscope 2012; 122: 1109-1114.
12. Nakamichi R, Yamazaki M, Ikeda M, Isoda H, Kawai H, Sone M, Nakashima T, Naganawa S. Establishing normal diameter range of the cochlear and facial nerves with 3D-CISS at 3T. Magn Reson Med Sci 2013; 12: 241-247.
13. Bland JM, Altman DG. Statistical methods for assessing agreement between two methods of clinical measurement. Lancet 1986; 1: 307-310.
14. Kefalidis G, Riga M, Argyropoulou P, Katotomichelakis M, Gouveris C, Prassopoulos P, Danielides V. Is the width of the labyrinthine portion of the fallopian tube implicated in the pathophysiology of Bell’s palsy?: a prospective clinical study using computed tomography. Laryngoscope 2010; 120: 1203-1207.
15. Celik O, Eskiizmir G, Pabuscu Y, Ulkumen B, Toker GT. The role of facial canal diameter in pathogenesis and grade of Bell’s palsy: a study by high resolution computed tomography. Braz J Otorhinolaryngol 2017; 83: 261-268.
16. Song MH, Kim J, Jeon JH, Cho CI, Yoo EH, Lee WS, Lee HK. Clinical significance of quantitative analysis of facial nerve enhancement on MRI in Bell’s palsy. Acta Otolaryngol 2008; 128: 1259-1265.
17. Burmeister HP, Baltzer PA, Volk GF, Klingner CM, Kraft A, Dietzel M, Witte OW, Kaiser WA, Guntinas-Lichius O. Evaluation of the early phase of Bell’s palsy using 3 T MRI. Eur Arch Otorhinolaryngol 2011; 268: 1493-1500.
18. Kress BP, Griesbeck F, Efinger K, Solbach T, Gottschalk A, Kornhuber AW, Bähren W. Bell’s palsy: what is the prognostic value of measurements of signal intensity increases with contrast enhancement on MRI? Neuroradiology 2002; 44: 428-433.
19. Kress B, Griesbeck F, Stippich C, Bahren W, Sartor K. Bell palsy: quantitative analysis of MR imaging data as a method of predicting outcome. Radiology 2004; 230: 504-509.
20. Erdogan N, Altay C, Akay E, Karakas L, Uluc E, Mete B, Oygen A, Oyar O, Gelal F, Songu M et al. MRI assessment of internal acoustic canal variations using 3D-FIESTA sequences. Eur Arch Otorhinolaryngol 2013; 270: 469-475.
21. Cavusoglu M, Ciliz DS, Duran S, Ozsoy A, Elverici E, Karaoglanoglu R, Sakman B. Temporal bone MRI with 3D-FIESTA in the evaluation of facial and audiovestibular dysfunction. Diagn Interv Imaging 2016; 97: 863-869. 22. Herman B, Angeli S. Differences in cochlear nerve
cross-sectional area between normal hearing and postlingually deafened patients on MRI. Otolaryngol Head Neck Surg 2011; 144: 64-66.
23. Sildiroglu O, Cincik H, Sonmez G, Ozturk E, Mutlu H, Gocgeldi E, Tunca Keskin A, Basekim C, Kizilkaya E. Evaluation of cochlear nerve size by magnetic resonance imaging in elderly patients with sensorineural hearing loss. Radiol Med 2010; 115: 483-487.