Dumlupınar Üniversitesi Sosyal Bilimler Dergisi, 59, 34-47; 2019
34
OIL PRICES AND BANKING STOCKS NEXUS: EVIDENCE FROM AN
OIL-DEPENDENT COUNTRY
Beyza Mina ORDU-AKKAYA
Ramazan SARI
Abstract
We investigate the impact of oil prices on Borsa Istanbul banking index during 2004-2016 and for the periods before and after the 2008 crisis. We especially examine banking stock performances since any significant factor affecting financial institutions, would probably have an impact on the whole economy due to the contagion. Furthermore, banking index is the leader index in Borsa Istanbul with 36% of market capitalization of Borsa Istanbul and financial institutions in Turkey experienced a s ignificant mergers and acquisitions flow in the last decade. Hence, the interrelationship between foreign and domestic markets has intensified, significantly. Our sample period is between 2004 and 2016 and we employ Granger-causality to capture the predictive power of oil prices on stock market and generalized impulse responses to analyze the sign and duration of the relationship. Results reveal that financial and commodity markets are highly integrated and oil is a significant commodity for Turkish market. Furthermore, banking equities seem to benefit from oil price increases between 2008-2016 and therefore one should include banking stocks into their portfolios, when commodity prices are surging.
Keywor ds: emerging market, banking index, oil price, stock market, crisis JEL Codes: G01, Q40, Q43
PETROL FİYATLARI VE BANKACILIK HİSSE SENETLERİ BAĞINTISI: PETROL BAĞIMLI BİR ÜLKEDEN KANIT
Öz
Çalışmamız petrol fiyatlarının Borsa İstanbul banka endeksi üzerindeki etkisini 2004-2016 dönemi için incelerken, kriz öncesi ve sonrası farklılıkları da sınamaktadır. Banka endeksine özellikle bakmamızın nedenlerinden biri finansal kurumları etkileyen önemli faktörlerin bulaşıcılık nedeniyle kuvvetle muhtemel ekonomiyi de etkileyecekleridir. Dahası, banka endeksi Borsa İstanbul’un %36’sını oluşturan ana endekstir ve Türkiye’deki bankacılık sektörü son senelerde ciddi bir birleşme ve satın alma dalgasına ko nu olmuştur. Bu nedenle de yurtdışı ve yerel piyasalar arasındaki bağıntı da geçen seneler içerisinde daha da çok artmıştır. Örneklem kapsamımız 2004 ve 2016 seneleri arasında iken, yöntemimiz Granger-nedensellik ve genelleştirilmiş etki-tepki yöntemini içermektedir. Birinci yöntem ile petrol fiyatlarının hisse senedi piyasaları üzerindeki tahmin gücü test edilirken, ikinci yöntem ile ilişkinin işareti ve süresi incelenmektedir. Sonuçlarımız finansal ve emtia piyasalarının entegre olduğunu ve petrolün Türkiye ekonomisi için önemli bir emtia olduğunu göstermektedir. Öte yandan, banka hisse senetleri özellikle 2008-2016 döneminde petrol fiyatlarındaki artıştan pozitif anlamda etkilenmişlerdir. Bu nedenle petrol fiyatları yükselirken, yatırımcılar portföyüne banka hisse senetlerini eklemeyi düşünebilir.
Anahtar Kelimeler: gelişen piyasa, banka endeksi, petrol fiyatları, hisse senedi piyasası, kriz JEL Kodları: G01, Q40, Q43
An earlier version of this paper was presented in Econ Anadolu 2017 conference. We thank all participants of the
conference for their valuable contribution.
Dr. Öğr. Üyesi, Ankara Sosyal Bilimler Üniversitesi, İşletme Bölümü, [email protected], ORCID:
0000-0003-4353-3977
35 Introduction and a Review of Literature:
One of the key components of economic developments is financial markets (Demirgüç-Kunt, Feyen & Levine, 2012). Financial markets and institutions enhance the allocation of capital through allowing funds to move from people who lack productive investment opportunities to people who have them. Since financial institutions are the primary means of moving funds and more important source of finance than securities markets (Wurgler, 2000), they are highly interrelated with all sectors in an economy. Therefore, a bank failure could result in an economic collapse in a domino fashion.
The second biggest global economic crisis in 2008 affected several sectors and plagued over several countries worldwide. The major underlying reason for the crisis was the irresponsible lending of financial institutions to subprime customers (the Economist, 2013). The real estate bubble contaminated money markets and pushed financial institutions to fire sale their assets resulting in the collapse of US’ one of the biggest bank, Lehman Brothers. Later, the contamination in US spread over Eurozone resulting in a wide-span crisis. Even though, Turkey has close trading and financial relationships with European Union, the deterioration in Turkish economy and its risk premiums has been limited, thanks to regulations after 2001 (Akkaya and Gurkaynak, 2012; Afsar, 2011). These regulations fostered transparency and corporate governance leading to a significant foreign direct investment inflow. Prior to 2000 and 2001 twin banking crises in Turkey, banking sector had severe problems; including but not limited to inadequate capital and fraud (Akkaya and Gurkaynak, 2012). After 2001, banking sector enter into a comprehensive regulation process to stiffen monitoring across banks. The process terminated around 2008 and banking sector has been empowered and been the dominant sector within Borsa Istanbul. Moreover, mergers and acquisitions in the last decade cultivated the interrelationship between foreign and Turkish markets.
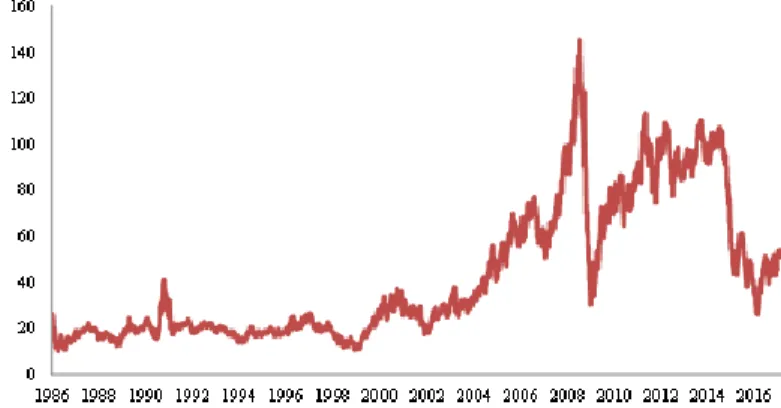
Figure 1: Historical Oil Prices
Source: Datastream.
Notes: Figure 1 presents historical WTI-Cushing 1 month forward oil prices for the period between 1986 and 2017. Strong banking sector is a big positive for Turkish economy, and currently banking sector constitutes 36% of BIST100 indicating the front runner role of commercial banks on the directions of Turkish stock markets. Despite positive characteristics of the economy, the major weakness or the Achilles hill of Turkish economy has been its current account deficit (Akkaya and Gurkaynak, 2012). Given that Turkey is highly reliant on oil import, several findings document that a significant rise in oil prices feeds current account deficit (e.g., Demirbas, Turkay and Turkoglu, 2009).
Especially in the last two decades, crude oil has been highly volatile as we present in Figure 1. Right before 2008 crisis the price was around USD 150 per barrel and following the crises price
36
drastically decreased. Around 2010, prices partially recovered, but by the end of 2015, it was on the brink of swaying under USD 30 per barrel, again. Therefore the volatility in oil prices is making hard to predict future.
After the petrol crisis in 1970s, the question on whether crude oil price shocks affect the economy negatively, had gained interest. Initially, Hamilton’s (1983) seminal paper show oil prices has a significant contribution on recessions. Jones and Kaul (1996) depict US stock returns are negatively related with the increase in oil prices and such study has been path-breaking in terms of being the building block of a new strand of literature. The voluminous literature showed that oil prices have significant impact on both for developed and developing economies (e.g., Hamilton, 1983; Gisser and Goodwin, 1986; Du, Yanan and Wei, 2010).
This literature got even more expansive in the last decade thanks to increasing interest of scholars and the volatility in oil prices (Smyth and Narayan, 2018). In the traditional view, oil price increases affect stock prices through cash flows; higher input costs giving rise to lower profits and hence lower firm value (Jones and Kaul, 1996). Also, soaring oil prices generally lead to inflationary pressures leading to higher discount rates and lower firm values (Huang, Masulis, and Stoll, 1996; Sadorsky, 1999). However, empirical evidences show that results are not always in line with the theoretical background. Literature shows that demand and supply shocks have different implications on stock returns (Kilian, 2009) and moreover relationship between oil prices and stock returns are time-dependent (Mohaddes and Pesaran, 2017) and sector dependent (Arouri, Jouini, & Nguyen, 2012). Furthermore, the discrepancy in findings is attributable to the country characteristics; being an oil-rich or poor (Filis, Degiannakis and Floros, 2011), emerging (Basher and Sadorsky, 2006) or developed (Degiannakis, Filis and Kizys, 2014).
Studies investigating impact of oil prices on banking stocks are actually quite scarce even worldwide. Arouri and Nguyen (2010) study 18 developed European countries and depict that oil price rise positively affect banking stock returns and the causality is running from oil to banking equity returns. Later McSweeney and Worthington (2008) and Nandha and Faff (2008) show oil price rise negatively affects financial stock returns, for Australia and world market indices, respectively. The evidence on Turkish banking sector is very limited and some sector-based papers even do not include financial sector in their research (e.g., Kandir, 2008). Abdioglu and Degirmenci (2014) include banks to study cointegration of sectors with oil stock returns. However, they do not find any significant results.
The consensus on the impact of oil price shocks in Turkish stock returns has not been reached yet. One group argues oil price shocks do not seem to affect the real stock returns significantly (e.g., Sari and Soytas, 2006; Ordu and Soytas, 2016). On the other hand, the other group indicates the impact is negative (e.g. Soytas and Oran, 2011). As Smyth and Narayan (2018) indicate, findings are highly dependent upon time and sector. Therefore, we employ quite a long period of time and provide sub-period results in following sections. Moreover, we examine only banking sector allowing us to elaborate on the relationship between one of the most key sectors of Turkish economy and how does the return performance of this sector changes with crude oil price. Since employing aggregate stock return data conceivably disguises the heterogeneity in the oil price-stock return relationship, we believe our study would provide critical information not only to academics, but also to practitioners. .
Moreover, the volatility in oil prices in the last decade is making this literature even more appealing. The historical-highs before the crisis has been sought by several researchers; some scholars believe it was due to increasing emerging market demand by 2000s (Krugman, 2008) and loose monetary policy (Frankel, 2014) and some argue it was attributable to speculative actions by financial institutions for investment purposes (Robles, Torero, & Braun, 2009). The
37
latter argument is a phenomenon referred to as financialization of commodities and argues commodities are not only essential inputs for the economy, but also a key investment tool. Therefore, they argue commodities and financial markets are now prone to shocks in each other’s markets (Gozgor, Lau and Bilgin, 2016) and financial institutions and commodities are intertwined more than ever.
Hence, bearing the key role of banking within Turkish economy and the dependency of economy on crude oil prices; we aim to examine the impact of oil prices on banking stock returns whilst controlling for exchange rate, VIX and S&P500. Our paper covers a sample period between 2004 and 2016 enabling us to comment on the long-run dynamics between oil and Turkish banking sector performance. The contribution of our paper mainly lies in the utilization of banking stocks in particular one study. Previous studies generally study co-integration and employ all sectors in one study. Therefore, such limited studies provide explanations on banking sector with only a few sentences. For instance, Abdioglu and Degirmenci (2014) find that banking stocks have no co-integration with oil. However, co-integration and Granger-causality analysis give different information to readers. Therefore, our results are not directly comparable to Abdioglu and Degirmenci (2014).
The paper is organized as follows. Section 2 introduces the data descriptions and methodology employed. Section 3 reports the empirical results. Finally, section 4 provides the concluding remarks.
1. Data and Methodology:
We employ 5-weekday daily data for the period beginning from 1 January 2004 to 31 December 2016. Tang and Xiong (2012) indicate that financialization of commodities started in 2004 and hence the start date selected intentionally to capture changing dynamics in the commodity and financial markets scene. Moreover, given Turkish economy experienced twin banking crisis in 2000 and 2001, the relationship should be more relevant after the year 2004.
In the first part of our analysis, we run Granger-causality and impulse response analysis. Following Aloui et al. (2012), we compute excess returns of each series via the conventional method of 𝑅𝑖,𝑡 = ln(𝑃𝑖,𝑡) − ln(𝑃𝑖,𝑡−1) and next deducting 3-month Treasury bill rates of respective country. Through this way, we can control the possibility of interest-rate driven causality.
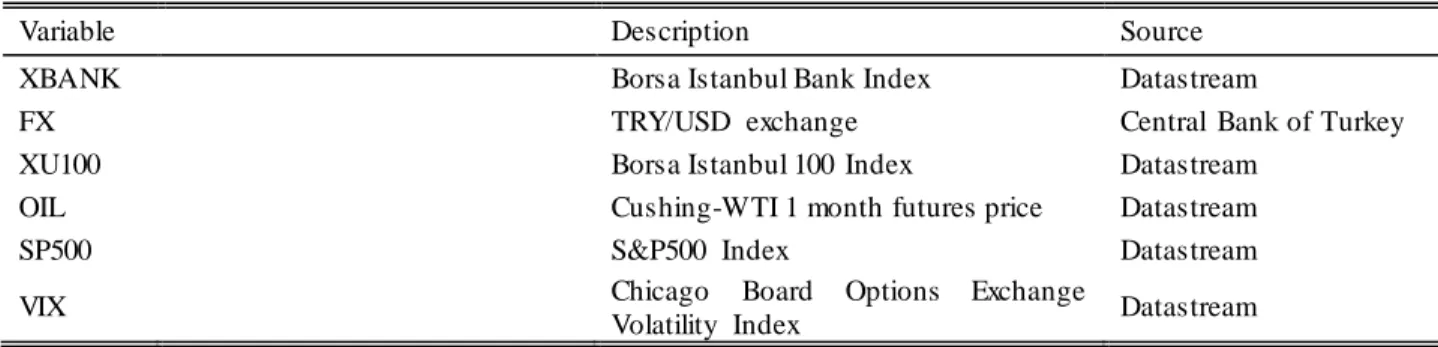
Furthermore, it is worthwhile to mention that all holidays for US and Turkey have been removed from the data to keep consistency. Please refer to Table 1 for variables and their sources:
Table 1: Description of Variables
Variable Description Source
XBANK Borsa Istanbul Bank Index Datastream
FX TRY/USD exchange Central Bank of Turkey
XU100 Borsa Istanbul 100 Index Datastream
OIL Cushing-WTI 1 month futures price Datastream
SP500 S&P500 Index Datastream
VIX Chicago Board Options Exchange
Volatility Index Datastream
As Sadorsky (2001) noted, spot prices are more prone to short-run price fluctuations and therefore, we obtain 1-month futures data for crude oil prices. We include exchange rate to capture the currency difference between USD and TRY denominated variables. S&P500 and VIX indices were taken into account to capture and disentangle the ramifications of worldwide stock markets. VIX measures the implied volatility of S&P500 index options and therefore is a
38
good measure of the investor perceptions and is perceived to be the fear gauge (Sari, Soytas and Hacihasanoglu, 2011).
Please note that, following Aloui, Nguyen and Njeh (2012), we employ excess returns to capture the impact of crude oil prices on stock markets. Through this way, we achieve to analyze the real relationship, so that the gross movement of variables with inflation is ruled out. We calculate excess returns via deducting 3 month Treasury bill of respective country from stock market returns following Aloui et al. (2012).
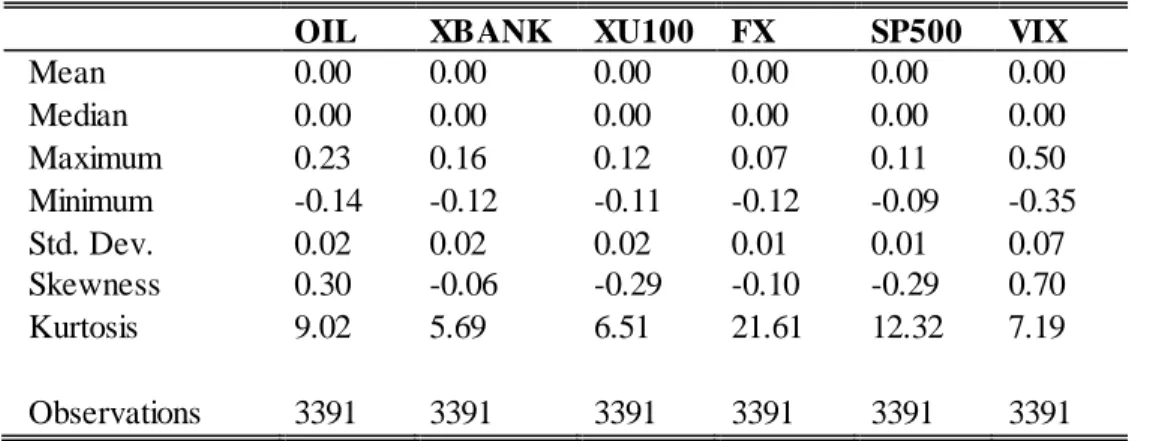
Table 2: Descriptive Statistics
OIL XBANK XU100 FX SP500 VIX
Mean 0.00 0.00 0.00 0.00 0.00 0.00 Median 0.00 0.00 0.00 0.00 0.00 0.00 Maximum 0.23 0.16 0.12 0.07 0.11 0.50 Minimum -0.14 -0.12 -0.11 -0.12 -0.09 -0.35 Std. Dev. 0.02 0.02 0.02 0.01 0.01 0.07 Skewness 0.30 -0.06 -0.29 -0.10 -0.29 0.70 Kurtosis 9.02 5.69 6.51 21.61 12.32 7.19 Observations 3391 3391 3391 3391 3391 3391
Table 3: Unit Root Test Results
ADF DF_GLS PP KPSS NG_Perron OIL -34.90 c -34.49 c -46.62 c 0.04 -1171.03 c XBANK -45.06 c -4.45 c -45.06 c 0.05 -12.49 XU100 -44.48 c -6.00 c -44.49 c 0.05 -25.31 c FX -44.68 c -44.25 c -44.68 c 0.03 -1032.76 c SP500 -35.86 c -48.21 c -50.41 c 0.07 -1028.63 c VIX -36.77 c -49.30 c -56.15 c 0.03 -1025.14 c
Note: a, b and c represent 10%, 5% and 1% significance, respectively.
Table 2 presents descriptive statistics and as one can note that all variables other than oil and VIX are left-skewed implying that extreme losses were observed more than extreme gains for financial markets. On the other hand, oil and VIX are positively skewed which probably suggest commodity markets display less extreme losses compared to equity markets. As you might notice above, kurtoses of returns are all higher than 3 and this indicate that normal distribution under-estimates the frequency of extreme gains or losses in these markets. Table 3 presents stationarity test of the data and if necessary order of integration, have been tested via five different tests4.
4 Namely Augmented Dickey Fuller (ADF), Phillips Perron Test (PP), Elliot, Rothenberg, and Stock’s, Dickey
-Fuller GLS detrended (DF_GLS), Ng and Perron’s Z-alpha (NG_Perron) and Kwiatkowski, Phillips, Schmidt and Shin’s KPSS statistic. The former four statistics test null hypothesis having no unit roots, whereas the last tests the null of the stationarity of the data. Since there are some controversial issues on conventional unit root tests, we provide the results of all five unit root tests in Table 3. Since we employ returns in our analysis, our data is I (1) by construction.
39 1.1 Toda and Yamamoto (1995) approach
We employed Toda and Yamamoto (1995) (TY) approach to investigate the long-run Granger-causality between financial and commodity markets. TY test has two major advantages over other methods. Firstly, co-integration equation estimation is not necessary to employ TY. Secondly, consistency between levels of integration is not obligatory, either, unlike Johansen and Juselius (1990) method. As a result, this test is a highly flexible test and hence has a wide application area.
First of all, one needs to determine the optimum lag length k of VAR and therefore following VAR model has been employed:
𝑌𝑡 = 𝛼𝑡+ ∑𝑘 𝑋𝐵𝐴𝑁𝐾𝑡−𝑘
𝑡=1 + ∑𝑘𝑡=1𝑋𝑈100𝑡−𝑘 + ∑𝑡=1𝑘 𝐹𝑋𝑡−𝑘 + ∑𝑘𝑡=1𝑆𝑃500𝑡−𝑘 + ∑𝑘 𝑉𝐼𝑋𝑡−𝑘
𝑡=1 + ∑𝑘𝑡=1𝑂𝐼𝐿𝑡−𝑘+ 𝜀𝑡 (1)
where 𝑌𝑡 stands for OIL, XBANK, XU100, FX, SP500, and VIX and 𝜀𝑡 are the white noise residuals. 𝑘 is the optimum lag length and has been determined via Schwartz Information Criterion as 2. Findings on the optimum lag length are presented in Table 2.
Our model could be underspecified if we do not include term premium and exchange rate dynamics. Chen et al. (1986) show the significance of interest rates on explaining stock market returns and hence we deduct risk-free rates (3-month T-bill returns) from gross returns and take term premium factor into account. Moreover, as is well-known, oil prices are denominated in US Dollar and hence to consider the true relationship between oil and local stock returns, we should include TRY/ USD rate.
Similarly we should control for XU100 to examine the relationship between banking stock index and oil prices, Otherwise, our results could have been driven by XU100 and we could not know whether it is due to aggregated stock returns (XU100) or XBANK. Therefore, excluding XU100 from results could lead to overly significant relationship between variables of interest.
TY test requires one to estimate an augmented 𝑉𝐴𝑅 (𝑘 + 𝑑), where 𝑘 𝑎𝑛𝑑 𝑑 represent optimum lag length and maximum order of integration, respectively. As we previously mentioned, all variables are stationary at return levels. If we were to use variables in levels, then we should have considered 𝑑 as 0; however, since variables are in returns 𝑑 = 1. The optimum lag length is determined to be 𝑘 = 2 (Table 4) and hence we run VAR (3).
40 Table 4: Optimum Lag Length Results
Lag LogL LR FPE AIC SC HQ
0 56407.19 NA 1.33E-22 -33.34389 -33.33302 -33.34 1 57100.95 1384.654 9.02E-23 -33.73275 -33.65669 -33.70556 2 57332.41 461.1514 8.04E-23 -33.84831 -33.70705* -33.79781* 3 57378.79 92.24282 7.99e-23* -33.85445* -33.64799 -33.78064 4 57413.57 69.03726 7.99E-23 -33.85372 -33.58208 -33.75661 5 57436.51 45.46141 8.05E-23 -33.846 -33.50916 -33.72558 6 57468.3 62.87655 8.07E-23 -33.84351 -33.44147 -33.69978 7 57512.72 87.71836 8.03E-23 -33.84849 -33.38126 -33.68145 8 57541.78 57.28309* 8.07E-23 -33.84439 -33.31196 -33.65404
Note: LR: sequential modified LR test statistic, FPE: Final prediction error, AIC: Ak aik e information criterion, SC: Schwarz information criterion, HQ: Hannan-Quinn information criterion, respectively.
1.2 Impulse response analysis
We also employ generalized impulse response methodology to investigate the sign and significance of each variable to impulses in other variables. An impulse response function computes the effect of shocks at a given point in time on the forthcoming values of variables in a dynamical system as provided in a time profile concept. Therefore, impulse response is kind of an experiment investigating the impact of a one-time shock to innovations on current and future values of other variables. In our paper, we give one standard deviation shock to oil prices and watch out the result on Turkish banking sector, as well as Borsa Istanbul aggregated returns. Innovations (so errors in the VAR equation) are generally correlated and hence may be considered to include a common component, which cannot be associated to a specific variable. Therefore, a transformation is applied to innovations so that they become uncorrelated.
There are mainly two versions of transformation; either Cholesky or generalized. The former version levies an ordering of variables included in the VAR and assigns all of the effect of any common component to the variable that is the first in the ordering. Hence, responses can change significantly if the scholar changes ordering of the variables. On the other hand, as Pesaran and Shin (1998) explain, generalized impulse responses constructs an orthogonalized set of innovations and therefore does not depend on the VAR ordering.
Bearing such advantage in mind, we employ generalized impulse responses and investigate the sign of the predictive relationship learned via Granger-causality.
2. Results:
2.1 Toda and Yamamoto findings
We aim to investigate the impact of oil price shocks on Turkish banking stock index returns through TY and impulse response analysis.5 In the first stage of our analysis, we perform TY for the sample period and results are follows:
5 Following the unit root tests and optimal lag length selection, stability of all VAR system has been examined. All
unit roots are within the unit circle and therefore stability is assured. Please note that diagnostic tests have been run and as one would expect we have observed serial autocorrelat ion and heteroskedasticity and overcame such problem via reestimation of standard errors by Newey-West and White adjustments. Results for these diagnostic tests and adjusted standard errors are available upon request.
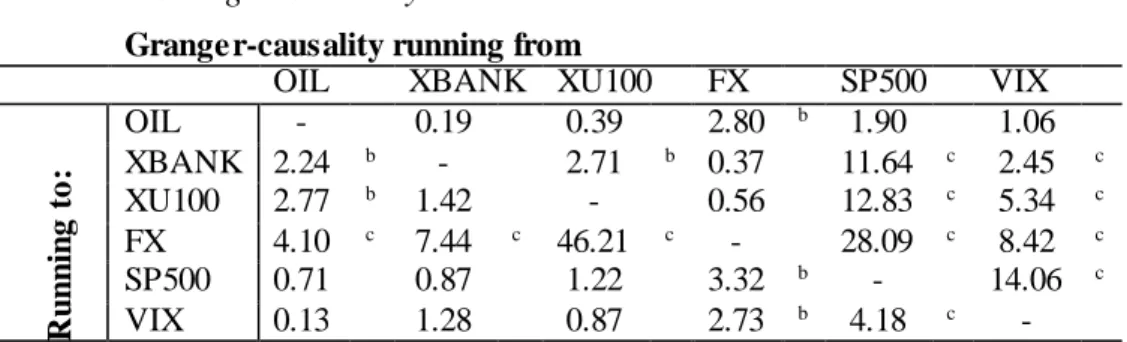
41 Table 5: Granger Causality Results
Granger-causality running from
OIL XBANK XU100 FX SP500 VIX
R u n n in g to : OIL - 0.19 0.39 2.80 b 1.90 1.06 XBANK 2.24 b - 2.71 b 0.37 11.64 c 2.45 c XU100 2.77 b 1.42 - 0.56 12.83 c 5.34 c FX 4.10 c 7.44 c 46.21 c - 28.09 c 8.42 c SP500 0.71 0.87 1.22 3.32 b - 14.06 c VIX 0.13 1.28 0.87 2.73 b 4.18 c -
Note: a, b and c represent 10%, 5% and 1% significance, respectively.
Table 5 presents TY Granger-causality results. This method allows one to understand the predictive power of oil price changes on banking stock returns. Given that, financial managers adjust their portfolio depending upon the market characteristics and condition, findings of Granger causality would shed a light on how should practitioners perceive oil price changes. From an academic perspective, TY procedure is a simple to employ yet a robust methodology and hence findings are easily replicable.
Our findings imply that oil Granger-causes both market and banking indices, which support findings of Basher and Sadorsky (2006) and Arouri and Nguyen (2010). Therefore, a significant change in oil prices give crucial information on future values of Turkish stocks. More critically, we would like to note that, Granger causality between oil and banking stock returns is significant event after controlling for aggregated markets return (XU100). Therefore, it is of utmost importance to state that our results are not driven by other sectors and especially from other markets. Although, banking stocks comprise a big chunk of Borsa Istanbul, this finding is particularly important. Hence, our results propose that that oil helps to improve the forecasting ability of Turkish equity markets and especially banking stocks.
We also find that market and banking indices Granger cause TRY/USD exchange rate hinting traditional portfolio formation belief (Bahmani-Oskoee and Sohrabian, 1992). This portfolio balance model asserts that individuals allocate their wealth between domestic and foreign money as well as domestic and foreign stocks. Therefore, authors argue changes in stock prices could also have an impact on exchange rates.
Furthermore, S&P500 Granger-causes Turkish equities as well as crude oil implying that the transmission mechanism is from US market to oil and then to Turkish stocks. In addition, the linkage is more pronounced considering VIX since causality is running from VIX to TRY/USD exchange rate and market index of Turkey. Given that VIX is the fear gauge of stock market investors, it has impact on Turkish market through perception of global investors.
2.2 Generalized impulse response findings
We also perform generalized impulse responses of banking and stock indices to one standard deviation of shock in oil returns. Although, we check for the causality in the previous section, we do not know how long explanatory power of oil stays (is it days or weeks?). Moreover, we cannot comment on the sign of the relationship; for instance, whether an increase in oil price leads to an increase or a decrease on banking stock index performance. Therefore, to check for the significance and sign of the analysis, we employ impulse response analysis. Since there have been significant changes in the last two decades we divide analysis into sub-periods.
Adams and Gluck (2015) mention that co-movements provide the necessary information on when the characteristics of series have changed structurally. However, unconditional correlation methods such as moving averages do not depict the true nature of relationship and only increase
42
concerns on heteroscedasticity (Forbes and Rigobon, 2002). Therefore, we employ Asymmetric Dynamic Conditional Correlation (ADCC) methodology from GARCH family6 and we present in Figure 2.
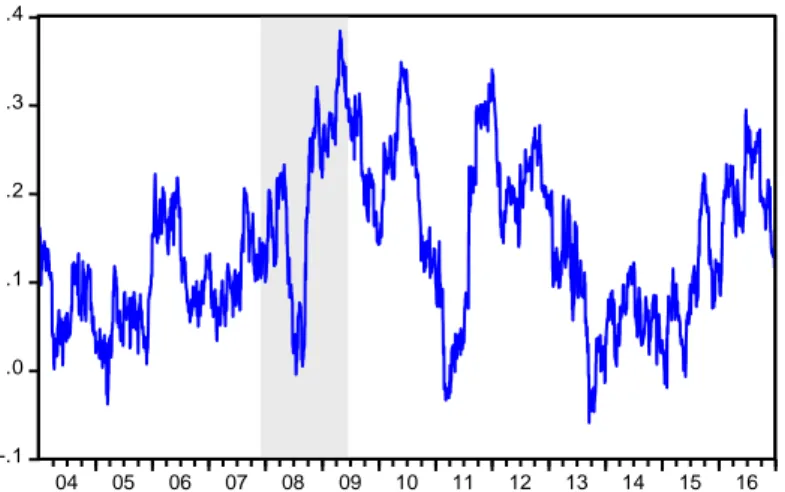
This method basically computes the time-varying co-movement characteristics between banking stocks and oil. Figure 2 shows that correlation has been quite volatile in the last decade. Especially during and after the crisis, one can note that there are break points, where the trend changes significantly. Hence, we utilize Bai and Perron (2006) multiple structural breakpoint test and analyze key breakpoints.
Figure 2: Time Varying Correlations Between XBANK and OIL
Source: Author’s own calculations
Bai and Perron (2006) findings imply that the trend of co-movement between oil and banking sector changes significantly at 30 September 2008, 23 September 2010 and 29 January 2013 and hence we have 4 sub-periods.
The first sub-period is between 1 January 2004 and 30 September 2008, which could be referred to as pre-crisis episode. Second sub-period is during 1 October 2008 and 23 September 2010 as Global Financial Crisis. Though the crisis has not ended but structurally changed to as a Eurozone crisis between 24 September 2010 and 29 January 2013 and hence we rename the period as Euro-crisis period. Finally, we refer to the 4th sub-period as post-crisis period between 30 January 2013 and 31 December 2016. We run above-mentioned VAR in equation 1 for all sub-periods and present each result in Figure 3, separately.
Table 6: Bai and Perron (2006) Results
Break dates Following sub-periods
30-Sep-08 1-Jan-04 and 30-Sep-08 23-Sep-10 1-Oct-08 and 23-Sep-10 29-Jan-13 24-Sep-10 and 29-Jan-13
30-Jan-13 and 31-Dec-16
6 For further information on ADCC method one could refer to paper by Cappiello, Engle and Sheppard (2006) -.1 .0 .1 .2 .3 .4 04 05 06 07 08 09 10 11 12 13 14 15 16
43 Figure 3: Generalized Impulse Responses
Panel A: 1-Jan-04 and 30-Sep-08
Panel C: 24-Sep-10 and 29-Jan-13
Panel B: 1-Oct-08 and 23-Sep-10
Panel D: 30-Jan-13 and 31-Dec-16
-.003 -.002 -.001 .000 .001 .002 .003 1 2 3 4 5 6 7 8 9 10
Response of XBANK to OIL
-.002 -.001 .000 .001 .002 .003 1 2 3 4 5 6 7 8 9 10
Response of XU100 to OIL
Response to Generalized One S.D. Innovations ± 2 S.E.
-.002 .000 .002 .004 .006 1 2 3 4 5 6 7 8 9 10
Response of XBANK to OIL
-.002 -.001 .000 .001 .002 .003 .004 .005 1 2 3 4 5 6 7 8 9 10
Response of XU100 to OIL
Response to Generalized One S.D. Innovations ± 2 S.E.
-.004 .000 .004 .008 .012 1 2 3 4 5 6 7 8 9 10
Response of XBANK to OIL
-.002 .000 .002 .004 .006 .008 .010 1 2 3 4 5 6 7 8 9 10
Response of XU100 to OIL
Response to Generalized One S.D. Innovations ± 2 S.E.
-.002 -.001 .000 .001 .002 .003 .004 1 2 3 4 5 6 7 8 9 10
Response of XBANK to OIL
-.001 .000 .001 .002 .003 1 2 3 4 5 6 7 8 9 10
Response of XU100 to OIL
44
Generalized impulse response findings propose that during pre-crisis episode, oil prices did not affect banking index and aggregate stock returns significantly. During this time period, oil prices were experiencing their record highs (see Figure 1) and Turkish banking was just recovering from the 2000 – 2001 twin banking crisis. Many scholars believe the commodity bubble around 2008 was attributable to the easy monetary policy of Fed. On the other hand, Turkish economy was applying a significant hard monetary policy to cope up and restructure its banking sector. Therefore, global dynamics was not in place for Turkey between 2004 and 2008.
On the other hand, after the burst of the crisis, our results depict that, an increase in oil prices has a positive impact on banking stock returns. Therefore, a rise in oil prices does not seem to be a big problem in terms of stock returns. Previous findings show that oil price increase is actually negative for oil-importing countries (Basher and Sadorsky, 2006), since oil is the major cost-base of manufacturing and hence an increase in cost-base leads to lower profitability. However, our findings propose the exact opposite for banking stock returns. This result, could be attributed to banks being a non-manufacturing sector and hence being relatively resistant to oil prices. Moreover, banks are the strongest side of Turkish economy. Even during Eurozone crisis, banks headquartered in GIIPS countries (Greece, Ireland, Italy, Portugal and Spain) but having Turkish branches have helped such countries to recover more quickly. Therefore, banking sector has been on the radar of foreign portfolio managers in the last decade.
Hence, we can comment that oil price increase is not necessarily a damaging issue for Turkish stock market responses. However, one should note that stock market responds the next day to a shock and the impact dies out by around a week. Therefore, predictive power of oil is highly significant but valid for a very short time period.
3. Conclusion:
We aim to examine the impact of WTI-Cushing oil prices on market and banking index returns in Turkey, while controlling for exchange rate, VIX and S&P 500 index returns from 2004 to 2016. We employ Toda-Yamomato procedure as well as generalized impulse response analyses to understand the linkage between commodity and financial markets. The former method enables one to analyze the causality relationship and whether oil has any predictive power on Turkish banking stock index. The latter method, though, helps reader to see the sign of the relationship as well as the duration of a shock on banking returns.
Our results are quite illuminating in terms of depicting the impact of oil price changes on banking companies. Previous studies mainly focus on the relationship between manufacturing companies and oil prices; however, financial service companies have not received much attention. Given that Turkish banking sector comprise of around 36% of market capitalization of Borsa Istanbul, we believe our paper fills a significant gap looking from the financial institutions side. Moreover, Turkish banking sector has experienced a significant mergers and acquisitions (M&A) flow in the last two decades and hence the interrelationship of local and foreign markets got even stronger.
Results reveal that there is Granger-causality running from oil to both market and banking indices. Furthermore, it is of utmost importance to note that we include both aggregated market (XU100) and banking stock returns to make sure that our results are not driven by other sectors or dynamics. Additionally, impulse response analysis shows that oil price shocks have rather positive impact on stock returns. This could be attributed to banking stocks being relatively resistant to oil price changes since they are service companies. Finally, yet importantly, market index Granger-causes exchange rate, suggesting traditional portfolio rebalance model (Bahmani-Oskooee and Sohrabian, 1992). This model argues that shocks in stock market directly transmits to foreign exchange rates through foreign investors. Furthermore, S&P500 and VIX
Granger-45
causes both TRY/USD exchange rate and market indices, showing the dynamic relationship between US and Turkish markets.
Our results imply that investors would highly benefit of including Turkish banking stocks in their portfolio, especially when oil prices are high. Moreover, from policy-makers perspective, we show that oil price increases are not necessarily damaging for financial services companies. Further studies examining the impact of other commodities on banking stock performances might benefit decision-making process of investors, policy-makers and executives. It may also prove to be fruitful to examine stock index and sub-index behavior in other emerging markets, as well.
References
Abdioğlu, Z., & Değirmenci, N. (2014). Petrol fiyatlari-hisse senedi fiyatlari ilişkisi: bist sektörel analiz. Kafkas Üniversitesi İktisadi ve İdari Bilimler Fakültesi Dergisi, 5(8), 1-24.
Adams, Z., & Glück, T. (2015). Financialization in commodity markets: A passing trend or the new normal?. Journal of Banking & Finance, 60, 93-111.
Afşar, M. (2011). Küresel kriz ve Türk bankacılık sektörüne yansımaları. Eskişehir Osmangazi
Üniversitesi İİBF Dergisi, 6(2), 143-171.
Akkaya, Y., & Gurkaynak, R. (2012). Cari açık, bütçe dengesi, finansal istikrar ve para politikası: Heyecanlı bir dönemin izi. İktisat İşletme ve Finans, 27(315), 93-119.
Aloui, C., Nguyen, D. K., & Njeh, H. (2012). Assessing the impacts of oil price fluctuations on stock returns in emerging markets. Economic Modelling, 29(6), 2686-2695.
Arouri, M. E. H., Jouini, J., & Nguyen, D. K. (2012). On the impacts of oil price fluctuations on European equity markets: Volatility spillover and hedging effectiveness. Energy
Economics, 34(2), 611-617.
Arouri, M. E. H., & Nguyen, D. K. (2010). Oil prices, stock markets and portfolio investment: evidence from sector analysis in Europe over the last decade. Energy Policy, 38(8), 4528-4539.
Bahmani-Oskooee, M., and A. Sohrabian. 1992. Stock prices and the effective exchange rate of the dollar. Applied Economics 24 (4):459–64. doi:10.1080/00036849200000020
Basher, S. A., & Sadorsky, P. (2006). Oil price risk and emerging stock markets. Global finance
journal, 17(2), 224-251.
Cappiello, L., Engle, R. F., & Sheppard, K. (2006). Asymmetric dynamics in the correlations of global equity and bond returns. Journal of Financial econometrics, 4(4), 537-572.
Chen, N. F., Roll, R., & Ross, S. A. (1986). Economic forces and the stock market. Journal of
business, 383-403.
Degiannakis, S., Filis, G., & Kizys, R. (2014). The effects of oil price shocks on stock market volatility: Evidence from European data. The Energy Journal, 35(1), 35-56.
Demirbaş, M., Türkay, H., & Türkoğlu, M. (2009). Petrol fiyatlarındaki gelişmelerin Türkiye'nin cari açığı üzerine etkisinin analizi. Süleyman Demirel Üniversitesi İktisadi ve İdari
Bilimler Fakültesi Dergisi, 14(3).
Demirgüç-Kunt, A., Feyen, E., & Levine, R. (2012). The evolving importance of banks and securities markets. The World Bank Economic Review, 27(3), 476-490.
46
Doroodian, K., & Boyd, R. (2003). The linkage between oil price shocks and economic growth with inflation in the presence of technological advances: a CGE model. Energy
Policy, 31(10), 989-1006.
Du, L., Yanan, H., & Wei, C. (2010). The relationship between oil price shocks and China’s macro-economy: An empirical analysis. Energy policy, 38(8), 4142-4151.
Filis, G., Degiannakis, S., & Floros, C. (2011). Dynamic correlation between stock market and oil prices: The case of oil-importing and oil-exporting countries. International Review of
Financial Analysis, 20(3), 152-164.
Forbes, K. J., & Rigobon, R. (2002). No contagion, only interdependence: measuring stock market comovements. The journal of Finance, 57(5), 2223-2261.
Frankel, J. A. (2014). Effects of speculation and interest rates in a “carry trade” model of commodity prices. Journal of International Money and Finance, 42, 88-112.
Gisser, M., & Goodwin, T. H. (1986). Crude oil and the macroeconomy: Tests of some popular notions: Note. Journal of Money, Credit and Banking, 18(1), 95-103.
Gozgor, G., Lau, C. K. M., & Bilgin, M. H. (2016). Commodity markets volatility transmission: Roles of risk perceptions and uncertainty in financial markets. Journal of International
Financial Markets, Institutions and Money, 44, 35-45.
Hamilton, J. D. (1983). Oil and the macroeconomy since World War II. Journal of political
economy, 91(2), 228-248.
Huang, B. N., Hwang, M. J., & Peng, H. P. (2005). The asymmetry of the impact of oil price shocks on economic activities: an application of the multivariate threshold model. Energy
Economics, 27(3), 455-476.
Huang, R. D., Masulis, R. W., & Stoll, H. R. (1996). Energy shocks and financial markets. Jones, C. M., & Kaul, G. (1996). Oil and the stock markets. The Journal of Finance, 51(2),
463-491.
Kandir, S. Y. (2008). Macroeconomic variables, firm characteristics and stock returns: evidence from Turkey. International research journal of finance and economics, 16(1), 35-45. Kaufman, G. G. (1994). Bank contagion: A review of the theory and evidence. Journal of
Financial Services Research, 8(2), 123-150.
Kilian, L. (2009). Not all oil price shocks are alike: Disentangling demand and supply shocks in the crude oil market. American Economic Review, 99(3), 1053-69.
Krugman, P. (2008). Commodities and speculation: metallic (and other) evidence. The New York
Times. Retrieved from
http://krugman.blogs.nytimes.com/2008/04/20/commodities-and-speculation- metallic-evidence/?_r=1
McSweeney, E. J., & Worthington, A. C. (2008). A comparative analysis of oil as a risk factor in Australian industry stock returns, 1980-2006. Studies in economics and finance, 25(2), 131-145.
Mohaddes, K., & Pesaran, M. H. (2017). Oil prices and the global economy: Is it different this time around?. Energy Economics, 65, 315-325.
Nandha, M., & Faff, R. (2008). Does oil move equity prices? A global view. Energy
47
Ordu, B. M., & Soytaş, U. (2016). The relationship between energy commodity prices and electricity and market index performances: evidence from an emerging market. Emerging
Markets Finance and Trade, 52(9), 2149-2164.
Pesaran, H. H., & Shin, Y. (1998). Generalized impulse response analysis in linear multivariate models. Economics letters, 58(1), 17-29.
Ramos, S. B., & Veiga, H. (2011). Risk factors in oil and gas industry returns: International evidence. Energy Economics, 33(3), 525-542.
Robles, M., Torero, M., & Von Braun, J. (2009). When speculation matters. Washington, DC: International Food Policy Research Institute.
Sadorsky, P. (1999). Oil price shocks and stock market activity. Energy economics, 21(5), 449-469.
Sadorsky, P. (2001). Risk factors in stock returns of Canadian oil and gas companies. Energy
economics, 23(1), 17-28.
Sari, R., & Soytas, U. (2006). The relationship between stock returns, crude oil prices, interest rates, and output: evidence from a developing economy. The Empirical Economics
Letters, 5(4), 205-220.
Sari, R., Soytas, U., & Hacihasanoglu, E. (2011). Do global risk perceptions influence world oil prices?. Energy Economics, 33(3), 515-524.
Smyth, R. & Narayan, PK. (2018). What do we know about oil prices and stock returns?.
International Review of Financial Analysis. Accepted Manuscript.
Soytas, U., & Oran, A. (2011). Volatility spillover from world oil spot markets to aggregate and electricity stock index returns in Turkey. Applied energy, 88(1), 354-360.
The Economist (2013). Crash course. Accessed from
https://www.economist.com/news/schoolsbrief/21584534-effects-financial-crisis-are-still-being-felt- five- years-article on 25 March 2018.
Toda, H. Y., & Yamamoto, T. (1995). Statistical inference in vector autoregressions with possibly integrated processes. Journal of econometrics, 66(1), 225-250.
Wurgler, J. (2000). Financial markets and the allocation of capital. Journal of financial