AGE
RELATED ALTERATIONS OF ADULT
NEUROGENESIS AND ASTROCYTES IN
ZEBRAFISH (DANIO RERIO)
A THESIS SUBMITTED TO
THE GRADUATE SCHOOL OF ENGINEERING AND SCIENCE
OF BILKENT UNIVERSITY
IN PARTIAL FULFILLMENT OF THE REQUIREMENTS FOR
THE DEGREE OF
MASTER OF SCIENCE
IN
NEUROSCIENCE
By
Narin Ilgım Ardıç September 2019
AGE RELATED ALTERATIONS OF ADULT NEUROGENESIS AND ASTROCYTES IN ZEBRAFISH (DANIO RERIO)
By Narin Ilgım Ardıç
September 2019
We certify that we have read this thesis and that in our opinion it is fully adequate, in scope and in quality, as a thesis for the degree of Master of Science.
Michelle Marie Adams (Advisor)
Fahriye Duygu Çetinkaya
Urartu Özgür Şafak Şeker
Approved for the Graduate School of Engineering and Science
Ezhan Karaşan
ABSTRACT
AGE RELATED ALTERATIONS OF ADULT NEUROGENESIS AND ASTROCYTES IN ZEBRAFISH (DANIO RERIO)
Narin Ilgım Ardıç M.Sc. in Neuroscience Advisor: Michelle Marie Adams
September 2019
Brain aging is marked by a decline in cognitive abilities and associated with neurodegenerative disorders. In order to identify appropriate interventions to change the course of brain aging and age-related neurological disorders, we should first understand the normal age-related changes. Previous studies claimed that there was a correlation between cognitive capacities and number of neurons. However, recent studies have shown no statistically significant change in total neuron number during healthy aging. Therefore, further studies are required to understand the reasons behind these changes in the brain. One possibility could be the age-related alterations in neuronal lineage and glial markers. Thus, this study aims to show the protein levels, distributions, and localizations of key neuronal lineage and glial markers, which include neural progenitor, early neuronal, immature neuron, and mature neuron and glial markers during healthy aging of the zebrafish brain. For this aim, we measured NeuN (Fox-3, Rbfox3, or Hexaribonucleotide Binding Protein-3), MAP-2 (Microtubule-associated protein 2), HuC (ELAV like neuron-specific RNA binding protein 3), DCAMKL-1 (Doublecortin-like kinase 1), and GFAP (Glial fibrillary acidic protein) with immunohistochemistry and western blot techniques. First, the immunohistochemistry technique was applied on two specific proliferation areas, pallium and optic tectum, to detect the changes in the number of neuronal lineages and glial marker. The results indicated no statistically significant changes between young and old groups. Secondly, we performed whole-brain immunohistochemistry of all markers and quantified every image by manually counting the positive signal. We found that aging did not have an effect on the distribution and expression of the markers, even in the whole brain. Finally, Western-blot was performed in whole brain lysates to compare neuron number and protein level changes. Western-blot results indicated an age-related statistically significant decline in immature neuron marker for
progenitor marker showed the significant decline in males during aging but no change between two age groups. Results of the mature neuron antibody revealed that the protein levels were consistent through aging and did not show variation. Our results overall support the finding that the number of neurons and glia do not change during aging since the numbers of markers were not show statistically significant changes during the aging process in the proliferation areas of the zebrafish brain. However, protein levels showed changes between age and gender groups. Thus, this study shows that understanding changes in the number of cells need to count; protein level is not representative, and zebrafish is an appropriate model for brain aging studies.
ÖZET
ZEBRABALIĞI (DANIO RERIO) MODELİNDE YETİŞKİN NÖROGENEZİ VE ASTOSİTLERİN YAŞLANMAYA BAĞLI DEĞİŞİMLERİ
Narin Ilgım Ardıç
Nörobilim Yüksek Lisans Programı Tez Danışmanı: Michelle Marie Adams
Eylül 2019
Beyin yaşlanması zihinsel yeteneklerin azalması ile belirgin olan ve nörodejeneratif hastalıklarla ilişkisi olan bir süreçtir. Beyin yaşlanması ve yaşlanmaya bağlı nörolojik bozuklukların seyrini değiştirmek ve uygun müdahaleleri belirlemek için önce normal yaşlanmaya bağlı değişiklikleri anlamalıyız. Önceki çalışmalar, bilişsel kapasite ile nöron sayısı arasında bir ilişki olduğunu iddia ediyorken; son çalışmalar normal yaşlanma sırasında toplam nöron sayısında istatistiksel olarak anlamlı bir değişiklik olmadığını göstermiştir. Bu yüzden yaşlanmaya bağlı değişikliklerin arkasındaki nedenlerin anlamlandırılması için yeni çalışmalar gereklidir. Olası nedenlerden birisi, nöronal soy ve glial belirteçlerde yaşa bağlı değişiklikler olabilir. Dolayısıyla, bu çalışmanın amacı, zebra balığı beyninin normal yaşlanmasında nöral progenitör, erken nöronal, olgunlaşmamış nöron, olgun nöron ve glial markerleri içeren anahtar nöronal soy ve glial markörlerin protein seviyelerini, dağılımlarını ve lokalizasyonlarını göstermektir. Bu amaç için immünohistokimya ve Western-blot tekniklerini kullanarak NeuN (Fox-3, Rbfox3 veya Hexaribonucleotide Bağlayıcı Protein-3), MAP-2 (Microtubule ile ilişkili protein-2), HuC (ELAV benzeri nöron-spesifik RNA bağlayıcı protein 3), DCAMKL-1 (doublecortin benzeri kinaz 1) ve GFAP (Glial fibril asidik protein) markerlarına baktık. İlk olarak, iki spesifik proliferasyon alanı olan Pallium ve Optic tectum alanlarında nöronal soy ve glial marker sayılarının değişimlerini tespit etmek için immünohistokimya tekniği uygulandı. Sonuçlar genç ve yaşlı gruplar arasında istatistiksel olarak anlamlı bir değişiklik olmadığını göstermiştir. İkinci olarak, tüm markörler için bütün beyin immünohistokimyasını yaptık ve pozitif sinyalleri manuel olarak sayarak her görüntüyü ölçtük. Yaşlanmanın, tüm beyinde bile belirteçlerin dağılımı ve ifadesi üzerinde bir etkisi olmadığını bulduk. Son olarak, Western-blot tekniğini kullanarak tüm beyin lizatlarında yaşa ve cinsiyete bağlı protein seviyelerindeki farklılıklara hücre sayıları ile karşılaştırma yapmak
düşüşleri olgunlaşmamış nöronlarda özellikle erkeklerde ve glial markörde özellikle dişilerde gösterdi. Nöral progenitör markörü yaşa bağlı anlamlı bir değişim göstermezken, erkekler için yaşla birlikte önemli bir düşüş gösterdi. Olgun nöron antikorunun sonuçları, protein seviyelerinin yaşlanma ile tutarlı olduğunu ve değişiklik göstermediğini ortaya koydu. Sonuçlar genel olarak, zebra balığı beyninin proliferasyon bölgelerinde yaşlanma süresince markörlerin sayımları istatistiksel olarak anlamlı bir değişiklik göstermediği için, sağlıklı yaşlanma sırasında nöron ve glia sayısının değişmediğini ortaya koymaktadır. Ancak protein düzeyleri yaş ve cinsiyet grupları arasında değişiklikler gösterdi. Bu nedenle, bu çalışma hücre sayısındaki değişiklerin anlaşılabilmesi için hücre sayımının yapılmasının gerekliliğini vurgulayıp, protein seviyelerinin temsili olmadığını ve zebra balığının beyin yaşlanması çalışmaları için uygun bir model olduğunu göstermektedir.
Anahtar Kelimeler: zebrabalığı, yaşlanma, nörogenez, glia, western-blot, immunohistokimya
ACKNOWLEDGEMENTS
First and foremost, I would like to express my deepest gratitude to my supervisor, Prof. Michelle Adams for giving me a chance to be a member in her research team, her encouragement, academic guidance, and great support for all my undergraduate and graduate years, without her, I couldn't come to this point.
I would also like to thank Dr. Ayça Arslan-Ergül for giving me the opportunity to be part of her research and being a perfect role model with her guidance, supports, encouragements. I am grateful to her for everything she has taught me.
I would like to thank Prof. Fahriye Duygu Çetinkaya and Asst. Prof. Urartu Özgür Şafak Şeker for taking part in my thesis committee and their help.
I want to thank all current Adams Lab members for their help, guidance, and friendship. I would like to thanks Elif Karoğlu, Melek Tüz-Şaşik, Dilan Çelebi-Birand, Özge Burhan, Göksemin Şengül, Naz Mengi, Duygu Mutlu, and Duygu Macaroğlu. I want to special thanks to my friends, Naz Şerifoğlu, Begün Erbaba, and Bilge Aşkın for being more than a colleague, their supports, and makes life fun. I also need to special thanks to Hande Özge Aydoğan, for performing to count two of the antibodies in this study.
I wish to express my thanks to all, Eraslan family, Ardıç family, and Avcı family for their endless support, compassion, and love. Last but not least, I would especially thank my fiancée, Fırat. He was always there for me. Without him, it would be difficult to overcome this process.
I want to acknowledge the Scientific and Technological Research Council of Turkey (TUBITAK) with grant no 214S236 for financially supporting the optimization
of Immunohistochemistry protocol and with grant no 217Z118 for financially support me. European Molecular Biology Organization (EMBO) Installation Grant to Michelle M. Adams for financially supporting the experiments.
TABLE OF CONTENTS
ABSTRACT……….…ii
ÖZET ……….……….………iv
ACKNOWLEDGEMENTS ………vi
TABLE OF CONTENTS ... viii
LIST OF FIGURES.………..x
LIST OF TABLES……….xiii
CHAPTER 1 ... 1
INTRODUCTION ... 1
1.1 Age-related Cognitive Decline ... 1
1.1.1 Attention ... 1
1.1.2 Memory ... 2
1.1.3 Executive Functions ... 3
1.2 Age-related Biological Changes ... 3
1.2.1 Structural Changes ... 3
1.2.2 Neuronal Changes ... 4
1.3 Neuronal Lineage and Their Corresponding Markers ... 6
1.3.1 Markers for Neuronal Progenitors ... 6
1.3.2 Markers for Immature Neurons ... 7
1.3.3 Markers for Mature Neurons ... 8
1.4 Glia………..9
1.4.1 Microglia ... 9
1.4.2 Oligodendrocytes ... 9
1.4.3 Astrocytes ... 10
1.5 Age-Related Sexual Dimorphism ... 12
1.6 Zebrafish as a model organism ... 14
1.7 Aim of This Thesis Study ... 16
CHAPTER 2 ... 17 METHODS ... 17 2.1 Subjects ... 17 2.2 Euthanasia ... 17 2.3 Western Blot ... 18 2.3.1 Dissections ... 18
2.3.2 Protein Isolation from the Whole Brain of the Zebrafish ... 19
2.3.4 Sodium Dodecyl Sulfate–Polyacrylamide Gel Electrophoresis (SDS-
PAGE) ... 21
2.3.5 Preparation of Resolving and Stacking Gel ... 22
2.3.6 Preparing, Loading and Running of the Protein Samples ... 23
2.3.7 Transfer ... 25
2.3.8 Blocking and Primary & Secondary Antibody Incubation ... 26
2.3.9 Chemiluminescent Detection ... 29
2.3.10 Image Quantification ... 30
2.4 Immunohistochemistry ... 31
2.4.1 Optimization of the protocol ... 32
2.4.2 The optimized version of the Protocol ... 34
CHAPTER 3 ... 43
RESULTS ... 43
3.1 Western Blot Results ... 43
3.1.1 Progenitor marker, DCAMKL-1 ... 43
3.1.2 Immature Neuron Marker, HuC ... 45
3.1.3 Mature Neuron Marker, NeuN ... 46
3.1.4 Glial Marker, GFAP ... 48
3.2 Immunohistochemistry ... 49
3.2.1 Whole Brain Counting ... 50
3.2.2 Pallium and Optic Tectum Counting ... 54
CHAPTER 4 ... 59
CONCLUSION ... 59
CHAPTER 5 ... 64
DISCUSSION AND FUTURE PROSPECTS ... 64
LIST OF FIGURES
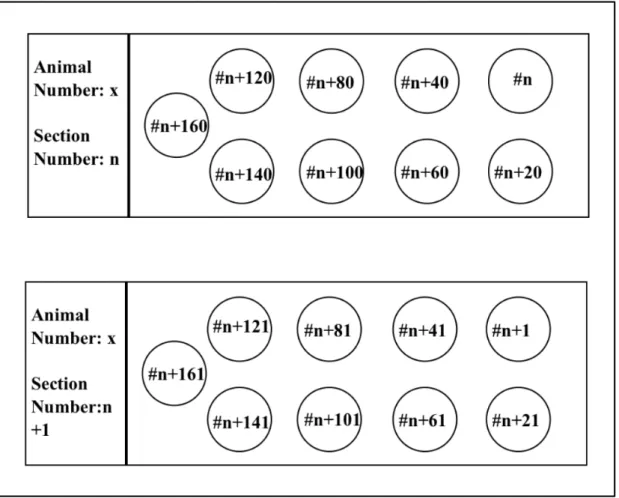
Figure 1.1 Representative image for comparison of neurogenic areas in mammalian brain and zebrafish brain. (Adapted from Kizil et al [27]) ... 5 Figure 1.2 Representative image for neural lineage and their corresponding markers in this study. Representative drawings show related cells in the top of the image. Rectangular blocks refer corresponding markers of them. ... 12 Figure 2.1 Representative image of slide design. ... 37 Figure 3.1 Representative gel image for DCAMKL-1 and each related groups were labelled above the bands. ... 44 Figure 3.2 DCAMKL-1 expression across gender and age groups; Within gel and Tubulin normalized data. Error bars show +SE, * symbol p<0.05. The graph shows age has impacts on DCAMKL-1 expression level within male groups. ... 44 Figure 3. 3 Representative gel image for HuC and each related groups were labelled above the bands. ... 45 Figure 3.4 HuC expression across gender and age groups; Within gel and Tubulin normalized data. Error bars show +SE, * symbol p<0.05. The graph shows age has impacts on HuC expression level especially in male groups. ... 46 Figure 3.5 Representative gel image for NeuN and each related groups were labelled above the bands. ... 47 Figure 3.6 NeuN expression across gender and age groups; Within gel and Tubulin normalized data. Error bars show +SE. ... 47 Figure 3.7 Representative gel image for GFAP and each related groups were labelled above the bands. ... 48
Figure 3.8 GFAP expression across gender and age groups; Within gel and Tubulin normalized data. Error bars show +SE, * symbol p<0.05. The graph shows age has impacts on HuC expression level especially in female groups. ... 49 Figure 3.9 DCAMKL-1 does not change with aging. A Graph for number of DCAMKL-1 positive cells per micron square in whole brain and indicated that no significant change in the number of DCAMKL-1 positive cells. B shows representative image of an area from DCAMKL-1 stained section and image was taken with using 20 x lens. ... 50 Figure 3.10 HuC positive cells in during aging. A age related changes in number of HuC positive cells per micron square in whole brain. Graph shows no significant changes between two age groups. B image was obtained from HuC antibody stained section, with using 20x lens. ... 51 Figure 3.11 NeuN positive cells during aging. A Graph refers age related changes of whole brain NeuN positive cell numbers division to per micron square. B Image was taken from NeuN stained section, with using 20x lens. ... 52 Figure 3.12 MAP-2 positive cells during aging. A Graph shows age related alteration of 2 positive cell numbers per micron square and B image refers a part of MAP-2 stained section which was taken with MAP-20x lens. ... 53 Figure 3.13 GFP tagged cells during aging. A Graph for whole brain area fraction of GFP positive signals change in aging and B representative image for GFP staining which was taken with 20x lens. ... 54 Figure 3.14 Age related changes in number of DCAMKL-1 positive cells per micron square in Pallium and Optic Tectum. ... 55 Figure 3.15 Age related changes in number of HuC positive cells per micron square in Pallium and Optic Tectum. ... 56
Figure 3.16 Age related changes in number of MAP-2 positive cells per micron square in Pallium and Optic Tectum. ... 57 Figure 3.17 Age related changes in Pallium and Optic Tectum area fraction in GFP positive cells per micron square. ... 58
LIST OF TABLES
Table 2. 1 Number of animals that were used for Western Blot experiments ... 18
Table 2.2 Number of animals that were used for Immunohistochemistry experiments ... 18
Table 2. 3 Recipe of RIPA buffer ... 19
Table 2. 4 Preperation of standards for Bradford Assay ... 21
Table 2. 5 Respresentative 96-well plate design for Bradford Assay ... 21
Table 2. 6 Recipe of 10 mL 10% Resolving Gel ... 22
Table 2. 7 Recipe of 5% Stacking Gel ... 23
Table 2. 8 Recipe of 2x Loading Buffer ... 24
Table 2. 9 Recipe of 10x Running Buffer ... 25
Table 2. 10 Recipe Transfer Buffer ... 26
Table 2. 11 Recipe of 10x Tris-Buffered Saline ... 28
Table 2. 12 Antibody information for Western Blot experiments ... 29
Table 2. 13 Recipe of 10x PBS ... 36
CHAPTER 1
INTRODUCTION
Aging is accepted as the inevitable time-dependent functional decline which is valid for most living organisms [1]. Many of the illnesses or disabilities can be cured or compensated with advanced medicine in our century. However, the aging brain has some unavoidable changes, and research for preventing or decelerating these changes still needs to be done. Brain functions, such as cognition, memory, and learning are reduced with aging which leads to impairment in quality of life.
On the other hand, life span is increasing year after year thanks to the advances in medicine and technology. Average life expectancy has doubled in the last 150 years in most parts of the world [2]. The population aged 65 years and older is predicted to reach 973 million by 2030 [3]. The increasing number of elderly individuals creates an increase in the prevalence of age-related neurodegenerative disorders and cognitive decline. Hence, understanding the underlying mechanisms of healthy aging is the initial step to be taken.
1.1 Age-related Cognitive Decline
Cognitive abilities can be categorized into many domains, which include attention, memory, and executive functions. Each of them represents quantifiable impairment with aging. Amount of decline in the tests also can be explained with increased response time, which depends on age-related decline in perceptional and processing speed [4].
1.1.1 Attention
Attention research reveals noticeable differences with aging. Older adults perform poor performance in complex attentional tasks, especially in divided attention
[5] [6] and selective attention [7] tasks compared with young adults. Divided attention task requires making multiple tasks simultaneously, and selected attention task depend upon ignore irrelevant information while focusing on specific information. On the other hand, the performance of simple attention tasks, like measuring sustained attention does not decline with aging. Instead, it shows improvements in adulthood and then maintains a steady level in aging [8].
1.1.2 Memory
Memory is the first cognitive function that comes to mind when the concept of aging is thought. Memory, as a complex structure, was divided into two main subtypes, short term, and long term [9]. Working memory can be added as the third. This division is based on capacity and memory processes that are involved. Differences between these three types are explained fully in the article by Cowan et al [10].
The four stages of memory formation are encoding, consolidation, storage, and recall/retrieval. Encoding is the first step of memory processing. Research indicates an age-related decline in the encoding part [11]. Memory consolidation is the process of stabilization of information after memory acquisition. The following step is storage and can be explained as transferring information to long term memory. Retrieval is recalling information which is encoded recently or previously. Impairments of retrieval are also observed more in older adults comparing to young ones [12].
Two main types of long term memory are declarative (explicit) and nondeclarative (implicit). Declarative memory is a conscious process while nondeclarative is unconscious and effortless. Declarative memory can be analyzed under two subdivisions. Semantic memory is based on factual information, concepts, or general knowledge, while episodic memory includes life experiences or specific
events. Research shows that semantic memory can be preserved during aging until age mid-80s [13]. However, episodic memory shows impairment with aging [14].
1.1.3 Executive Functions
Executive functions are collections of cognitive processes that are required for cognitive control of behaviors to reach the subject's goals. Executive functions include high function cognitive tasks like multitasking, decision making, and planning. All of them require to use more than one cognitive functions simultaneously. Age-related working memory or attention problems cause the decline of executive functioning performance in older ages [5].
1.2 Age-related Biological Changes
All these cognitive disabilities can be accepted as a result of some biological changes. Thus, comprehending biological mechanisms is crucial for getting to the bottom of cognitive decline in aging. Biological changes can be contextualized under two main headings; structural and neuronal.
1.2.1 Structural Changes
Age-related structural changes are observed in parallel with the cognitive changes. Advance in technology and medical science gives the opportunity of imaging structural changes with aging. Many brain structures show age-related alterations like cortical thinning [15], [16].
Grey matter changes can be analyzed with grey matter density in magnetic resonance imaging (MRI). Grey matter density refers to the proportion of voxels from grey matter versus other types of neural tissues. Grey matter density declines with aging as reported in the Sowell and her colleagues' study [17]. Also, age-related increase in white matter lesions, even during normal aging was reported in another MRI study by measuring white matter signal abnormalities [18], [19].
Hippocampus is one of the most studied structure and has a well-known relationship with aging. Hippocampus is accepted to have a role related to memory. Since, one of the most noticeable age-related changes is in the memory, study on the hippocampal alterations becomes crucial. Hippocampal atrophy with aging is mentioned in many studies [20], [21]. Specifically, after the age of 60, volume of the hippocampus shows dramatic decline [22].
1.2.2 Neuronal Changes
During the 70’s, it was believed that cortical neurons were lost between 35% and 55% in total from adulthood to old age. Later, researchers recognized that it was an artifact because of the shrinkage differences of old versus young brains during fixation, and that it caused neuronal density differences, not number differences. Recent studies also support insignificant or no loss of neuronal number during normal aging in the whole brain [23]. However, some specific neuron populations like in the hippocampus decline slightly while becoming elder. Understanding the neuronal changes requires a close inspection at the neuronal development and neurogenesis. 1.2.2.1 Neural development
In the general perspective, the nervous system develops in four stages. First, dividing progenitor cells give rise to neurons and glia. Second, these newborn neurons reach axons and dendrites in accordance with their aims. Then, they make synaptic connection with pertinent target cells for starting communication. Lastly, normal neuronal cell death provides to eliminate excessive neurons. Due to this elimination process, synaptic connections change with respect to the pattern of electrical and synaptic activity in the network [24]. After the development, maintenance of neurons and glial cells depend on two basic mechanisms; neurogenesis and gliogenesis.
1.2.2.2 Neurogenesis
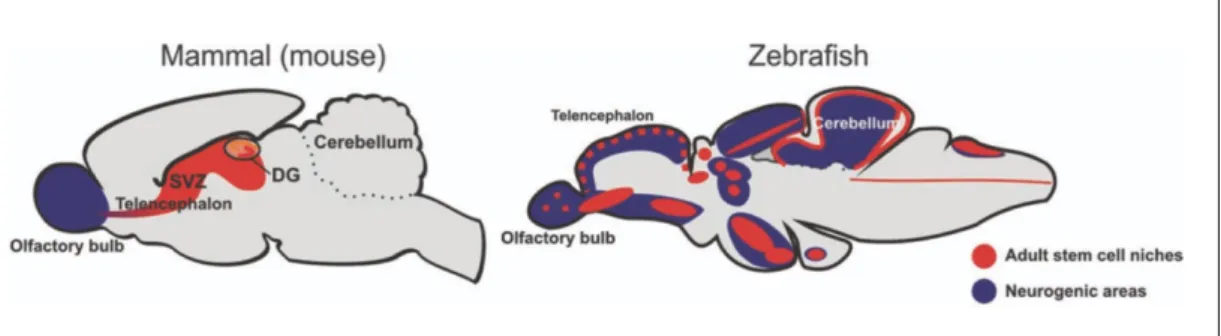
Neurogenesis can be explained as the process of forming new neurons in the nervous system. Neurogenesis starts in the embryonic phase when the sufficient number of neural stem cells has been reached and continue in the developmental process in all vertebrates. However, between different vertebrates, it shows differences in the continuity of growth capacity with aging and locational specificity. For instance, in the adult rodent brain limited amount of proliferation were reported in mainly two telencephalic, which are subgranular zone (SGZ) and subventricular zone (SVZ) [25]. Neurogenesis process is completed in these areas with different times in the mammalian brain; 28 days in SVZ and 42 days in SGZ [26].
On the other hand, zebrafish has lifelong cell proliferation in several zones. Figure 1, which was adapted from Kizil et al [27], shows neurogenic areas with stem cell environments from two different species. Neurogenesis is accepted as one of the most remarkable examples of adult neuroplasticity in most vertebrate species [28] and plays a crucial role on the maintenance of cognitive abilities [29],[30] in aging.
Figure 1.1 Representative image for comparison of neurogenic areas in mammalian brain and zebrafish brain. (Adapted from Kizil et al [27])
Liu and Song [31] describe the adult neurogenesis steps in their review article. In summary, Adult neurogenesis starts with quiescent neural stem cell maintenance and proliferation. After the activation of these stem cells, fate specification happens, and neural progenitors are created in there, and primitive nerve cells or namely,
neuroblasts are produced from them. Next, these proliferating nerve cells exit the cell cycle, and some of them survive as a subpopulation. Differentiation and survival of immature neurons start at this point. Thus, newborn neurons have been created and then, integrated into the existing brain circuit.
Regulation of adult neurogenesis is dependent on some molecular and environmental factors. Many molecular players have an impact on this regulation, like neurotransmitters [32] and growth factors [33]. Environmental factors also have various effects. For example, sleep deprivation causes decreased cell proliferation [34] or, running promotes increasing neurogenesis even in old age [35].
Understanding neuronal changes need to focus on neuronal lineage. Therefore, adult neurogenesis process can be detected by using different neuronal lineage markers, which has some subcategories like progenitor, early neuronal, or immature and mature neuronal markers.
1.3 Neuronal Lineage and Their Corresponding Markers 1.3.1 Markers for Neuronal Progenitors
Progenitor cells can be defined as the cells that have some capacity of differentiating into specific cell types. In previous studies, progenitor cells were considered in the stage between stem cells and mature cells. Researchers have accepted the progenitors and stem cells as two distinct cells by their features of them; progenitors being unipotent or oligopotent, whereas stem cells being multipotent [36]. However, recent understanding states that the progenitor cells are stem cells with limited differentiation ability without strict classification [37]. Progenitor cells may be accepted more specific type of stem cells with limited capacity of maintaining self-renewal while stem cells have unlimited maintaining capacity. Limited potency of progenitor cells makes them more narrow then the stem cells. Thus, progenitor cells
are divided into many different subtypes according to their purposes. Afterwards, differentiation of them to the post-mitotic immature neurons initiates the migration to final destination of these progenitor cells.
1.3.1.1 Doublecortin and Doublecortin-like Kinase-1
Doublecortin (DCX) is a microtubule-associated protein and one of the most commonly used neural progenitor marker in mammalian species [26]. DCX is expressed during the development of neuroblasts and also a marker of migrating neuroblasts [38]. Doublecortin-like kinase-1 (DCAMKL-1) have 80% amino acid similarity with doublecortin protein and additionally DCAMKL-1 can play a similar role with Microtubule-associated proteins (MAPs) [39]. Lin and his colleagues indicated that the expression pattern of DCAMKL-1 is overlapping with DCX [40]. Their study also showed that the DCAMKL-1 with DCX in other species can be substituted. Moreover, the homology of DCAMKL-1 and DCX is proven some older studies [41], [42]. Another more recent study also indicated that DCAMKL-1 can be used instead of DCX in zebrafish model organisms [43].
1.3.2 Markers for Immature Neurons
Immature neurons are created from neuroblasts, which are derived from different types of neuronal progenitors. They lost the dividing ability and will have to migrate to the final destination to transform mature neurons. Thus, differentiation occurs in this phase.
1.3.2.1 Elav like neuron-specific RNA binding protein 3
Elav like neuron-specific RNA binding protein 3 (HuC) is expressed in all neurons immediately after the birth. Thus, it is commonly used for marking immature neurons in mammalians and teleost species. HuC is a counterpart of drosophila Elav
like neuron-specific RNA binding protein 3 in vertebrates [44], [45]. HuC plays a role in neuronal differentiation and determination of fate with other Hu proteins [46]. 1.3.3 Markers for Mature Neurons
Mature neurons are already differentiated and lost the ability of dividing. The function of mature neurons can be explained as taking part in all information steps, which include receiving, processing, and transferring all over the information in nervous systems.
1.3.3.1 Neuronal Nuclear Antigen
Neuronal nuclear antigen (NeuN) is the most frequently used mature neuron marker in all vertebrates. It is expressed in almost all postmitotic neurons while it is absent outside the nervous system. However, it shows rare exceptions also in some neural cell types. Expression in Purkinje cells, photoreceptor cells, and mitral cells were mentioned as negative when it was explored in the early nineties [47]. Moreover, recent studies indicated that there is no expression in the substantia nigra, especially in dopaminergic neurons [48], [49]. On the other hand, using NeuN as differentiated mature neuron marker is advantageous with specificity on only mature neurons, and association with cell nucleus rather than cytoplasm which means that NeuN detection can be easily quantified [50].
1.3.3.2 Microtubule-Associated Protein -2
Microtubule-Associated Protein -2 (MAP2) is one of the major members of the microtubule-associated protein group. They are expressed in all vertebrates and used as a mature neuron marker. MAP2 stabilizes soma and microtubules in the dendrites of mature neurons while playing a role in dendrite generation [51]. Another function of MAP2 is being the scaffolding protein in the nervous system [52]. It also plays a
role in synaptic plasticity due to its function in the dendrite formation [53]. Sanchez
et al. were explained MAP2 function in their well-documented review article [54].
1.4 Glia
Glia can be defined as nonneuronal cells in central nervous systems (CNS) and play a role as a supporter of neurons in many ways. Gliogenesis occurs in a similar way to neurogenesis. Glial cells have three main types in the CNS, which are microglia, oligodendrocytes, and astrocytes.
1.4.1 Microglia
Microglia amounts to almost 10% of the central nervous system [55] and takes role in many mechanisms like hemostasis and development. The main contribution of microglia to CNS is immunity. Neuroinflammatory responses are mediated by microglia in there. Microglia also plays a crucial role in some synaptic mechanisms like synaptic pruning which is an essential step in development of the nervous system and continues with aging [56], and synaptic plasticity [57] which can be explained as alteration of synapse strength between two neurons and play role on learning and memory [58]. Age-related changes like decreasing arborized area of microglial cells are observed, especially in pathological aging [59]. However, more studies will be needed to clarify whether microglia are responsible for neurodegeneration with aging or whether aged neurons itself are more apt to degenerative cues [60]. Recently published review paper of Butovsky and Weiner explained the role of microglia in health and disease thoroughly [61].
1.4.2 Oligodendrocytes
Oligodendrocytes are the dominant glial cells in white matter [55]. They play a vital role in the formation of the myelin sheath around the axons in the nervous system. Myelin sheath has a unique composition with rich content of lipids, and low
water content, and this composition allows the electrical insulation of axons. Segmental structure of myelin sheaths is responsible for saltatory conduction of nerve impulses. Myelin sheaths provide fast conduction enable, accurate signal in long distance and space economy [62]. Myelin sheaths in CNS are mostly located in white matter. Age-related changes of oligodendrocytes are observed in white matter. Studies indicated that degeneration of oligodendrocytes and their progenitor cells cause an increase in myelin breakdown. Naturally, it causes decrease in remyelination and inevitable distortion of white matter integrity during aging [63], [64]. Another essential role of oligodendrocytes is to secrete some neurotrophins and create local trophic support for neurons [65]. Lee and colleagues reported that abnormality of oligodendrocytes leads to axonal degeneration [66], which is observed in normal and pathological aging [67].
1.4.3 Astrocytes
Astrocytes are one of the best studied glial cells in CNS. Astrocytes create approximately 20% to 40% of total brain cells of the mammalian brain [68]. They have crucial functions to maintain many mechanisms in CNS such as, structural formation, metabolic support, and synaptic regulation. Astrocytes also have significant interactions with other CNS glial cells. They promote blood flow and oxygenation locally by contributing neurotransmitter release. Their end foot processes wrap blood vessels and control vessel diameter by playing the role of potassium ions release and hyperpolarization of smooth muscle cells [69]. Also, they play a role in the energy metabolism of the brain by taking up glucose from the blood and converting it to lactate. Then, released lactate, provides local energy for neurons [70], [71]. Another function of astrocytes is the homeostasis of some ions like potassium, chloride, sodium, and hydrogen [72], [73]. For example, controlling ion and water homeostasis
through an astrocytic water channel (aquaporin-4), which eventually affects on brain plasticity [74] and volume [75].
Astrocytes are also one of the key glial cells for synaptic formation, elimination and, as a result of these, plasticity. Ullian and his colleagues have used highly purified cultures of retinal ganglion cells by adding astrocyte conditioned medium to show the role of astrocytes on synapse formation and observed that astrocytes induced the development of vast numbers of synapses [76]. Besides, astrocytes contribute activity-dependent synapse elimination via Multiple epidermal growth factor like domains protein 10 (MEGF10) and c-mer proto-oncogene tyrosine kinase (MERTK) pathways in developing and adult CNS [77]. Astrocytes have a relationship with other types of glial cells in CNS. Their relationship manifests impacts with aging. Liddelow and his colleagues showed that astrocyte activation is highly correlated with released reactive microglia and also, the same study indicated that astrocytes produce some neurotoxic factors which may damage neurons and oligodendrocytes even in the normal aging [78].
1.4.3.1 Glial Fibrillary Acidic Protein
Glial fibrillary acidic protein (GFAP) is a member of intermediate filament proteins and expressed in some cell types which include mainly astrocytes in CNS. GFAP is a major component of astrocyte cytoskeleton. Thus, it is one of the widely used markers for astrocyte determination [79]. GFAP shows high expression in amyloid plaques in Alzheimer disease, and many studies indicated that this high expression depends on the reactive astrocytes [80],[81],[82]. Moreover, GFAP and intermediate filament system of astrocyte are accepted to be highly correlated with many other CNS diseases [83]. Nowadays, GFAP transgenic model organisms are
frequently used for these reasons [84], [85]. Also, GFAP plays a role as a neuronal progenitor marker because of the expression in early radial glia. They are accepted as a member of type 1 hippocampal progenitors [86], [26]. They have a function on neuroblasts and neurons for giving rise [87].
1.5 Age-Related Sexual Dimorphism
Gender differences are became apparent with aging at the some areas like behavioral, structural, and in the molecular level. Behavioral changes are demonstrated differently in the ability level; males show better results than females in motor and spatial abilities while females are better at memory and social cognition tasks than males. Functional MRI and other imaging techniques were used to find the reason Figure 1.2 Representative image for neural lineage and their corresponding markers in this study. Representative drawings show related cells in the top of the image. Rectangular blocks refer corresponding markers of them.
behind these differences in many studies. However, more research is required to find the relationship between aging and sexual dimorphism.
A recent study indicated sexual dimorphism in human brains based on blood flow by using single photon emission computed tomography while participants perform the task while they are in resting state. Amen et al. found that females have more activation in the prefrontal cortex and limbic areas compared to males, whereas males have more active visual and coordination center then females [88].
Changes in the structural and molecular level changes can be accepted as the underlying reason for cognitive alterations with gender. Goldstein and his colleagues showed sexual dimorphism in cortical and subcortical level. Their study mentioned sexual dimorphism in cortical volumes. In detail, females have a larger amount in frontal and medial paralimbic cortices while males have larger volumes in frontomedial cortex, amygdala, and hypothalamus. This comparison was based on relativity on cerebrum size in their study [89]. Also, studies were indicated that males have a higher volume of white matter than females [90].
In the neuronal level, the impact of gender differences can be observed in many areas. In the mammalian brain, adult neurogenesis shows gender differences in dentate gyrus as that female animals display higher newborn neurons [91]. These differences can be explained at the level of sex hormones. In a general perspective, Estrogen provides more proliferation advantage while androgens are increasing the survival of neurons. Mahmoud et al. describe impact of sex hormones on neurogenesis in the well-documented review article in detail [92].
1.6 Zebrafish as a model organism
Zebrafish (Danio rerio) is one of the most popular model organism in developmental and biological studies. Zebrafish provides many advantages. First of all, zebrafish genome shows significant similarity with human genome. Zebrafish genome has at least one orthologue for the 70% of human genes [93]. Also, zebrafish has a high fertility rate; one pair of zebrafish produce hundreds of embryos with weekly intervals. Maintenance of zebrafish is easier and cheaper than many model organisms. Also, this species has transparent embryos, which provide easy manipulation and observation of development. These advantages made zebrafish famous for a wide variety of disease research [94]. In addition to these advantages, adult zebrafish have an integrated a nervous system like mammals. Having an integrated nervous system ensures a homologous brain and structure with human.
Zebrafish brain development shows some similarities with mammalian brain development. Consequently, zebrafish and human brain have morphological similarities. On the other hand, telencephalon and optic tectum development show differences starting with the embryonic stage [95], [96].
The telencephalon follows eversion way to reach out dorsally in the embryonic stage. This process made it difficult to find homologs of telencephalic regions like hippocampus in mammalian brain in previous researche. However, currently, we have detailed information the accurate location and homologs of the telencephalic regions in the zebrafish brain. The zebrafish telencephalon can be divided into two parts; pallium, which is the dorsal part, and sub-pallium, which is the ventral part [97]. In the mammalian brain, researchers consider hippocampus, amygdala, and basal ganglia as main structures of the telencephalon. In the zebrafish, subdivisions of pallium represent these areas [98]–[100].
Optic tectum is one of the other apparent regions which has a developmental difference in locationally. Teleost species have a dominant structure of optic tectum in the mesencephalon. Zebrafish, as one of the teleost species, also shows this dominance. Optic tectum can be accepted as a visual center in zebrafish brain like other teleost and corresponds to the superior colliculus in human midbrain. Optic tectum is one of the vital processing areas of sensory information with the advantage of having connections with diverse other regions. Acquired visual information is integrated with motor information for generating suitable behavioral responses in the optic tectum. Optic tectum is formed by six different layers; stratum marginale, stratum opticum, stratum fibrosem et griseum superficiale, stratum griseum centrale, stratum album centrale, and periventricular zone [101]. The periventricular zone is a significant region for having most of the neurons of optic tectum. Studies indicated that the periventricular zone has identifiable cell proliferation in adult zebrafish [102]. Optic tectum plays a significant role to prove that proliferating cells continue in to the rostrocaudal axis of zebrafish in aging as well [102], [103].
The life span of zebrafish can be exceeded up to 5 years in the laboratory conditions, which is much longer than other common model organisms [104]. Also, age-related alterations similar with humans can be observable in zebrafish [105]. Age-related cognitive decline is one of the parallelism with humans. Many different cognitive performance tasks can be applied to zebrafish [106]. Zebrafish shows parallel performances in this cognitive function tasks with humans like the decline of spatial memory and learning performances with aging [107]. Biological changes are also observing as an underlying mechanism of gradual cognitive decline. Oxidative stress [108], decreased neurogenesis [109], and shortened telomeres[110] are some of
these age-related biological changes. In light of this information, zebrafish can be accepted as a useful model organism for gerontological studies.
1.7 Aim of This Thesis Study
Brain aging is marked by a decline in cognitive abilities, which includes attention, memory, and executive functions. First, understanding changes in healthy aging is crucial for identifying proper interventions to age-related neurological disorders. Previous studies claimed that there was a correlation between cognitive capacities and number of neurons. On the other hand, recent studies showed that neuron number is not decreased with aging in most of the species which is contradictory of the old belief. Thus, further research needs to focus on underlying mechanisms of neuron numbers or the other possible players. For this aim, this research was focused on neural lineage and glial changes during aging with using zebrafish (Danio rerio) model organism. Protein levels, distributions, and locations of target markers, which are neural progenitor, immature and mature neuron, and astrocyte were detected with using Immunohistochemistry and Western-blot techniques. The immunohistochemistry experiments were focused on two specific proliferation areas which are the Pallium and Optic Tectum, and also whole brain measurements, and were made for comparing with protein levels. Western-blot techniques were applied to the whole brain because the sizes of the target areas are not suitable for extracting protein individually and pooling them has the potential to lose biological differences.
CHAPTER 2
METHODS
In this study, two different methods, Western Blot and Immunohistochemistry were used to show the intensity and morphological location of selected proteins. 2.1 Subjects
All fish were maintained in the Bilkent University Molecular Biology and Genetics Department Zebrafish Facility. The facility is using a standard system which built by ZebTec Zebrafish Housing System (Tecniplast, Italy). The system keeps the temperature of water at 28 °C and maintains the pH between 7.0-7.5. Water quality was checked with readings of the mechanical and carbon filters every day. Animals were maintained either in 3.5 L or 8L tanks with a 14-h light:10-h dark cycle. Fish were fed dry flakes (twice times) and fresh artemia (once time) every day. All the animals in this part come from the TgBAC (gfap-GFP) zf167 transgenic line, which was obtained from the European Zebrafish Resource Center and was fed and maintained by us.
Bilkent University Local Animal Ethics Committee (HADYEK) approved the animal ethics protocols of this study with approval dates & numbers: July 10, 2015, & 2015/31 and February 21, 2018, & 2018/4. Animal distributions are illustrated in the Table 1 and Table 2 for western blot experiments and immunohistochemistry experiments respectively. Young animals were 7 to 9 months old. Old animals were 33 to 42 months old.
2.2 Euthanasia
Ice-water was used to euthanise all the animals. The small plexiglass holding the tank was filled with system water up to half, and ice was added until the
temperature was between 4-7°C. Fish were transferred to the tank and remained there until no gill movements were observed.
Table 2. 1 Number of animals that were used for Western Blot experiments
WB Female Male
Old 7 9
Young 9 7
Table 2.2 Number of animals that were used for Immunohistochemistry experiments IHC Whole brain Area specific
Old 2 4
Young 2 4
2.3 Western Blot 2.3.1 Dissections
Heads were decapitated from the body with scalpel blade after euthanasia. The crown was placed as dorsal side downwards under the stereomicroscope. Gills were removed and taken aside. Other connective tissues were removed until reaching the skull and the optic chiasm, is exposed. Connectivity of optic chiasm between one of the eyes was cut off. Then, the eyes were removed and transferred into another plate. Skull was cracked open carefully, and the brain was checked from the ventral side whether it is intact or not. Then, it was extracted carefully and checked again for the presence of all brain structures. After the extracting brain, gills, eyes, and brain were put into 1.5 ml eppendorf tubes, weighed quickly, and snap frozen immediately. Snap freezing made by using liquid nitrogen to avoid further degradation. Gender determinations were made by opening peritoneal cavity and by observing the presence
of eggs or testis. After gender determination, bodies were also snap frozen, and all samples were stored -80°C until the protein isolation.
2.3.2 Protein Isolation from the Whole Brain of the Zebrafish
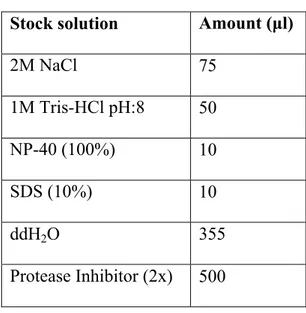
Radioimmunoprecipitation assay (RIPA) buffer [50-mM Tris-HCl, pH 8.0, containing 150mM NaCl, 1% NP-40, and 0.1% SDS and protease inhibitor (2× stock, catalog number: 05 892 970 001, Roche)] was prepared according to Table 3 as lysis buffer to lysate target proteins in the whole cell. Tissues were taken from -80°C and put into previously prepared RIPA buffer according to weight of the tissue. Approximately 60 μl buffer was added for each 1 mg of tissue.
Table 2. 3 Recipe of RIPA buffer Stock solution Amount (μl)
2M NaCl 75 1M Tris-HCl pH:8 50 NP-40 (100%) 10 SDS (10%) 10 ddH2O 355 Protease Inhibitor (2x) 500
Tissues, which were immersed in RIPA buffer, were homogenized with a 25-gauge, 2mL syringe by pawing through 10 times in the 1,5 ml eppendorf tubes on ice. Homogenates were incubated on ice for 30 minutes, mixing every 10 minutes gently. At the end of the 30 minutes, homogenates were centrifuged at 13,000 rpm for 20 minutes at 4oC. Supernatants were collected, aliquoted, and stored at -80oC until the measurement of soluble protein concentration with Bradford Assay.
2.3.3 Bradford Assay
The concentration of soluble proteins was determined by using 96 well plate in Bradford assay. First of all, ddH2O, standards, and samples were loaded in order.
Blanks include only ddH2O. Standards included bovine serum albumin (BSA, Catalog
Number: A7906, Sigma-Aldrich, St. Louis, MO, USA) ranging from 2-20 μg/ml and ddH2O. Detailed information of standards is given in Table 2.4. Samples include 0.5
μl isolated proteins and 4.5 μl ddH2O. All measurements were done in duplicates.
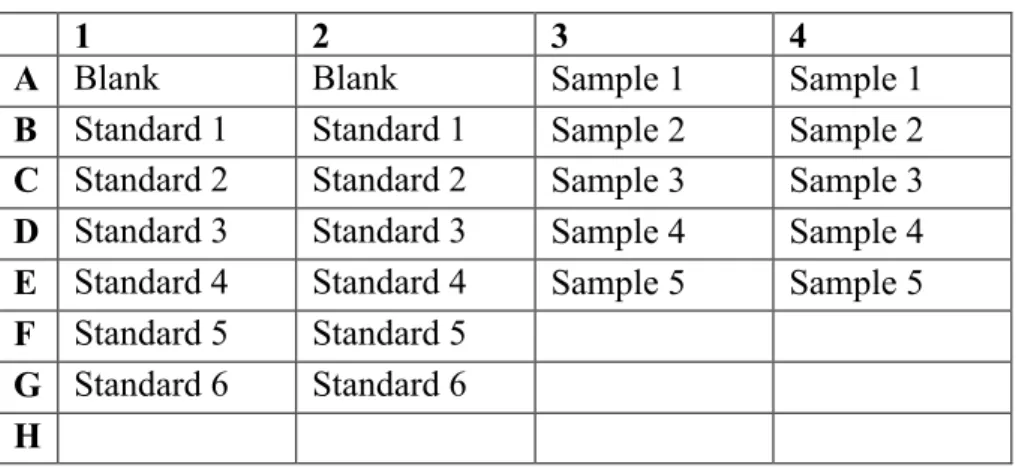
Representative plate template can be seen in Table 2.5. The total volume of each well was 5 μl after adding ddH2O, BSA standards, and protein samples. 250 μl of Bradford
Reagent (B6916, Sigma, St. Louis, MO, USA) was added into each well. A 96-well plate was mixed on an orbital plate shaker at 300 rpm at room temperature for 2 minutes. Aims of the step are mixing them completely while minimizing possible air-bubbles from loading part. After shaking, the plate was incubated in room temperature for an extra 10 minutes without any agitation. Air-bubbles were checked one more time, and if wells have them, they were popped by using sterile syringe tip because each of them has the potential to impact the absorbance values of the samples. Measurement of absorbance values was made with using a multi-plate reader (SpectraMax M5, Molecular Devices, Sunnyvale, CA, USA) at 595 nm. Blank wells assignment were made before starting measurement for subtracting from absorbance values of each other wells which filled with standards and samples. Net absorbance of the standards and concentrations of them were used to calculate the concentration of protein samples by plotting and applying a linear curve fit on these data points and reaching the standard curve.
Table 2. 4 Preperation of standards for Bradford Assay ddH2O (μl) BSA (μl) (1mg/1ml stock) Final Conc. (μg/μl) Blank 5 0 0 Standard 1 4.5 0.5 0.1 Standard 2 4 1 0.2 Standard 3 3 2 0.4 Standard 4 2 3 0.6 Standard 5 1 4 0.8 Standard 6 0 5 1
Table 2. 5 Respresentative 96-well plate design for Bradford Assay
1 2 3 4
A Blank Blank Sample 1 Sample 1
B Standard 1 Standard 1 Sample 2 Sample 2 C Standard 2 Standard 2 Sample 3 Sample 3 D Standard 3 Standard 3 Sample 4 Sample 4 E Standard 4 Standard 4 Sample 5 Sample 5 F Standard 5 Standard 5
G Standard 6 Standard 6 H
2.3.4 Sodium Dodecyl Sulfate–Polyacrylamide Gel Electrophoresis (SDS- PAGE)
SDS-PAGE was used to separate proteins according to their sizes. Two types of SDS-PAGE gel were used for this aim; 10% resolving (pH 8.8) with high acrylamide content and 5% stacking (pH 6.8) which is composed of low acrylamide proportion.
2.3.5 Preparation of Resolving and Stacking Gel
Two different sized glass plates, one of them has an integrated spacer of 1.5 mm (Biorad Life Science 1000 Alfred Nobel Drive Hercules, California 94547 USA) and one 1.5 mm thick comb with 15 well or 10 wells (Biorad Life Science 1000 Alfred Nobel Drive Hercules, California 94547 USA) were used to prepare for each gel. Glass plates were attached to each other and placed in to casting stand.
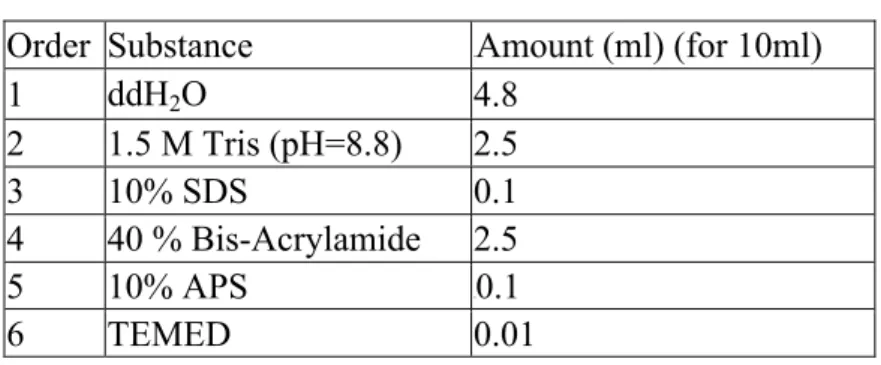
A 10% resolving gel was made according to the order given in Table 2.6. After adding last reagent, the gel was mixed well gently and poured quickly between the glass plates with pasteur pipette. 2-propanol was added immediately to eliminate the air bubbles in the resolving gel. After the polymerization was observed, 2-propanol was washed out, and the surface of the resolving gel was rinsed with ddH2O and blotted
with whatman papers.
Table 2. 6 Recipe of 10 mL 10% Resolving Gel Order Substance Amount (ml) (for 10ml)
1 ddH2O 4.8 2 1.5 M Tris (pH=8.8) 2.5 3 10% SDS 0.1 4 40 % Bis-Acrylamide 2.5 5 10% APS 0.1 6 TEMED 0.01
A 5% stacking gel was prepared by using the reagents in the Table 2.7 and adding them according to the given order in Table 2.7. Substances were mixed slowly and poured by using Pasteur pipette above the polymerized resolving gel, and the related comb was placed on it. After polymerization occurred, the gel was located in to the tank with a holding apparatus for loading and running steps.
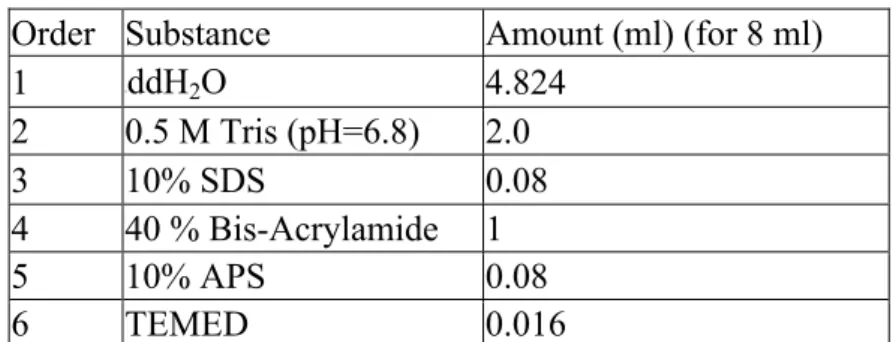
Table 2. 7 Recipe of 5% Stacking Gel Order Substance Amount (ml) (for 8 ml)
1 ddH2O 4.824 2 0.5 M Tris (pH=6.8) 2.0 3 10% SDS 0.08 4 40 % Bis-Acrylamide 1 5 10% APS 0.08 6 TEMED 0.016 2.3.5.1 Solutions
1.Resolving Buffer (1.5 M Tris-HCl, pH 8.8):
18.171 g of Tris Base (FW:121.14) was dissolved in 50 ml of ddH2O. Then,
pH was adjusted to 8.8 with HCl then filled with ddH2O up to 100 ml.
2. Stacking Buffer (0.5 M Tris-HCl, pH 6.8):
6 g Tris Base (FW:121.14) was dissolved in 60 ml ddH2O. Then, pH was
adjusted to 6.8 with HCl then the volume was adjusted as 100ml with adding ddH2O.
3. Sodium Dodecyl Sulfate SDS (10%):
10 g lauryl sulfate was dissolved in 90 ml ddH2O dissolve, brought to 100 ml.
SDS is a powerful irritant, so it was handled in toxic hood.
4. Ammonium per sulfate APS: (10%):
30 mg ammonium per sulfate was dissolved in 300 μl sddH2O.
2.3.6 Preparing, Loading and Running of the Protein Samples
Samples were diluted according to the concentration required for the antibody to function properly and Bradford Quantification assay values in the loading buffer in
the related size Eppendorf tubes. Samples were incubated at 95oC for 10 minutes. Then, they were quick spinned and put on ice until loading the SDS- PAGE gels.
Gels of 1.5 mm thickness were cast and run in Mini-PROTEAN Tetra Cell Electrophoresis system (BioRad, CA, USA). Glasses were placed on cassette which was located into the tank. The tank was loaded with 1 x Running buffer up to 2 gel-level. The comb was removed from the stacking gel carefully, and wells were washed with 1 x Running buffer. Samples and prestained protein ladder was loaded into the wells with fine pipette tips avoiding any air-bubbles into the wells. Thermo Scientific PageRuler Prestained Protein Ladder (2x250 μL 10 to 250 kDa- with product number 26619) was used for determining the molecular weights of samples and target proteins in each gel. The tank was connected to power supply (BioRad, CA, USA) and gels were started to run at 90 V in room temperature for 30 minutes. After samples reached to resolving gel level, the running voltage was altered to 120 and continued to run until the adequate separation was observed. Average running time was 120 minutes.
2.3.6.1 Solutions:
1. 2x Loading Buffer:
Loading buffer was prepared according to the Table 2.8, and 10% DTT was added freshly before each time.
Table 2. 8 Recipe of 2x Loading Buffer Stock Solution Amount (ml)
10% SDS 4
20% Glycerol 2
4% BPB 0.1
2. 10x Running Buffer:
Table 2.9 shows the materials for 10x Running buffer and before adding the related amount of water pH adjusted to 8.3. Before starting to each experiment, 1x Running buffer prepared by dilution from 10 x Running buffer.
Table 2. 9 Recipe of 10x Running Buffer Materials Amount (For 1L) 250 mM Tris 30.285 g
1.9 M Glycine 144.134 g 10% SDS 100 ml ddH2O Up to 1 L
2.3.7 Transfer
After the running end, gels were removed from electrophoresis chamber. Glass holders were separated from each other, and stacking gels were removed from resolving gel. Then, resolving gels were put into the 4oC transfer buffer to equilibrate. Transfer step relays on the transferring the proteins in the gel to the membrane by using electric field. PVDF membrane (Immubilon-P Transfer Membrane MD Millipore, Billerico, MA, USA), and whatman filter papers were cut according to related dimensions. Membranes were cut as being the same size as gel which is 6 x 9 cm and whatman filter papers size arranged according to sponge supplied with system kit, which is 8 x 10 cm. PVDF membrane was rinsed in 100% methanol (MeOH) for 45 seconds and incubated in 4oC transfer buffer for 5 minutes. All other material of transfer system, which are 2 sponges, and 4 whatman filter papers for each gel were soaked in the 4oC transfer buffer. Transfer sandwich was prepared in the following order: First, Mini Trans-blot Electrophoretic Transfer Cell module (BioRad, CA, USA) located to the black surface of the plastic holder at the bottom, and one sponge
was located on it. Then, 2 pieces of whatman filter paper were placed on it, and SDS-PAGE gel put on their center. PVDF membrane was located as covering gel completely. Two whatman filter papers put and air bubbles were removed with rolling 15 ml falcon. Finally, the sponge was positioned into them, and the sandwich module closed. In each of the steps, transfer buffer was added to avoid drying. Closed Plastic holder located in to transfer cassette with checking the color codes for detecting electrode sides to allow segregated proteins transfer from SDS-PAGE gel to PVDF membrane. The power supply was changed to 100V for 90 minutes, and the transfer was performed in cold room to eliminate increasing the current milliampere.
2.3.7.1 Solution
1. Transfer Buffer:
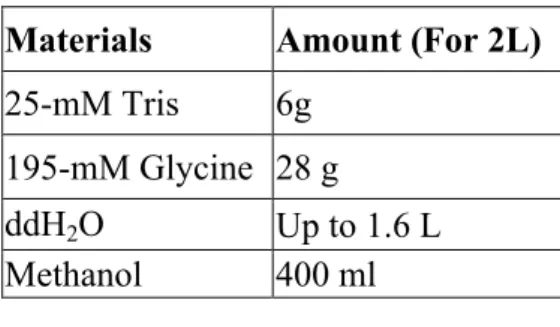
Transfer buffer was prepared with using materials with related amounts in the table 2.10 before adding the methanol, Tris, and glycine were dissolved in water. After preparation, the buffer was stored in 4 oC.
Table 2. 10 Recipe Transfer Buffer Materials Amount (For 2L) 25-mM Tris 6g
195-mM Glycine 28 g
ddH2O Up to 1.6 L
Methanol 400 ml
2.3.8 Blocking and Primary & Secondary Antibody Incubation
After the transfer finished, the plastic holder was opened, and PVDF membranes were taken and put into one-hour blocking buffer incubation at room temperature on a shaker. Blocking buffer was prepared according to information from
optimization experiments of selected antibodies. Blocking buffers were prepared in Tris Buffered Saline with Tween 20 (TBS-Tween) buffer with non-fat milk powder or bovine serum albumin (BSA) (Sigma-Aldrich, St. Louis, MO, USA). Blockings were made for 1 hour in room temperature with gentle agitation. After the 1 hour, primary antibody incubations were made. For western blot part, five different primary antibodies were used. Anti-NeuN (Abcam, Cambridge, UK: ab177487, 1:2000 dilution), HuC (Abcam, Cambridge, UK: ab78467, 1:500 dilution), anti-DCAMKL-1 (Abcam, Cambridge, UK: ab109029, 1:1000 dilution), anti-GFAP (Abcam, Cambridge, UK: ab53554, 1:1000 dilution) and anti-β tubulin (Cell Signaling Technology, Danvers, AM, USA: #2146, 1:5000 dilution) were primary antibodies in this study. Anti-β tubulin was used as an equal loading control. Anti-NeuN and GFAP antibodies were prepared in block solution: %5 BSA while the others, anti-HuC, anti-DCAMKL-1, and Anti-β tubulin were preparing in the block solution: 5% non-fat milk powder. Recipes of blocking solutions were given in the following solutions part. Primary antibody incubations were made in cold room for 17 hours with a rocking motion.
Membranes were taken out from the cold room. Primary antibodies were collected and stored at -20 oC for reusing. Membranes were washed with TBS-Tween for five times at room temperature with a rocking motion. Duration of washings were 5, 5, 10, 5, 5 minutes for Anti-Huc, anti-DCAMKL-1, anti-GFAP, and Anti-β tubulin. However, for anti-NeuN, extra two washings 10 and 5 minutes were added to reach clear band images with minimizing nonspecific boundings.
After the washings, horseradish peroxidase (HRP) conjugated secondary antibody selected and prepared related to primary bodies raised species and blocking
solution preferences. DCAMKL-1, HuC, anti- NeuN and Anti-β tubulin were raised in rabbit. Anti-rabbit-HRP (Cell Signaling Technology, Danvers, AM, USA: #7074, 1:5000 dilution) was used as a secondary antibody for those primary antibodies. Anti-goat- HRP (abcam, Cambridge, UK: ab97100, 1:10000 dilution) was used as a secondary antibody for anti-GFAP. Secondary antibodies for NeuN and GFAP were prepared in Blocking Solution: 5% BSA while the others prepared in Blocking Solution: 5% non-fat milk powder. Secondary antibody incubations were done on the shaker for 1 hour at room temperature.
After, secondary antibody incubation over, seven washings for NeuN and five washings for others were made with using TBS-Tween at room temperature on shaker like washings after the primary antibody incubation.
2.3.8.1 Solutions
1. 10 X Tris-Buffered Saline:
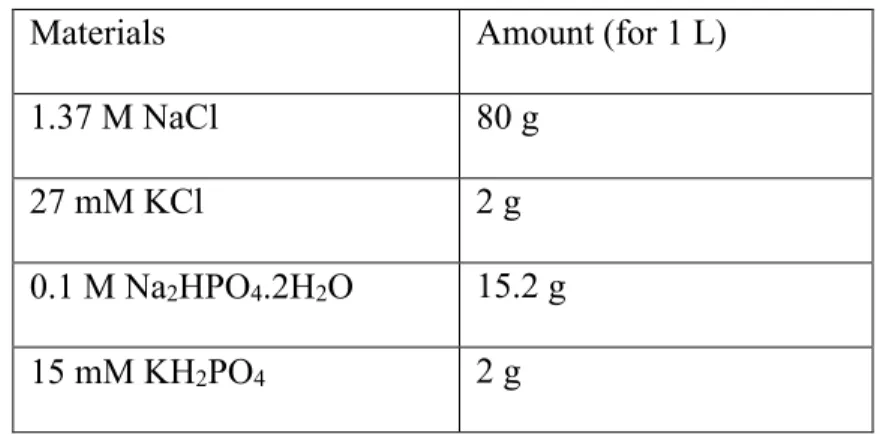
10 x TBS buffer was prepared according to table 2.11. Volume was completed to 1L after the pH was adjusted to 7.6 with 1 N HCl/ NaOH.
Table 2. 11 Recipe of 10x Tris-Buffered Saline Materials Amount (For 1L) 100 mM Tris 12 g
1.5 M NaCl 88 g ddH2O Up to 1L
2. Tris-Buffered Saline and Tween 20 (TBS-Tween): 3 mL of Tween-20 was added to 1 L of 1X TBS.
3. Blocking Solution: 5% Non-Fat Milk powder (Stock)
2.5 g milk powder was dissolved in the TBS-tween as final volume became 50 ml via using vortex.
4. Blocking Solution: 5% BSA (Stock)
2.5 g BSA was dissolved in the TBS-Tween as final volume became 50 ml via using vortex.
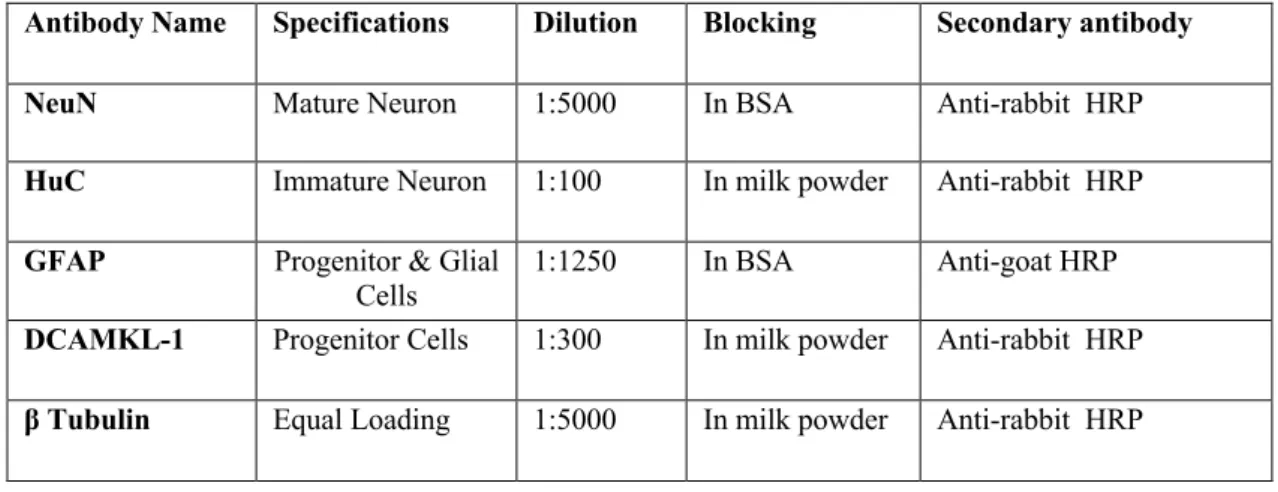
Table 2. 12 Antibody information for Western Blot experiments
Antibody Name Specifications Dilution Blocking Secondary antibody
NeuN Mature Neuron 1:5000 In BSA Anti-rabbit HRP
HuC Immature Neuron 1:100 In milk powder Anti-rabbit HRP
GFAP Progenitor & Glial
Cells 1:1250 In BSA Anti-goat HRP
DCAMKL-1 Progenitor Cells 1:300 In milk powder Anti-rabbit HRP
β Tubulin Equal Loading 1:5000 In milk powder Anti-rabbit HRP
2.3.9 Chemiluminescent Detection
Chemiluminescent detection was made using Supersignal West Femto Maximum Sensitivity Substrate (Thermoscientific, Rockford, IL, USA: 34095). This kit includes two components, which are Luminol/Enhancer solution and Stable peroxide solution. Solutions were mixed with equal amounts (1:1 ratio), and then membranes were put on a clean surface. Bands of interests which determined according to marker were covered with mixed buffer. 5 minutes of incubation was made in the dark chamber. ChemiDocTM XRS+ imaging system (Biorad, CA, USA) with the ImageLab software (Biorad, CA, USA) was used for imaging.
2.3.10 Image Quantification
All images which were exported from ImageLab software were quantified with ImageJ software (NIH, Bethesda, MD, USA). First, images were converted to 8-bit from the RGB scale. The interested bands from each sample were selected separately with the rectangular selection tool. Each band area were selected to be the same sized rectangular. After the selection of each line of the cohort was done, selected areas were plotted. The space between the two peaks was drawn and chosen to be measured. An independent researcher, Bilge Aşkın, made re-labeling of images for avoiding the possible bias of quantification.
Two different normalizations were made on the data obtained from ImageJ. First, within-gel normalization was performed. Within gel normalization aimed to reach normalized values by eliminating differences of exposure and interassay. The necessity of within gel normalization depends on at least two technical replicas were performed for each of the samples. Normalization was made with following steps; the intensity of the selected band was divided to the average of all bands of the same blot cohort in the same gel. This normalization was applied to each protein of interest, which also includes equal loading protein, Tubulin.
The other normalization procedure was the standard one which depends on the equal loading protein intensities. This optimization was applied after the first optimization was made. The intensity of each of the interested band values divided to values of the house-keeping protein intensity from the related samples, which is tubulin in these experiments.
2.4 Immunohistochemistry
Immunohistochemistry (IHC) is one of the methods for showing the correlation between morphology and specific antigen locations. This method is widely used in the diagnostic and research laboratories for different aims. For instance, IHC enables to diagnose a tumor type or determine the grade of it with using specific markers in diagnostic laboratories. Meanwhile, in the research field, IHC gives a chance to detect the location of specific proteins or other antigens in tissue sections to show cell death and repair.
This method includes three main parts, which are tissue fixation-preparation, sectioning, and staining.
Fixation can be performed three ways; air drying, snap freezing, and chemical fixation [111]. Selection of tissue preparation method depends on tissue type, the prevalence of experiment, and preferred sectioning method. Chemical fixation with alcohol, acetone, and formaldehyde is the most common type of fixation. Formaldehyde has more advantages to preserve morphological details. However, fixation is not enough alone to preserve morphological details. Thus, cryoprotection should be performed to preclude freezing artifacts. Cryoprotection can be made with serially diluted chemicals like sucrose or methanol to remove liquids in tissue. Embedding is the final step of the first part. Most frequently used embedding the tissues made with using paraffin or Optimal Cutting Temperature (OCT) compound.
Sectioning can be made with vibratome, microtome, or cryostat according to the thickness preference, sample preparation method, and tissue type. Vibratome or microtome allows taking a wide range of thickness of sections from paraffin-embedded tissues with harder to operate. On the other hand, cryostat allows taking thin
sections from frozen tissues with operating manually. Also, using cryostat is beneficial to small tissues rather than vibratome or microtome.
Staining methods show many differences. Mainly, the parts which include antigen retrieval, blocking, primary antibody incubation, secondary antibody incubation, and mounting. All of these process show alterations according to tissue thickness, type, and preferred antibody.
Protocols show differences according to the model organism, tissue, and antigen. Many different optimized protocols that were published before, are for the rodents or human tissues. However, finding an optimized protocol for zebrafish as a less commonly used model organism is more complicated. So, the new protocol was needed to develop for this research.
2.4.1 Optimization of the protocol 2.4.1.1 Tissue preparation:
In this step, fixation was made with paraformaldehyde. Overnight incubation is the suggested method in the product sheet. Afterward, initially, sections were processed without cryoprotection with sucrose. However, it caused deformation of the brain since the brains were frozen with liquid in the brain. So, sucrose steps were added. After the cryoprotection, brains were taken and embedded in O.C.T. product and directly put in -80 oC without snap freezing because the orientation of the brain is crucial for sectioning part and making snap freezing caused orientation changes in the mold.
2.4.1.2 Sectioning
Sectioning was made with cryostat (Leica Biosystems, Germany, CM1850 UV). Cryostat method enables thinner sections as well as use of less antibody and the benefit of manual control in sectioning.