Proteomic study of hepatocellular carcinoma using a novel modi
fied
aptamer-based array (SOMAscan
™) platform
Zhiwei Qiao
a, Xiaoqing Pan
a, Cuneyd Parlayan
a,1, Hidenori Ojima
b,2, Tadashi Kondo
a,⁎
aDivision of Rare Cancer Research, National Cancer Center Research Institute, 5-1-1 Tsukiji, Chuo-ku, Tokyo 104-0045, Japan bDivision of Molecular Pathology, National Cancer Center Research Institute, 5-1-1 Tsukiji, Chuo-ku, Tokyo 104-0045, Japan
a b s t r a c t
a r t i c l e i n f o
Article history: Received 24 June 2016
Received in revised form 17 August 2016 Accepted 19 September 2016 Available online 20 September 2016
Vascular invasion is a pathological hallmark of hepatocellular carcinoma (HCC), associated with poor prognosis; it is strongly related to the early recurrence and poor survival after curative resection. In order to determine the proteomic backgrounds of HCC carcinogenesis and vascular invasion, we employed a novel modified aptamer-based array (SOMAscan) platform. SOMAscan is aptamer-based on the Slow Off-rate Modified Aptamers (SOMAmers), which rely on the natural 3D folding of single-stranded DNA-based protein affinity reagents. Currently, the ex-pression level of 1129 proteins can be assessed quantitatively. Correlation matrix analysis showed that the overall proteomic features captured by SOMAscan differ between tumor and non-tumor tissues. Non-tumor tissues were shown to have more homogeneous proteome backgrounds than tumor tissues. A comparative study identified 68 proteins with differential expression between tumor and non-tumor tissues, together with eight proteins associ-ated with vascular invasion. Gene Ontology analysis showed that the extracellular space and extracellular region proteins were predominantly detected. Network analysis revealed the linkage of seven proteins, AKT1, MDM2, PTEN, FGF1, MAPK8, PRKCB, and FN1, which were categorized as the components of“Pathways in cancer” in pathway analysis. The results of SOMAscan analysis were not concordant with those obtained by western blot-ting; only the determined FN1 levels were concordant between the two platforms. We demonstrated that the proteome captured by SOMAscan includes the proteins relevant to carcinogenesis and vascular invasion in HCC. The identified proteins may serve as candidates for the future studies of disease mechanisms and clinical applications.
© 2016 Elsevier B.V. All rights reserved.
Keywords:
Hepatocellular carcinoma SOMAscan
Vascular invasion
1. Introduction
Hepatocellular carcinoma (HCC) is the sixth most common cancer and the third leading cause of cancer death worldwide. Although hepa-titis virus infection and nonalcoholic fatty liver disease were identified as risk factors for the development HCC, the effects of HCC prevention remain limited, and the incidence of HCC has been increasing over the past 15 years[1]. Early diagnosis and subsequent treatments, such as surgical resection, liver transplantation, and radiofrequency ablation, have considerably improved the clinical outcome. However, long-term survival rates remain low because of a high incidence of recurrence
and metastases[2]. Five-year recurrence rates following the surgical treatment and liver transplantation are as high as 70% and 35%, respec-tively[3–6]. Moreover, most patients are not candidates for either sur-gery or transplantation, and their prognosis is not good. Molecular targeting therapies show a potential to prolong disease-free and overall survival of HCC patients. They include multikinase inhibitors, MET in-hibitors, antiangiogenic agents, and mTOR inhibitors[7]. However, many are still being investigated in clinical trials, and their clinical utility is not established yet. Further investigations of the molecular back-ground of carcinogenesis, metastasis, and recurrence are required for the improvement of clinical outcomes in HCC.
Vascular invasion is one of the important hallmarks associated with poor prognosis in HCC, and it is strongly correlated with early recurrence and poor survival after curative resection in HCC[8–10]. Accurate patho-logical diagnosis and prediction of vascular invasion are required for the best optimization and personalization of the available treatments. Many proteomic studies investigating vascular invasion in HCC have been con-ducted. Using two-dimensional difference gel electrophoresis (2D-DIGE) and antibody array, Hsieh et al. reported epidermal growth factor receptor (EGFR) 3 isoform as a candidate biomarker for vascular invasion in HCC[11]. Using mass spectrometry and immunohistochemistry,
⁎ Corresponding author.
E-mail addresses:[email protected](Z. Qiao),[email protected](X. Pan),
[email protected](C. Parlayan),[email protected](H. Ojima),[email protected]
(T. Kondo).
1 Department of Biomedical Engineering, School of Engineering and Natural Science &
Regenerative Restorative Medicine Research Center (REMER), Istanbul Medipol University, Kavacık Mah. Ekinciler Cad. No.19, Kavacık Kavsagı, Beykoz, 34810 Istanbul, Turkey.
2
Department of Pathology, School of Medicine, Keio University, 35 Shinanomachi, Shinjuku-ku, Tokyo 160-0016, Japan.
http://dx.doi.org/10.1016/j.bbapap.2016.09.011
1570-9639/© 2016 Elsevier B.V. All rights reserved.
Contents lists available atScienceDirect
Biochimica et Biophysica Acta
j o u r n a l h o m e p a g e :w w w . e l s e v i e r . c o m / l o c a t e / b b a p a pKanamori et al. showed that the increased expression of talin-1 is corre-lated with portal vein invasion of HCC cells[12], while Pote et al. reported that modified histone H4 represents a novel biomarker for microvascular invasion in HCC[13]. We previously identified paraoxonase 1[14]and STAT1[15], as crucial proteins involved in vascular invasion, and these proteins should be investigated in terms of mechanisms and clinical util-ity for HCC treatment. However, the proteomic approaches in these stud-ies did not consider the whole proteome and a long-standing problem with the lack of comprehensive proteomic modalities.
Recently, a new proteomics platform, SOMAscan, was developed for the examination of global protein expression[16,17]. SOMAscan is based on the Slow Off-rate Modified Aptamers (SOMAmers), which rely on the natural 3D folding of single-stranded DNA-based protein af-finity reagents. SOMAmers use chemically modified nucleotides that mimic amino acid side chains. SOMAmers are chemically diverse, specif-ic, and show affinity for protein-nucleic acid interactions. Through the it-erative selection and amplification process, using Systematic Evolution of Ligands by Enrichment (SELEX), SOMAmers are selected from the large random libraries of deoxyoligonucleotides for unique intramolecu-lar motifs that bind to the respective protein targets in the native confor-mations. Moreover, owing to the use of unique modified nucleotides, SOMAmers are more resistant to nuclease activity than conventional aptamers, and show a higher affinity than the antibodies. Currently, SOMAscan technology enables a simultaneous quantitative analysis of 1129 proteins per sample. SOMAscan has been applied to studies on sev-eral types of malignancies, such as lung cancer[18,19]and malignant mesothelioma[20], and benign diseases, such as chronic kidney disease
[16], Alzheimer's disease[21–23], Duchenne muscular dystrophy[24], and pulmonary tuberculosis[25]. These studies identified proteins and molecular mechanisms involved in the progression of these diseases. However, HCC has not been studied by SOMAscan.
Here, we applied SOMAscan for the investigation of global compara-tive protein expression in HCC. We compared proteomic profiles of tumor and non-tumor tissues, as well as tumor tissues with different vascular invasion status. Our results demonstrated that the proteomic features obtained by SOMAscan reflect the proteomic alterations that exist during carcinogenesis and vascular invasions in HCC.
2. Materials and methods 2.1. Patients and tissue samples
Frozen tissue samples were obtained from HCC patients at the time of surgery at the National Cancer Center Hospital, Tokyo, Japan. Liver cancer was diagnosed by ultrasonography and dynamic computed to-mography or magnetic resonance imaging. The diagnosis of HCC and the presence of vascular invasion were confirmed by pathological ex-amination of the surgically resected tissues. Patients included in this study did not receive neo-adjuvant treatment before tissue sampling. All samples were stored at−80 °C until further use. The Ethics Commit-tee of National Cancer Center, Japan, approved this study, and all pa-tients participating in this study provided written informed consent. 2.2. Sample preparation
Proteins were extracted from the frozen tissue samples according to the manufacturer's instructions (SomaLogic, Boulder, CO, USA). Briefly, frozen tissue samples were crushed to powder using a molding cham-ber in the presence of liquid nitrogen. Afterward, the samples were treated with the protein lysis buffer (M-PER Mammalian Protein Extrac-tion Reagent, Thermo Fisher Scientific, Bremen, Germany). Following the incubation on ice for 30 min, the samples were centrifuged at 13,000 ×g. The supernatant was collected, and stored−80 °C until fur-ther use. Protein concentration was measured by Bradford method (BioRad, Hercules, CA, USA).
2.3. SOMAscan profiling
Samples were examined using SomaLogic Biomarker Discovery assay in SomaLogic. The list of 1129 proteins examined in this study is presented with their UniPlot IDs and Gene IDs in Supplementary Table 1. This assay was performed as described previously[16,17]. Brief-ly, the protein samples were labeled with Cyanine 3 and immobilized onto streptavidin-coated beads with a photocleavable linker. After washing, the proteins bound to the cognate SOMAmer reagents were la-beled with biotin. Protein-SOMAmer complexes were incubated with the streptavidin-coated beads, which included oligomers of the specific sequences, and made a complex with the biotin-labeled proteins. Under denaturing conditions, SOMAmer reagents were released from the protein-SOMAmer complexes, and these complexes hybridized with custom-made DNA microarrays. Thefluorescence signal intensities of Cyanine 3 conjugated with SOMAmers were detected on microarrays. 2.4. Quality controls assessment
Three procedures were employed to remove the assay and sample bias, according to the SOMAscan standard operating procedures. The pro-cedures included hybridization control normalization, median signal nor-malization, and between-run calibration. The hybridization control normalization was performed to remove systematic biases introduced during the hybridization and scanning processes. Median signal normal-ization was done to remove sample or assay biases due to systematic var-iability, such as overall protein and reagent concentrations, pipetting variation, and assay timing. Between-run calibration is necessary for the correction of run-to-run variations originating from the differences in the endogenous levels of analytes in the replicate experiments, and it was achieved using a common pooled calibrator sample. The criteria for the acceptance for further study were determined according to the manufacturer's instructions, as follows: the hybridization control and me-dian signal normalization scale factors should be between 0.4 and 2.5; the median of the calibration scale factors should be within 1.0 ± 0.2; a min-imum of 95% of individual SOMAmer regents in the total array should be within the median ± 0.4. Following the normalization and calibration, the signal intensities were transformed to the relativefluorescent units, de-signed to be directly proportional to the amount of target protein in the initial samples. The quality of 78 samples was examined, and 72 of them passed the quality control assessment (Supplementary Table 2). 2.5. SDS-PAGE
Proteins (10μg) in tissue samples were separated using SDS-PAGE on 12% homogenous gels, with a homemade electrophoresis apparatus. Afterward, gels were stained using Silver Stain KANTO III Kit (Kanto Chemical, Tokyo, Japan).
2.6. Functional annotation of proteins
The Database for Annotation, Visualization and Integrated Discovery (DAVID) (http://david.abcc.ncifcrf.gov/) provides comprehensive func-tional annotation tools. Kyoto Encyclopedia of Genes and Genomes (KEGG) pathway enrichment analysis[26]was conducted to identify significant pathways involving differentially expressed proteins. Pb 0.05 was used as the cut-off value for gene ontology (GO) and KEGG pathway enrichment analyses performed using default DAVID parameters.
2.7. Protein-protein interaction (PPI) network analysis
Search Tool for the Retrieval of Interacting Genes (STRING), an on-line database resource collecting comprehensive information about the predicted and experimentally demonstrated protein interactions
STRING database are displayed using a combined score. Differentially expressed proteins were mapped into PPI networks and a combined score ofN0.5 was set as a cut-off value for the determination of signifi-cant protein pairs. The PPI network was established using Cytoscape software (version 3.3.0; National Institute of General Medical Sciences, Bethesda, MA, USA)[28].
2.8. Western blotting
Proteins (10μg) in tissue samples were separated by SDS-PAGE on 12% homogenous gels (ATTO, Tokyo, Japan), and transferred electro-phoretically to polyvinylidene difluoride membranes (Trans-Blot Turbo, Bio-Rad). These membranes were blocked with StartingBlock Blocking Buffer (Thermo Scientific) for 1 h at room temperature and in-cubated with the appropriate antibodies (summarized in Supplementa-ry Table 3), overnight at 4 °C. The membranes were washed three times with StartingBlock Blocking Buffer for 10 min, incubated with horserad-ish peroxidase-conjugated secondary antibodies (1:10,000 dilution; GE Healthcare, Uppsala, Sweden) for 1 h at room temperature, washed three times with StartingBlock Blocking Buffer for 1 h, and visualized using enhanced chemiluminescence (GE Healthcare). Western blot im-ages were obtained using Amersham Imager 600 (GE Healthcare). 3. Results and discussion
3.1. Overall SOMAscan features
The clinical and pathological data obtained for all samples in this study are summarized in Supplementary Table 4. The expression studies were conducted using 72 samples of tumor and non-tumor HCC tissues, which passed the quality control assessment. A summary of clinical and pathological data of 28 HCC patients who provided matched tumor and
non-tumor tissue samples, which were examined in this expression study, is presented inTable 1. In addition, we examined 16 non-tumor tis-sue samples obtained from the other HCC patients as well. To assess the overall proteomic features determined by SOMAscan, we examined the similarities between the protein expression profiles obtained for 72 sam-ples using a correlation matrix, and protein expression levels measured by SOMAscan are summarized in Supplementary Table 5. In a correlation matrix, the similarity of protein expression profile is evaluated in a pair-wise manner, and the correlation coefficients between the paired sam-ples are visualized in a heat-map (Supplementary Fig. 1). One sample (No. 17) of a non-tumor tissue (Supplementary Table 4), was shown to have a considerably different profile compared with other samples from the same group (Supplementary Fig. 1). This sample passed our quality assessment, and in order to examine its characteristics, we per-formed SDS-PAGE/silver staining of all samples, and found that the sepa-ration pattern of this sample was considerably different from those of the other samples; the protein bands were smeared and not clearly separated (Supplementary Fig. 2). Although the inappropriate sample handling and degradation of proteins may affect the quality of protein samples, we were not able to determine the factors influencing the quality of the ob-tained SOMAscan data for this sample. Because of this, we excluded the sample No. 17 from further investigations. The inclusion of this sample in the analyses led to its detection as an outlier both in supervised and un-supervised clustering. The quality of the overall appearance of samples, based on the expression data and the separation pattern of samples, may need to be determined, in addition to the quality assessment per-formed using microarray, as recommended by SOMAlogic.
Based on the results of correlation matrix study, tumor tissues were shown to have more homogenous protein expression profiles than non-tumor tissues (Fig. 1). These observations were concordant with those obtained in our previous proteomic study, where the correlation of all
Table 1
Summary of clinical and pathological data of HCC patients included in this study. Variable VP positive VP negative
Age† 61 (37–72) 69 (52–78)
Gender
Female 5 5
Male 11 7
Virus infection status
HBV 8 3 HCV 4 7 None 3 2 Ednmandson's classification 3 10 0 2 6 8 1 0 4 Liver cirrhosis Chronic hepatitis 8 5 Liver cirrhosis 2 3 Pre-cirrhosis 6 4 AFP (ng/mL)† 872.5 (3.9–132,320) 13.4 (5.6–444) Tumor number Single 11 9 Multiple 5 3 Tumor size (mm)† 124 (4–920) 9 (1–42) Differentiation Well differentiated 0 4 Moderately differentiated 6 8 Poorly differentiated 9 0 Undifferentiated 1 0 Intrahepatic metastasis Absence 7 12 Presence 9 0
VP, portal vein invasion; HBV, hepatitis B virus; HCV, hepatitis C virus; AFP, alpha-fetopro-tein; and† expressed as median (range).
Fig. 1. Overview of proteome, showing the similarities between 71 protein samples. The correlation matrix based on the correlation coefficiency of all pairs of samples is presented as a heat map. Note that 43 non-tumor tissue samples show high similarity to each other, indicating homogenous proteome backgrounds of non-tumor tissues.
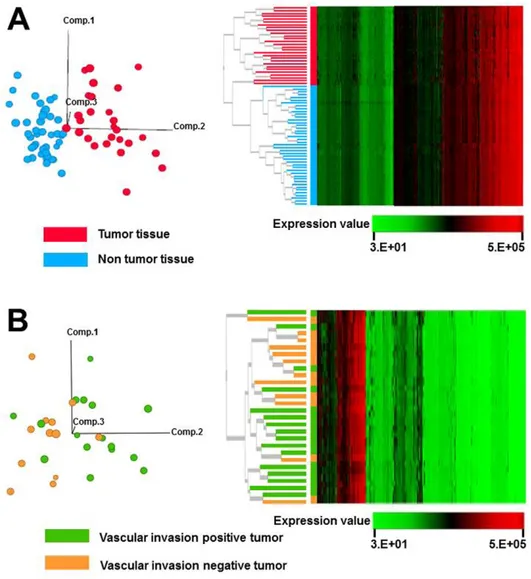
Fig. 2. Clustering of samples based on proteomic data obtained by SOMAscan. (A) Principal component analysis, showing that 28 tumor and 43 non-tumor tissue samples can be differentiated using the obtained proteomic data (left panel). Treeview diagram of unsupervised hierarchical classification, showing that 28 tumor and 43 non-tumor samples are separated according to their proteome (right panel). (B) Principal component analysis, showing that 28 tumor tissues with vascular invasion are not separated from those without the invasion (left panel). Treeview diagram of unsupervised hierarchical classification, showing that 28 tumor tissues with or without vascular invasion cannot be separated according to their proteome (right panel).
Fig. 3. Principal component analysis of the tissue samples, based on the differential expression levels of proteins between the sample groups. (A) Principal component analysis of 71 samples, based on the data obtained for 68 proteins with statistically significant (P b 0.05) and considerably (more than two-fold) differential expression between 28 tumor and 43 non-tumor tissues. (B) Principal component analysis of 16 vascular invasion-positive and 12 -negative tumor samples, based on the levels of eight proteins with statistically significant (more than two-fold) (Pb 0.05) difference in expression levels.
tumor and non-tumor tissue samples was examined using proteome data obtained by two-dimensional difference gel electrophoresis (2D-DIGE)[29]. The molecular backgrounds of tumor tissues may become heterogeneous during cancer development and progression, reflecting
genomic instability and a high number of mutations. A recent HCC geno-mic study demonstrated that different mutations, which varied among the patients, are present in HCC samples[30]. These observations sug-gest that the proteome data obtained by SOMAscan may reflect the
Table 2
Differentially expressed proteins in tumor and non-tumor tissues.
SomaLogic target description Protein name P-value Ratio of means
FCG2A/B Low affinity immunoglobulin gamma Fc region receptor II-a/b 1.60391E−12 14.65871079 CLC1B C-type lectin domain family 1 member B 8.49829E−12 8.117395889 CTAP-III Connective tissue-activating peptide III 8.65892E−11 4.899210819
MK08 Mitogen-activated protein kinase 8 1.9314E−08 4.828470003
Glypican 3 Glypican 3 0.025003385 4.734889282
GCKR Glucokinase regulatory protein 1.45019E−06 4.497003531
NAP-2 Neutrophil-activating peptide 2 3.93939E−11 3.897243649
ARMEL Cerebral dopamine neurotrophic factor 1.80858E−07 3.822649671
Histone H2A.z Histone H2A.z 9.43399E−06 3.547734608
6Ckine C-C motif chemokine 21 8.48492E−07 3.533547765
Siglec-7 Sialic acid-binding Ig-like lectin 7 1.37993E−10 3.336607673 LYVE1 Lymphatic vessel endothelial hyaluronic acid receptor 1 1.38668E−11 3.335677057
Fibronectin Fibronectin 8.4775E−10 3.227371577
Proteinase-3 Myeloblastin 1.01569E−06 3.164589399
Coagulation Factor IXab Coagulation Factor IXab 2.75134E−06 3.110488943
Lactoferrin Lactotransferrin 1.36707E−06 2.999792643
Coagulation Factor IX Coagulation Factor IX 4.33922E−06 2.940439094
PFD5 Prefoldin subunit 5 4.91094E−07 2.9310264
CONA1 Collagen alpha-1(XXIII) chain 1.76516E−09 2.876136737
AMPK a2b2g1 AMP Kinase (alpha2beta2gamma1) 1.89807E−09 2.862777034 CAMK2B Calcium/calmodulin-dependent protein kinase type II subunit beta 2.81171E−07 2.853866049 Siglec-9 Sialic acid-binding Ig-like lectin 9 0.000170537 2.803698894
TS Thymidylate synthase 1.59243E−07 2.797725278
Histone H1.2 Histone H1.2 0.000141149 2.791507477
CAMK2D Calcium/calmodulin-dependent protein kinase type II subunit delta 3.39021E−07 2.755911302 Carbonic anhydrase III Carbonic anhydrase III 3.37622E−09 2.748660339
FN1.3 Fibronectin Fragment 3 9.05959E−09 2.678521004
PF-4 Platelet factor 4 2.21252E−08 2.619216864
Adiponectin Adiponectin 1.64133E−09 2.597562827
ASAHL N-acylethanolamine-hydrolyzing acid amidase 1.80858E−07 2.588865008
TSP2 Thrombospondin-2 0.023521116 2.575675112
Cathepsin A Lysosomal protective protein 3.20196E−10 2.573156124
STRATIFIN 14–3-3 protein sigma 5.85034E−11 2.516645598
Nidogen Nidogen-1 1.11551E−08 2.500955119
SAP Serum amyloid P-component 3.60741E−07 2.500792938
CHST2 Carbohydrate sulfotransferase 2 3.72492E−10 2.480710515
Macrophage mannose receptor Macrophage mannose receptor 1 1.1953E−08 2.430523881 Hat1 Histone acetyltransferase type B catalytic subunit 4.58992E−06 2.368498121
FER Tyrosine-protein kinase Fer 1.45319E−05 2.365397724
PIGR Polymeric immunoglobulin receptor 0.02577626 2.360005704
C1-esterase inhibitor Plasma protease C1 inhibitor 4.10092E−06 2.326469235
IL-6 Interleukin-6 7.30904E−10 2.270314018
MFGM Lactadherin 0.000170515 2.262490803
CDK1/cyclin B Cyclin-dependent kinase 1:G2/mitotic-specific cyclin-B1 complex 2.02724E−10 2.236239682
Plasminogen Plasminogen 0.000196257 2.22652426
b-ECGF Fibroblast growth factor 1 1.70569E−05 2.223794208
MAPK14 Mitogen-activated protein kinase 14 0.000141149 2.215706529 PKB a/b/g Protein kinase B alpha/beta/gamma 5.17078E−09 2.209372187
GFRa-1 GDNF family receptor alpha-1 0.000749444 2.207436683
Myeloperoxidase Myeloperoxidase 1.17241E−05 2.204735291
CD5L CD5 antigen-like 4.91094E−07 2.202802799
Spondin-1 Spondin-1 6.87179E−08 2.186860357
SARP-2 Secreted frizzled-related protein 1 7.30904E−10 2.182667208
PAI-1 Plasminogen activator inhibitor 1 2.19311E−09 2.180469154
Coagulation Factor XI Coagulation Factor XI 2.81171E−07 2.159633365 pTEN Phosphatidylinositol 3,4,5-trisphosphate 3-phosphatase and dual-specificity
protein phosphatase PTEN
2.86287E−11 2.144258956 PKC-B-II Protein kinase C beta type (splice variant beta-II) 8.00631E−06 2.139098673 Alkaline phosphatase, bone Alkaline phosphatase, tissue-nonspecific isozyme 3.87518E−06 2.138170673 ENPP7 Ectonucleotide pyrophosphatase/phosphodiesterase family member 7 0.001141048 2.13678656
Prekallikrein Plasma kallikrein 4.33922E−06 2.119442309
IP-10 C-X-C motif chemokine 10 7.87214E−10 2.080798775
ARP19 cAMP-regulated phosphoprotein 19 6.66316E−07 2.080177749
CAMK2A Calcium/calmodulin-dependent protein kinase type II subunit alpha 2.45188E−06 2.076505981
Karyopherin-a2 Importin subunit alpha-1 3.63832E−11 2.060654013
alpha-1-Antichymotrypsin complex alpha-1-antichymotrypsin complex 6.48599E−05 2.049252182
XTP3A dCTP pyrophosphatase 1 0.000372171 2.043323553
IL-16 Interleukin-16 1.57367E−08 2.029585089
variations in genomic aberrations in HCC patients. The integration of ge-nomic and proteomic data may represent an improved approach to the analysis of molecular events during HCC carcinogenesis and cancer pro-gression, and for this, SOMAscan may be one of the proteomics analysis tools.
In order to determine the clinical and pathological parameters that may affect the analysis of proteomic data obtained by SOMAscan, we performed unsupervised classification of samples using the expression profiles of 1129 proteins obtained by SOMAscan. The samples were shown to be grouped according to their histological characteristics, such as tumor and non-tumor tissue, by principal component analysis (Fig. 2A, left) and hierarchical clustering (Fig. 2A, right). Thesefindings indicate that the expression levels of individual proteins and their ex-pression patterns determined by SOMAscan are affected during malig-nant transformation, suggesting that SOMAscan is useful for the investigations of the proteins with biological roles in HCC carcinogene-sis. In addition to its potential use in cancer proteomics, the number of proteins that can be analyzed by this technique is limited to 1129. As the current proteomics modalities, such as mass spectrometry com-bined with prior-fractionation, can identify 8438 proteins in liver cancer tissue samples[15], an increase in the number of proteins included in this SOMAscan panel is desirable.
We further focused on the proteomic data obtained in tumor tissues. The tumor samples were divided into two groups, vascular invasion-positive tumors and vascular invasion-negative tumors, and the expres-sion levels of 1129 proteins in these samples were analyzed using unsu-pervised clustering with principal component analysis (Fig. 2B, left) and hierarchical clustering (Fig. 2B, right). Unsupervised clustering analyses were not able to separate these two types of tumors, which may suggest that the changes in proteome, captured by SOMAscan, are predomi-nantly happening during the malignant transformation, and the late-stage alterations may affect, to a lesser extent, only a small portion of proteome.
In order to identify the proteins responsible for the correlation matrix-based sample grouping (Supplementary Fig. 3), hierarchical clustering (Fig. 2), and principal component analysis (Fig. 3), we per-formed comparative analysis of the sample groups. We found that the expression levels of 68 proteins significantly differ between tumor and non-tumor tissue samples (Table 2), and the expression levels of eight proteins differed between tumor tissues with or without vascular inva-sion (Table 3). As demonstrated by the principal component analysis, the expression pattern of these 68 and eight proteins were used to dis-tinguish the samples according their histology (e.g., tumor or non-tumor tissues, and non-tumors with or without vascular invasion) (Fig. 3). Moreover, with the exception of two samples (No. 52 and No. 54, Sup-plementary Table 4), all other samples were grouped according to their histological characters by hierarchical clustering, using the select-ed 68 and eight proteins (Fig. 4). These observations indicate that these
sets of selected proteins represent tumor tissue characteristics, and that SOMAscan is very useful for the investigation of the molecular back-grounds of HCC.
3.2. GO analyses
GO and pathway analyses were performed for 68 differentially expressed proteins. The topfive GO terms identified in each of the three GO categories (biological processes, molecular function, and cellular com-ponents) are presented inTable 4. GO terms determined for the differen-tially expressed proteins were mainly related to the extracellular space (P = 2.70E−10), response to wounding (P = 1.64E−09), extracellular region part (P = 1.87E−09), extracellular region (P = 3.85E−08), and defense response (P = 6.59E−07) (Table 4). The pathways significantly enriched of differentially expressed proteins included cancer pathways, glioma, adipocytokine signaling pathway, erbB signaling pathway, and neurotrophin signaling pathway.
The levels of proteins belonging to the extracellular space and extra-cellular region groups were significantly increased in tumor tissues. The proteins assigned to the group with extracellular space features includ-ed F11, IL6, APCS, IL16, MFGE8, CD5L, PF4, SERPING1, SFN, ADIPOQ, PLG, CXCL10, GPC3, PPBP, SFRP1, CCL21, KLKB1, MPO, FGF1, and FN1. Pro-teins included in extracellular region group were IL16, PF4, SFN, CXCL10, GPC3, CDNF, CCL21, KLKB1, SERPINE1, SERPINA3, LTF, FGF1, THBS2, SPON1, FN1, F11, IL6, APCS, F9, SERPING1, CD5L, MFGE8, NID1, PIGR, ADIPOQ, PLG, PPBP, SFRP1, and MPO. Many studies suggested that the extracellular proteins may play important roles in cancer pro-gression, and that they may represent potential therapeutic targets. Loo et al. reported that the extracellular space is an important compart-ment for the malignant energetic catalysis, and its therapeutic targeting may be beneficial[31]. Weinstein et al. found that the extracellular re-gion of heregulin promotes mammary gland proliferation as well as tu-morigenesis[32]. Luo et al. reported that in HCC patients, extracellular H2O2released from the liver cancer cells into extracellular space
pro-motes the progression of cancer[33]. Taken together, these results sug-gest that the proteins identified in SOMAscan should be further investigated, in order to understand better the molecular background of HCC progression.
3.3. Construction and analysis of PPI network
Based on STRING database analysis, a total of 82 protein pairs with combined score ofN0.5 were identified. As shown inFig. 5, PPI network consists of 43 nodes and 82 edges. Pathway enrichment analysis revealed that the proteins differentially expressed between tumor and non-tumor tissues were significantly enriched in “Path-ways in cancer”. These proteins included AKT1 (RAC-alpha serine/ threonine-protein kinase), MDM2 (E3 ubiquitin-protein ligase), PTEN (phosphatidylinositol 3,4,5-trisphosphate 3-phosphatase and dual-specificity protein phosphatase), FGF1 (fibroblast growth fac-tor 1), MAPK8 (mitogen-activated protein kinase 8), PRKCB (protein kinase C beta type), and FN1 (fibronectin). They have been exten-sively investigated in many types of cancers, including HCC. Ko et al. reported that AKT1 phosphorylation is involved in HCC tumor-igenesis and metastasis[34]. Meng et al. identified MDM2-p53 as a pathway that plays an important role in the progression of HCC
[35], while Cow et al. demonstrated the aberrant regulation of FGF1 in the progressed HCC[36]. Xu et al. showed that FGF1 represents a potential target of transcription factor CP2 in the process of HCC me-tastasis[37]. Although the identified proteins have been previously studied in HCC, these data may suggest the utility of SOMAscan in cancer research. Additionally, these observations indicate that SOMAscan analysis may allow the determination of differential ex-pression of the proteins that have been extensively studied in cancer research, and that the results of the previous research may lead to the biased estimates obtained in this analysis—since they have
Table 3
Proteins with differential expression in tumor tissues with or without vascular invasion. SomaLogic
target description
Protein name P-value Ratio of means
SRCN1 Proto-oncogene tyrosine-protein kinase Src
0.002181728 0.33546314 ARI3A AT-rich interactive
domain-containing protein 3 A
0.005187078 0.342662869 Antithrombin III Antithrombin-III 0.047275704 2.520779493 TFF3 Trefoil factor 3 0.0291803 0.423346694 Tenascin Tenascin 0.03305345 2.241946444 Histone H1.2 Histone H1.2 0.037338343 2.196899195 KPCI Protein kinase C iota type 0.000346134 0.485205543 PSD7 26S proteasome non-ATPase
regulatory subunit 7
been previously studied, they are included in SOMAscan platform. SOMAscan analyses may lead to new applications and to the deter-mination of functional roles of the previously studied proteins. 3.4. Validation of the obtained differences in the expression of selected proteins
The differential expression of proteins observed using SOMAscan was validated by western blot, using specific antibodies. Western blot images
obtained for the proteins differentially expressed between tumor and non-tumor tissue samples are shown in Supplementary Fig. 3A, while those differentially expressed between vascular invasion-positive and vascular invasion-negative tumors are shown in Supplementary Fig. 3B. The quantification of the intensities of protein bands is presented in Sup-plementary Fig. 4. Overall similarity of SOMAscan data and western blot results was compared for seven proteins (fibronectin, MDM2, FER, TF, CDC37, LYN, and Annexin II), and the results are summarized and presented using scatter-grams (Supplementary Fig. 5). Among the
Fig. 4. Proteins with differential expression between the sample groups. (A) Sixty-eight proteins with statistically significant (P b 0.05) and considerable (more than two-fold) differences in the expression levels between tumor and non-tumor tissues. (B) Eight proteins with statistically significant (P b 0.05) and considerable (more than two-fold) differences in the expression levels between tumor tissues with or without vascular invasion. The samples are grouped according to their pathological characteristics, based on protein expression levels determined by SOMAscan.
examined proteins, only the expression levels offibronectin in both SOMAscan and western blot analyses were in concordance (r = 0.8063, P = 2.2E−16). Our data indicate that fibronectin is overexpressed in
tumor tissues in comparison with the adjacent normal tissues. These ob-servations are in agreement with a previous report, where the abnormal expression of fibronectin was observed in the cytoplasm and/or
Table 4
Gene ontology and pathway analyses for the proteins differentially expressed in tumor or non-tumor tissues, and tumors with or without vascular invasion.
Category Term Count % P-value
GOTERM_BP_FAT GO:0009611~response to wounding 17 2.36 1.64.E−09
GOTERM_BP_FAT GO:0006952~defense response 15 2.08 6.59.E−07
GOTERM_BP_FAT GO:0006793~phosphorus metabolic process 13 1.81 1.56.E−03 GOTERM_BP_FAT GO:0006796~phosphate metabolic process 13 1.81 1.56.E−03 GOTERM_BP_FAT GO:0006468~protein amino acid phosphorylation 12 1.67 2.28.E−04
GOTERM_CC_FAT GO:0005576~extracellular region 29 4.03 3.85.E−08
GOTERM_CC_FAT GO:0044421~extracellular region part 22 3.06 1.87.E−09
GOTERM_CC_FAT GO:0005615~extracellular space 20 2.78 2.71.E−10
GOTERM_CC_FAT GO:0005829~cytosol 13 1.81 2.44.E−02
GOTERM_CC_FAT GO:0031982~vesicle 11 1.53 1.33.E−03
GOTERM_MF_FAT GO:0004672~protein kinase activity 12 1.67 1.21.E−04
GOTERM_MF_FAT GO:0030246~carbohydrate binding 11 1.53 6.09.E−06
GOTERM_MF_FAT GO:0004674~protein serine/threonine kinase activity 11 1.53 3.29.E−05 GOTERM_MF_FAT GO:0008236~serine-type peptidase activity 8 1.11 2.11.E−05 GOTERM_MF_FAT GO:0017171~serine hydrolase activity 8 1.11 2.27.E−05
KEGG_PATHWAY hsa05200:Pathways in cancer 10 1.39 9.61.E−04
KEGG_PATHWAY hsa05214:Glioma 9 1.25 2.44.E−08
KEGG_PATHWAY hsa04920:Adipocytokine signaling pathway 8 1.11 7.90.E−07
KEGG_PATHWAY hsa04012:ErbB signaling pathway 8 1.11 4.72.E−06
KEGG_PATHWAY hsa04722:Neurotrophin signaling pathway 8 1.11 4.88.E−05
Fig. 5. Protein-protein interaction network based on the expression profiles of proteins that were determined to be differentially expressed between tumor and non-tumor tissues. Red nodes, upregulated proteins. Green nodes, downregulated proteins. Members of the“Pathway in cancer” are highlighted in yellow.
membrane of HCC cells[38]. Fibronectin plays important roles in cell-to-cell interactions, cell-to-cell migration, and cell-to-cell signaling, and therefore, the clical relevance of the changes in its expression level should be further in-vestigated in HCC patients[39].
The discrepancy observed between the obtained SOMAscan and western blot results is not surprising, considering that SOMAmers and antibodies used for western blot analyses may recognize different epi-topes. Although this does not necessary reduce the utility of SOMAscan, it may hinder the possibility of SOMAscan application, because the anti-bodies are versatile tools for protein expression studies and have been used extensively in basic science studies and for clinical applications. However, if this issue cannot be resolved, and the use of SOMAscan al-lows unique data to be obtained, SOMAscan can be used as an indepen-dent tool. The advanced use of SOMAmer for plate-based sandwich assays was demonstrated in the studies of cardiovascular risk biomarker candidates [40]. Furthermore, previous studies showed that the fluorophore-labeled SOMAmers can be used in histochemical staining
[18,41]. Gupta et al. reported that SOMAmer can function as an antago-nist of an inflammatory cytokine, interleukin-6[42], which is involved in the pathogenesis of various diseases, including HCC, and anti-interleukin-6 antibody, tocilizumab, is currently used for rheumatoid arthritis[43–45]and other diseases[46]. These reports indicate that SOMAscan platform can be used as a self-contained system.
The confirmation and validation of the protein expression data rep-resent an issue that has been intensively discussed elsewhere[47]. Mass spectrometry measures the amount of individual peptides, which may not represent the expression levels of the corresponding native pro-teins. Using 2D PAGE, the amount of individual proteins can be deter-mined, and protein spot data is needed to estimate the total amount of corresponding proteins. Immunohistochemical analyses may provide the information about both expression levels and the localization of pro-teins in the examined tissues. However, these data are affected by the process offixation and tissue sample storage conditions, and these re-sults are even further biased by the antibodies selected for the analyses. Antibody- and reverse-phase arrays generate protein expression data, but are also affected by the level of affinity on the solid substances. One of the possible ways of determining the overall proteomes of differ-ent tissue sample is combined use of multiple proteomics platforms, and the integration of these data using bioinformatics.
3.5. Previously identified HCC-related proteins in SOMAscan study Using proteomics modalities, such as 2D-DIGE and mass spectrome-try, we previously reported several proteins that were shown to be as-sociated with malignant features of HCC. The clinical significance of identified proteins was validated using the independent sample sets. These proteins include APC-binding protein EB1[29,48], glypican-3
[49], selenium-binding protein 1 and HIF-1α[50], and paraoxonase 1
[14]. Moreover, we reported 23 proteins shown to be associated with the early HCC recurrence, using 2D-DIGE[51]. Although we aimed to perform a comprehensive proteomic study, we did not identify the pre-viously identified proteins as proteins associated with the vascular inva-sion in this study. This is mainly due to the differences in the study designs: here, the samples were grouped according to the vascular inva-sion, while the samples in the previous studies were stratified according to the histological differentiation[29,48], the expression level of bio-markers[49], the metastatic potential of tumor cells[50], the status of microvascular invasion[14], and the time to recurrence[51]. Further-more, the proteins listed above were not analyzed here, except for glypican-3[49]and paraoxonase 1[14], and 5 of the 23 proteins related to the early HCC recurrence, such as annexin A1, annexin A2, L-lactate dehydrogenase B chain, peptidyl-prolyl cis-trans isomerase B, and phos-phoglycerate kinase 1, were included in the SOMAscan platform (Sup-plementary Table 1)[51]. We identified glypican-3 as a tissue protein associated with the increased levels of plasma AFP[49]. In this study, we showed that the expression level of glypican-3 was 4.7-fold higher
in tumor than in the adjacent non-tumor tissues(P = 0.025,Table 2). This observation was consistent with our previous immunohistochem-ical analyses, which showed that the level of glypican-3 is upregulated in tumor tissues in comparison with the surrounding non-tumor tissues in HCC patients[49]. Previously, paraoxonase 1 was shown to be upreg-ulated in the plasma of HCC patients with microvascular invasion[14]. Although paraoxonase 1 was included in the SOMAscan array, no statis-tically significant changes were observed in this study.
Additionally, we have identified many proteins associated with ma-lignant features of HCC using proteomics modalities, reported as supple-mentary data[14,29,48–51]. Although their clinical utilities have not been validated yet, the integration of the previously obtained data and the data obtained in this study will further increase our understanding of molecular processes underlying HCC development, as well as the us-ability of proteomics modalities.
In cancer proteomic studies using SOMAscan platform, cancer-associated proteins may need to be preferentially arrayed, as the levels of some proteins tend to be altered in many different samples, although their role may be tumor-dependent, and performing expression studies of these proteins may lead to the elucidation of previously unknown can-cer aspects. Although comprehensive proteomics using the affinity-based proteomic tools require exhaustive preparations, following the establish-ment of the experiestablish-mental system, they may present a powerful tool for basic research and clinical applications.
4. Conclusions
The obtained data can represent a reference for the possible applica-tion of SOMAscan in cancer proteomic studies. Our results indicate that the SOMAscan technology may be useful for the discovery of proteins as-sociated with the malignant potential of HCCs, using clinical materials. However, the proteome coverage, the quality assessment of samples, and the concordance with the antibody-based proteomics methods should be further investigated. Because of the high potential utility and versatility, SOMAscan applications should be developed in the future.
Supplementary data to this article can be found online athttp://dx. doi.org/10.1016/j.bbapap.2016.09.011.
Ethics approval and consent to participate
The study was reviewed and approved by the Institutional Review Board of the National Cancer Center (Tokyo, Japan). Written informed consent was obtained from all participants in this study.
Authors' contributions
Zhiwei Qiao, Hidenori Ojima, and Tadashi Kondo designed and per-formed the study, and wrote the manuscript. Xiaoqing Pan and Cuneyd Parlayan contributed to the experiments.
Conflict of interest
SOMAscan experiments were performed by SomaLogic (Boulder, CO, USA).
Transparency document
TheTransparency documentassociated with this article can be found, in online version.
Acknowledgments
This study was supported by the Practical Research for Innovative Cancer Control (15ck0106089h0002) from Japan Agency for Medical Research and Development, AMED.
References
[1] Global Burden of Disease Cancer, C., et al., The global burden of cancer 2013, JAMA Oncol. 1 (4) (2015) 505–527.
[2] A. Forner, J.M. Llovet, J. Bruix, Hepatocellular carcinoma, Lancet 379 (9822) (2012) 1245–1255.
[3] Y. Fong, et al., An analysis of 412 cases of hepatocellular carcinoma at a Western cen-ter, Ann. Surg. 229 (6) (1999) 790–799 (discussion 799-800).
[4] M.A. Zimmerman, et al., Recurrence of hepatocellular carcinoma following liver transplantation: a review of preoperative and postoperative prognostic indicators, Arch. Surg. 143 (2) (2008) 182–188 discussion 188.
[5] Y. Nakashima, et al., Portal vein invasion and intrahepatic micrometastasis in small hepatocellular carcinoma by gross type, Hepatol. Res. 26 (2) (2003) 142–147.
[6] G.L. Grazi, et al., Improved results of liver resection for hepatocellular carcinoma on cirrhosis give the procedure added value, Ann. Surg. 234 (1) (2001) 71–78.
[7] G. Bertino, et al., Hepatocellular carcinoma: novel molecular targets in carcinogene-sis for future therapies, Biomed. Res. Int. 2014 (2014) 203693.
[8] K.C. Lim, et al., Microvascular invasion is a better predictor of tumor recurrence and overall survival following surgical resection for hepatocellular carcinoma compared to the Milan criteria, Ann. Surg. 254 (1) (2011) 108–113.
[9] T.J. Tsai, et al., Clinical significance of microscopic tumor venous invasion in patients with resectable hepatocellular carcinoma, Surgery 127 (6) (2000) 603–608.
[10] P.A. Clavien, et al., Recommendations for liver transplantation for hepatocellular car-cinoma: an international consensus conference report, Lancet Oncol. 13 (1) (2012) e11–e22.
[11] S.Y. Hsieh, et al., Secreted ERBB3 isoforms are serum markers for early hepatoma in patients with chronic hepatitis and cirrhosis, J. Proteome Res. 10 (10) (2011) 4715–4724.
[12] H. Kanamori, et al., Identification by differential tissue proteome analysis of talin-1 as a novel molecular marker of progression of hepatocellular carcinoma, Oncology 80 (5–6) (2011) 406–415.
[13] N. Pote, et al., Imaging mass spectrometry reveals modified forms of histone H4 as new biomarkers of microvascular invasion in hepatocellular carcinomas, Hepatology 58 (3) (2013) 983–994.
[14] C. Huang, et al., Quantitative proteomic analysis identified paraoxonase 1 as a novel serum biomarker for microvascular invasion in hepatocellular carcinoma, J. Prote-ome Res. 12 (4) (2013) 1838–1846.
[15] M. Taoka, et al., Global PROTOMAP profiling to search for biomarkers of early-recurrent hepatocellular carcinoma, J. Proteome Res. 13 (11) (2014) 4847–4858.
[16] L. Gold, et al., Aptamer-based multiplexed proteomic technology for biomarker dis-covery, PLoS One 5 (12) (2010), e15004.
[17] L. Gold, et al., Advances in human proteomics at high scale with the SOMAscan pro-teomics platform, New Biotechnol. 29 (5) (2012) 543–549.
[18] M.R. Mehan, et al., Protein signature of lung cancer tissues, PLoS One 7 (4) (2012), e35157.
[19]M.R. Mehan, et al., Validation of a blood protein signature for non-small cell lung cancer, Clin. Proteomics 11 (1) (2014) 32.
[20]R.M. Ostroff, et al., Early detection of malignant pleural mesothelioma in asbestos-exposed individuals with a noninvasive proteomics-based surveillance tool, PLoS One 7 (10) (2012), e46091.
[21] M. Sattlecker, et al., Alzheimer's disease biomarker discovery using SOMAscan multiplexed protein technology, Alzheimers Dement. 10 (6) (2014) 724–734.
[22] N. Voyle, et al., Blood protein markers of neocortical amyloid-beta burden: a candi-date study using SOMAscan technology, J. Alzheimers Dis. (2015).
[23] S.J. Kiddle, et al., Plasma protein biomarkers of Alzheimer's disease endophenotypes in asymptomatic older twins: early cognitive decline and regional brain volumes, Transl. Psychiatry 5 (2015), e584.
[24] Y. Hathout, et al., Large-scale serum protein biomarker discovery in Duchenne mus-cular dystrophy, Proc. Natl. Acad. Sci. U. S. A. 112 (23) (2015) 7153–7158.
[25] P. Nahid, et al., Aptamer-based proteomic signature of intensive phase treatment re-sponse in pulmonary tuberculosis, Tuberculosis (Edinb.) 94 (3) (2014) 187–196.
[26] M. Kanehisa, S. Goto, KEGG: Kyoto encyclopedia of genes and genomes, Nucleic Acids Res. 28 (1) (2000) 27–30.
[27] D. Szklarczyk, et al., The STRING database in 2011: functional interaction networks of proteins, globally integrated and scored, Nucleic Acids Res. 39 (Database issue) (2011) D561–D568.
[28] M. Kohl, S. Wiese, B. Warscheid, Cytoscape: software for visualization and analysis of biological networks, Methods Mol. Biol. 696 (2011) 291–303.
[29]T. Orimo, et al., Proteomic profiling reveals the prognostic value of adenomatous polyposis coli-end-binding protein 1 in hepatocellular carcinoma, Hepatology 48 (6) (2008) 1851–1863.
[30]A. Fujimoto, et al., Whole-genome mutational landscape and characterization of noncoding and structural mutations in liver cancer, Nat. Genet. 48 (5) (2016) 500–509.
[31]J.M. Loo, et al., Extracellular metabolic energetics can promote cancer progression, Cell 160 (3) (2015) 393–406.
[32] E.J. Weinstein, P. Leder, The extracellular region of heregulin is sufficient to promote mammary gland proliferation and tumorigenesis but not apoptosis, Cancer Res. 60 (14) (2000) 3856–3861.
[33] Y. Luo, et al., Detection of extracellular H2O2released from human liver cancer cells
based on TiO2nanoneedles with enhanced electron transfer of cytochrome c, Anal.
Chem. 81 (8) (2009) 3035–3041.
[34] F.C. Ko, et al., Akt phosphorylation of deleted in liver cancer 1 abrogates its suppres-sion of liver cancer tumorigenesis and metastasis, Gastroenterology 139 (4) (2010) 1397–1407.
[35]X. Meng, et al., MDM2-p53 pathway in hepatocellular carcinoma, Cancer Res. 74 (24) (2014) 7161–7167.
[36]N.H. Chow, et al., Expression offibroblast growth factor-1 and fibroblast growth factor-2 in normal liver and hepatocellular carcinoma, Dig. Dis. Sci. 43 (10) (1998) 2261–2266.
[37] X. Xu, et al., Characterization of genome-wide TFCP2 targets in hepatocellular carci-noma: implication of targets FN1 and TJP1 in metastasis, J. Exp. Clin. Cancer Res. 34 (2015) 6.
[38] M. Torbenson, et al., Hepatocellular carcinomas show abnormal expression of fibro-nectin protein, Mod. Pathol. 15 (8) (2002) 826–830.
[39] M. Zhang, et al., Expression and prognostic role of FHIT,fibronectin, and PTEN in he-patocellular carcinoma, Clin. Lab. 62 (2016).
[40]U.A. Ochsner, et al., Systematic selection of modified aptamer pairs for diagnostic sandwich assays, BioTechniques 56 (3) (2014) (pp. 125-8, 130, 132-3).
[41] S. Gupta, et al., Rapid histochemistry using slow off-rate modified aptamers with an-ionic competition, Appl. Immunohistochem. Mol. Morphol. 19 (3) (2011) 273–278.
[42] S. Gupta, et al., Chemically modified DNA aptamers bind interleukin-6 with high af-finity and inhibit signaling by blocking its interaction with interleukin-6 receptor, J. Biol. Chem. 289 (12) (2014) 8706–8719.
[43] T. Tanaka, M. Narazaki, T. Kishimoto, Therapeutic targeting of the interleukin-6 re-ceptor, Annu. Rev. Pharmacol. Toxicol. 52 (2012) 199–219.
[44] N. Nishimoto, T. Kishimoto, K. Yoshizaki, Anti-interleukin 6 receptor antibody treat-ment in rheumatic disease, Ann. Rheum. Dis. 59 (Suppl. 1) (2000) i21–i27.
[45] J.S. Smolen, R.N. Maini, Interleukin-6: a new therapeutic target, Arthritis Res. Ther. 8 (Suppl. 2) (2006) S5.
[46]T. Tanaka, T. Kishimoto, Targeting interleukin-6: all the way to treat autoimmune and inflammatory diseases, Int. J. Biol. Sci. 8 (9) (2012) 1227–1236.
[47] P.R. Jungblut, The proteomics quantification dilemma, J. Proteome 107 (2014) 98–102.
[48] K. Fujii, et al., Proteomic study of human hepatocellular carcinoma using two-dimensional difference gel electrophoresis with saturation cysteine dye, Proteomics 5 (5) (2005) 1411–1422.
[49] S. Saito, et al., Molecular background of alpha-fetoprotein in liver cancer cells as re-vealed by global RNA expression analysis, Cancer Sci. 99 (12) (2008) 2402–2409.
[50] C. Huang, et al., Decreased selenium-binding protein 1 enhances glutathione perox-idase 1 activity and downregulates HIF-1alpha to promote hepatocellular carcinoma invasiveness, Clin. Cancer Res. 18 (11) (2012) 3042–3053.
[51] H. Yokoo, et al., Protein expression associated with early intrahepatic recurrence of hepatocellular carcinoma after curative surgery, Cancer Sci. 98 (5) (2007) 665–673.