ÇANKAYA UNIVERSITY
GRADUATE SCHOOL OF SOCIAL SCIENCES DEPARTMENT OF ECONOMICS
MASTER THESIS
STOCK MARKET VOLATILITY AND MACROECONOMIC PERFORMANCE IN THE NIGERIAN ECONOMY
MUSA MUHAMMAD IBRAHIM
iv ABSTRACT
STOCK MARKET VOLATILITY AND MACROECONOMIC PERFORMANCE IN THE NIGERIAN ECONOMY.
Musa Muhammad IBRAHIM M.Sc. Financial Economics Supervisor: Prof. Dr. Mehmet YAZICI Co-Supervisor: Dr. Hasan Murat ERTUĞRUL
June 2014, 96 pages
This thesis seeks to investigate the impact of stock market volatility on macroeconomic variables, specifically on real GDP and inflation, in Nigeria using quarterly time series data from 1985Q1-2012Q4. To achieve this, the study establishes two equations: real GDP and inflation equations, and splits the analysis into two parts. In the first part, the study employs four volatility models: ARCH, GARCH, EGARCH and TGARCH models, and compares them based on both model selection criterion and forecast performance in order to choose among them the fittest model to All Share Index (ASI) series (which is used as a proxy of the Nigerian stock market index). The TGARCH model was then selected as the best model, and therefore, the Nigerian stock market volatility series were extracted from it. In the second part, the thesis applies Bounds test co-integration approach and ARDL model. The results from the Bounds test analysis suggest the existence of co-integration relationship between the Nigerian stock market volatility and macroeconomic variables. While, the results from the ARDL model indicate that the stock market volatility has no any significant effect on the real GDP in both long-run and short-run and on the inflation in the long-run in Nigeria. However, the results also show that in the short-run, the Nigerian stock market volatility has significant positive impact on inflation.
Keywords: Stock Market Volatility, Real GDP equation, Inflation equation, ARCH Family Models, Bounds tests, ARDL Model
v ÖZET
NİJERYA EKONOMİSİNDE MENKUL KIYMETLER BORSASI OYNAKLIĞI VE MAKRO EKONOMİ PERFORMANSI
Musa Muhammad IBRAHIM Finansal Ekonomi Yüksek Lisansı Danışman: Prof. Dr. Mehmet YAZICI
Yardımcı Danışman: Dr. Hasan Murat ERTUĞRUL
Haziran 2014, 96 sayfa
Bu tez, Nijerya’nın 1985 1. çeyrek - 2012 4. çeyrek dönemleri zaman serisi verileri kullanılarak, menkul kıymetler borsasındaki oynaklığın, başta reel gayri safi yurt içi hasıla ve enflasyon üzerindeki etkileri olmak üzere, makro iktisadi değişkenler üzerindeki etkilerini araştırmaktadır. Bunun için iki denklem kurulmuştur: Reel gayri safi yurt içi hasıla denklemi ve enflasyon denklemi. Analiz iki bölüme ayrılmıştır. İlk bölümde ARCH, GARCH, EGARCH ve TGARCH oynaklık modelleri yer almaktadır. Bu modeller, hisse senedi endeksi (ASI) serilerinde (Nijerya menkul kıymetler borsası endeksi vekili olarak kullanılmaktadır.) en uygun modeli seçmek için model seçme kriterleri ve tahmin performansına dayalı olarak karşılaştırılmıştır. Daha sonra TGARCH modeli en iyi model olarak seçilmiş ve böylece Nijerya menkul kıymetler borsası oynaklığı serileri bu şekilde oluşturulmuştur. İkinci bölümde, sınır test analizi ko-entegrasyon yaklaşımı ve ARDL modeli uygulanmıştır. Sınır test analizi sonuçları, Nijerya menkul kıymetler borsası oynaklığı ve makro ekonomik değişkenler arasında ko-entegrasyon ilişkisi olduğunu göstermiştir. ARDL model sonuçları ise menkul kıymetler borsası oynaklığının reel GDP ve enflasyon üzerinde kısa ve uzun dönemde Nijerya’da etkisi olmadığını belirtmektedir. Buna karşılık, sonuçlar aynı zamanda kısa dönemde Nijerya menkul kıymetler borsası oynaklığının enflasyon üzerinde önemli pozitif etkisi olduğunu göstermektedir.
Anahtar Kelimeler: Menkul kıymetler borsası oynaklığı, reel GDP denklemi, enflasyon denklemi, ARCH aile modelleri, sınır testleri, ARDL modeli
vi
ACKNOWLEGEMENT
My heartfelt gratitude goes to my late mother, Haj. Zainab Mahmud “May her soul rest in perfect peace amen” and my father, Alh. Ibrahim Muhammad for their encouragements, caring, prayers, moral and financial supports all to see that I become what I am today. I really-really love you and I will never forget your efforts.
My sincere appreciation goes to Kano state government of Nigeria under the leadership of his Excellency, Eng. Dr. Rabi’u Musa Kwankwaso for providing me with full scholarship to undergo this programme.
I am extremely grateful to my supervisor Prof. Dr. Mehmet YAZICI and co-supervisor Dr. Hasan Murat ERTUĞRUL for their constructive comments, encouragements, compliments, as well as untiring guidance and supports from beginning to the end of this thesis.
My special appreciation goes to my one and only brother, Sani (Baba) and my sisters, Haj. A’isha (Yaya), Haj. Salamatu (Mami), Hajara (Azumi), Habiba and Amina and their sons and daughters for their prayers, encouragements and supports.
I would like to thank Dr. Aliyu Mahmud (Ya Alaji), Dr. Mahmud (uncle Datti), Suleman Shehu K.K., Alh. Umar Koringo, Alh. Tijjani Zubairu, Alh. Muhammadu (Maikudi), Eng. Abdurrahman (B. Man) and Alh. Usman (Yango) for their good advice and guidance always.
I would also like to express my gratitude to all my relatives and friends especially my childhood friends Abdulkharim (Papalaje) and Al-Amin (Mukaram) for their prayers and best wishes.
Finally, my thanks go to all my fellow Kwankwasonians especially Çankaya University students.
vii
TABLE OF CONTENTS
STATEMENT OF NON PLAGIARISM……….iii
ABSTRACT………..iv ÖZET……….v ACKNOWLEGEMENT………...vi TABLE OF CONTENTS………..vii LIST OF TABLES………...xi LIST OF FIGURES………...xii LIST OF ABBREVIATIONS………...xiii CHAPTERS: 1. INTRODUCTION……….1 1.1 Background to the Study………...1
1.2 Statement of the Problem………...3
1.3 Objectives of the Study………...4
1.4 Hypothesis of the Study………...5
1.5 Significance of the Study………...5
1.6 Scope of the Study………...5
2. LITERATURE REVIEW………..7
2.1 Introduction………7
2.2 Historical Background of the Nigerian Stock Exchange Market………...7
2.3 Overview of the Nigerian Real GDP and Inflation Performance……….12
viii
2.5 Review of Related Empirical Studies………...17
2.5.1 Stock market volatility and Real GDP………18
2.5.2 Stock market and Macroeconomic variables………..20
2.5.3 The causal relationship between Stock market and Macroeconomic variables………...29
2.5.4 Stock market volatility………32
2.6 Theoretical Framework of Volatility Models………38
2.6.1 The Autoregressive Conditional Heteroskedasticity (ARCH) Model………...39
2.6.2 The Generalized Autoregressive Conditional Heteroskedasticity (GARCH) Model………41
2.6.3 The Exponential GARCH (EGARCH) Model………..42
2.6.4 The Threshold GARCH (TGARCH) Model………..43
3. RESEARCH METHODOLOGY……….45
3.1 Introduction………..45
3.2 Population and Sample of the Study………45
3.3 Data Sources and Method of Data Collection...46
3.4 Data Description………...46
3.5 Econometric Methodology………...48
3.6 Justification of the Econometric Methodology Employed………...49
3.7 Model Specification………..51
3.7.1 Volatility model………..51
3.7.2 Unrestricted Error Correction model (UECM) for Bound test Co-integration Analysis………....52
3.7.3 ARDL model………..54
ix
4. EMPIRICAL RESULTS, ANALYSIS AND DISCUSSIONS………57
4.1 Introduction………..57
4.2 Part-One………...57
4.2.1 Unit root tests………57
4.2.2 Model selection………..59
4.2.2.1 ARCH model estimation result………..60
4.2.2.2 GARCH model estimation result………...61
4.2.2.3 EGARCH model estimation result……….62
4.2.2.4 TGARCH model estimation result……….63
4.2.2.5 Comparison of the models………..64
4.3 Part-Two………....66
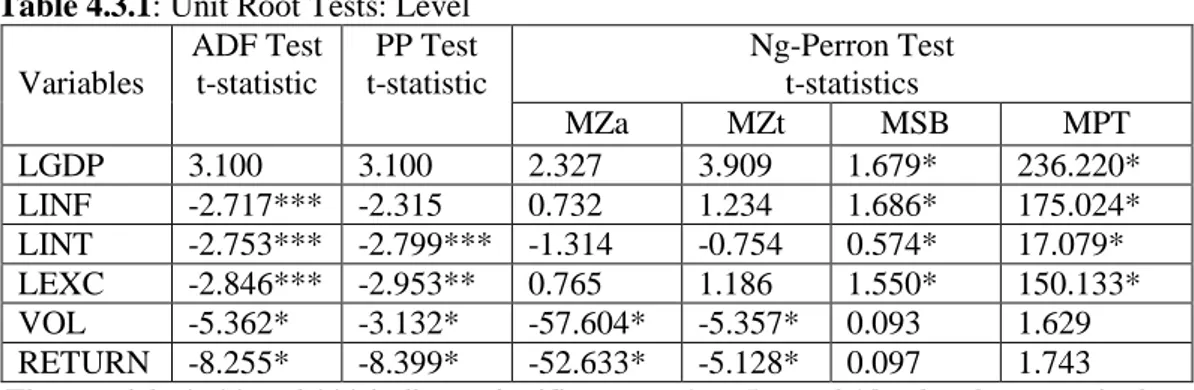
4.3.1 Unit root tests……….67
4.3.2 Bounds tests co-integration approach……….68
4.3.2.1 Co-integration analysis for Real GDP equation……….69
4.3.2.2 Co-integration analysis for Inflation equation………....71
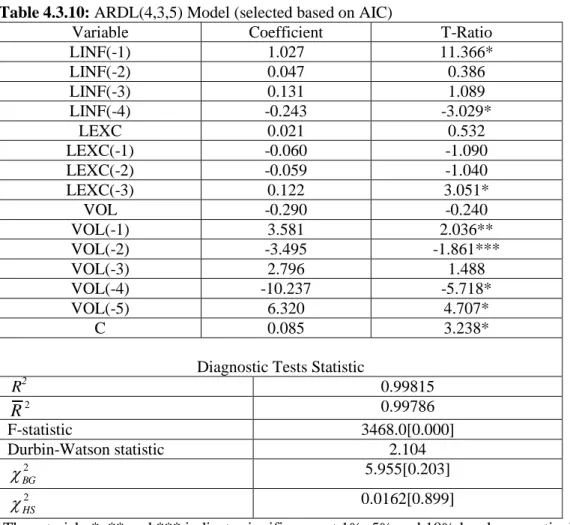
4.3.3 ARDL model………...72
4.3.3.1 Model estimates for Real GDP equation………....73
4.3.3.1.1 Long-run coefficients of Real GDP equation……..74
4.3.3.1.2 Short-run coefficients of Real GDP equation (ECM version of ARDL model)………..76
4.3.3.2 Model estimates for Inflation equation………...77
4.3.3.2.1 Long-run coefficients of Inflation equation……….79
4.3.3.2.2 Short-run coefficients of Inflation equation (ECM version of ARDL model)………..79
5. SUMMARY, CONCLUSION AND RECOMMENDATIONS………..82
x 5.2 Conclusions………...83 5.3 Recommendations……….84 REFERENCES………...86 APPENDICES………93 CV………...96
xi
LIST OF TABLES
TABLES
Table 4.2.1: Unit Root Tests………...58 Table 4.2.2: Models Estimation Results………64 Table 4.2.3: Comparison of the Models base on Model Selection Criterion……….65 Table 4.2.4: Comparison of the Models base on their In-sample Forecast
Performance for ASI series……….65 Table 4.2.5: Comparison of the Models base on their Out-sample Forecast
Performance for ASI series……….66 Table 4.3.1: Unit Root Tests: Level………67 Table 4.3.2: Unit Root Tests: First Difference………...68 Table 4.3.3: Determination of Appropriate Lag Length for Equation (8)………….70 Table 4.3.4: Bounds Test Results for Real GDP equation………..70 Table 4.3.5: Determination of Appropriate Lag Length for Equation (9)………….71 Table 4.3.6: Bounds Test Results for Inflation Equation………...72 Table 4.3.7: ARDL(7,0,0,0,0) Model (selected based on AIC)……….73 Table 4.3.8: Estimated Long-run Coefficients of Real GDP Equation
based on ARDL(7,0,0,0,0) Model and AIC………...74 Table 4.3.9: Error Correction Representation for ARDL(7,0,0,0,0) Model based on AIC(Estimated short-run coefficients of real GDP equation )……..76 Table 4.3.10: ARDL(4,3,5) Model (selected based on AIC)……….78 Table 4.3.11: Estimated Long-run Coefficients of Inflation Equation
based on ARDL(4,3,5) Model and AIC………...79 Table 4.3.12: Error Correction Representation for ARDL(4,3,5) Model based on AIC(Estimated short-run coefficients of Inflation equation )…...80
xii
LIST OF FIGURES
FIGURES
Figure 1: Trend in Monthly NSE-All Share Index from 1985M1-2012M12……….11 Figure 2: Trends in seasonally adjusted quarterly real GDP level (N’ Million)
and growth rate [quarterly change in Real GDP (%)], 1985Q1-2012Q4…13 Figure 3: Trends in seasonally adjusted quarterly Inflation (CPI) and
Inflation rate [quarterly change in CPI (%)], 1985Q1-2009Q4………….15 Figure 4: Monthly Nigerian Stock Market Volatility from 1985M1-2012M12……17
xiii
LIST OF ABBREVIATIONS
ABBREVIATIONS MEANING
AIC Akaike Information Criterion
AR Autoregressive
ARCH Autoregressive Conditional Heteroskedasticity
ARDL Autoregressive Distributed Lag
ARMA Autoregressive Moving average
ASI All Share Index
CBN Central Bank of Nigeria
CPI Consumer Price Index
EGARCH Exponential GARCH
ECM Error Correction model
ECT Error Correction Term
GARCH Generalized Autoregressive Conditional
Heteroskedasticity
LASI Logarithm of All Share Index
MA Moving average
NSE Nigerian Stock Exchange
SC Schwarz Criterion
TGARCH Threshold GARCH
UECM Unrestricted Error Correction model
1 CHAPTER 1 INTRODUCTION
1.1 Background to the Study
Stock market has been seen as a complex institution infused with inherent mechanism through which the long-term funds of the major economic sectors such as households, government and firms are mobilised, harnessed and made available to various sectors of the economy [Nyong, 1997, as cited in Petros (2011)]. It is of great concern to the government, investors as well as other stakeholders (Olweny and Omondi, 2011), and it plays an important role in financial intermediation in both developed and developing countries (Lawal and Okunola, 2012; Govati, 2009). That is, it helps in channelling funds from surplus savings units to deficit units in the economy and ensures that the savings of the surplus units are mobilized and efficiently allocated so that it can assist in enhancing capacity utilization as well as promoting productive activities and consequently leading to economic growth and development in the country (Lawal and Okunola, 2012; Alajekwu and Achugbu, 2012).
A well-operating stock market helps a lot in reducing the principal agent problem as well as information asymmetry, thereby boosting an efficient allocation of resources and growth (Olweny and Kimani, 2011).
Stock market has also been seen as a place where most elements that could lead to country’s economic development are working with one another (Oseni and Nwosa, 2011). It contributes to the nation’s economic development by enhancing the liquidity of the capital market (Adenuga, 2010).
Stock market plays an important role in shaping the economic and political development of a country. The collapse of stock market always causes financial crisis which consequently lead to economic recession (Oseni and Nwosa, 2011).
Stock exchange and banking system work collectively to achieve the macroeconomic objective of the country. Therefore, the overall economic development of a country is a function of how well the stock market performs
2
(Lawal and Okunola, 2012). Also, Ali et al. (2010) states that activity in the stock exchange plays an important role in assisting to determine the effects of macroeconomic activities.
However, an important issue in the stock market which deserved special consideration is the issue of volatility, the existence of which may undermine the ability of stock markets to promote an efficient allocation of investment (Arestis et al., 2001).
Volatility refers to sharp fluctuations in the price of a financial asset or market in a short period of time. In other words, stock volatility can be defined as the possibility that a given stock will experience a drastic rise or fall in value within a predetermined time period (Okpara, 2011).The main problem of stock price fluctuations affecting stock market efficiency is destructive excess volatility that causes stock market crashes and or crisis (Goudarzi and Ramanarayanan, 2011).
Furthermore, stock market volatility is an un-diversifiable risk (i.e. systematic risk) faced by the investors holding a market portfolio- for example, stock market index fund (Guo, 2002).
Volatility is considered as an important concept in many economic and financial applications (Ahmed and Suliman, 2011). Rano (2010) states that volatility breads uncertainty, which impair effective performance of the financial sector as well as the entire economy at large. According to Bhowmik (2013) a very high degree of stock market volatility induces instability in the capital market, destabilize the value of currency and hampers international trade and finance. It is also proposed by some researchers that the raised stock market volatility might decrease future economic activity (Guo, 2002). Suleiman (2011) also states that stock market volatility affects business investment and economic growth.
According to Bhowmik (2013) there is a negative relationship between stock market volatility and growth rate of a country, i.e., a higher volatility decreases growth rate. He clearly shows evidence for the existence of such relationship using graph by plotting the U.S quarterly percentage growth of real GDP on Y-axis and U.S stock market volatility on X-axis. He also states three channels through which the stock market volatility may affect GDP growth as per the existing literature, such channels include; (1) its (stock market volatility) link with market uncertainty and thus economic activity, (2) association between stock market volatility and structural
3
change (which consumes resources) in the economy, and (3) through cost of capital channel – that is, a rise in stock market volatility will make shareholders to demand higher reward for bearing systematic risk. And the higher expected return by the shareholders will result in the higher cost of capital in corporate sector, which consequently reduces investment and real GDP (Guo, 2002).
Similarly, Okpara (2011) states a mechanism through which the stock market volatility may affect inflation rate- that, the stock market volatility may result in portfolio adjustment which change the prices and returns of other financial assets. In addition to this, the prices of real goods and services will also go up and this may lead to a high rate of inflation resulting from supply shortage. But according to him, the working of this channel will, however, depend on how the investors are compensated for bearing the risk on the economy.
According to Kupiec (1991) stock market volatility may indirectly effects real economy through its effects on consumer and investor expectations. A rise in stock market volatility may cause a loss of consumer confidence and affect real consumption and investment decisions indirectly. Also, as stated in Petros (2011), the higher level of stock market volatility in less developed countries decreases the efficiency of the price signal in allocating investment resources.
Lastly, Mushtaq et al. (2011) state that the stock volatility has had large impact on the economic condition of a country, policy makers, financial managers, firms, investors as well as on other stakeholders.
Against the above background, this study attempts to investigate the impact of stock market volatility on macroeconomic variables (specifically, on real GDP and inflation) in Nigeria from 1985Q1-2012Q4.
1.2 Statement of the Problem
Although, the stock market plays a significant role in ensuring that the funds from surplus savings units are mobilized and efficiently allocated to various sectors of the economy, which helps in achieving economic growth and development in both developed and developing countries. The existence of volatility in such market may hinder the stock market from playing such a role properly. Suleiman (2011) states that volatility may impair the smooth functioning of the stock market and negatively affect economic performance.
4
The existence of excessive volatility may lead to an inefficient allocation of resources, increase pressures on interest rates in view of higher uncertainty, hampering both quantity and productivity of investment and consequently reducing growth [Federer 1993; Delong et al., 1989, as cited by Arestis et al. (2001)].
According to Verma and Mahajan (2012) if the country’s stock market is highly volatile, the probability of both domestic and foreign investors to invest in such market is going to be less. This is because the returns in such market are liable to higher risk. And this may affect the economic growth of that country.
Schwert (1989) suggests that stock market volatility could be used as an additional factor in assessing the state of the economy.
In Nigeria, the recent problem faced by the stock market(financial crisis) caused many industrialized economies suffered a significant decrease in economic activity, therefore, one can authoritatively say that the stock market volatility is the most important factor in the economic growth in both developed and less developed countries like Nigeria (Oseni and Nwosa, 2011).
According to Bhowmik (2013) some recent studies show that a rise in stock market volatility depresses economic activity and output.
As the empirical findings of some studies such as, Ahmed (2009); Olowe (2009); Emenike (2010); Suleiman (2011); Okpara (2011); Onwukwe et al. (2011); Emenike and Aleke (2012); Babatunde(2013) and Ezepue and Omar (2013) show evidence of high and persistence volatility in the Nigerian stock market, and this according to Babatunde (2013) might distort growth of the economy. Therefore, this study intends to investigate whether the stock market volatility has any significant impact on macroeconomic variables in Nigeria. Specifically, the study attempts to examine whether the Nigerian stock market volatility has any significant impact on real GDP and inflation.
1.3 Objectives of the Study
This thesis focuses on the relationship between stock market volatility and macroeconomic variables in Nigeria. It utilizes quarterly time series data from 1985Q1-2012Q4 to achieve the following objectives;
i. To examine whether there exists any long run co-integration relationship between Nigerian stock market volatility and macroeconomic variables
5
ii. To investigate the long-run and short run impact of stock market volatility on real GDP in Nigeria.
iii. To find out the long run and short run impact of stock market volatility on inflation in Nigeria.
1.4 Hypothesis of the Study
Based on the above objectives, the following hypothesises are formulated for testing in this study;
H01: There exists no long run co-integration relationship between stock market volatility and macroeconomic variables in Nigeria
H02: The Nigerian stock market volatility does not have any significant impact on real GDP in both long run and short run.
H03: The Nigerian stock market volatility does not have any significant impact on inflation in both long run and short run.
1.5 Significance of the Study
The findings of this thesis would help in alerting the policy makers on the effects that the existence of volatility in the stock market could have on the key macroeconomic variables, which might negatively affect the performance of the entire economy as well as impairing the smooth functioning of the market. Thus, this thesis could be of great significance to the Nigerian government. The results are also of great benefit to the stock market regulatory bodies, investors and other market players, domestic and international security analysts, as it can help them to know the degree of volatility presence in the Nigerian stock market. Lastly but not the least, the thesis is also of great benefit to the future researchers, as it would serve as a reference material to them.
1.6 Scope of the Study
This thesis only attempts to examine the effect of stock market volatility on macroeconomic variables in Nigeria. It does not in any away attempt to investigate the effects of volatility in other financial market (such as bound, derivative markets etc.) on macroeconomic variables in Nigeria. Also, the study only examines the
6
effects of such volatility on macroeconomic variables, but not on microeconomic variables. However, the empirical investigation of such effect is limited to the period 1985-2012, this is because the variable (i.e. ASI) used to represents the Nigerian stock market index was introduced in 1984.
7 CHAPTER 2 LITERATURE REVIEW
2.1 Introduction
This chapter provides a historical background of the Nigerian stock exchange market, an overview of the real GDP and inflation performance as well as the Nigerian stock market volatility. It also provides a review of related empirical literature and theoretical framework of the volatility models.
2.2 Historical Background of the Nigerian Stock Exchange Market
The history of the Nigerian stock exchange (NSE) dates back to 15th of September, 1960, when the Lagos stock exchange was established, which began its operation on 5th June, 1961 with 19 securities listed on its floor for trading. In December 1977, it was renamed as the Nigerian Stock Exchange (NSE). Presently, the exchange has 13 branches spread across the key cities of Nigeria, with its head office located in Lagos state. Such cities include; Abuja, Abeokuta, Bauchi, Benin, Ibadan, Ilorin, Kaduna, Kano, Onitsha, Owerri, Uyo, Port-Harcourt, and Yola. Each of these branches has electronic trading floor. Moreover, the exchange currently has about 258 listed securities, which comprise of equities, corporate bonds/debentures, federal government bonds, state and municipal bonds, exchange traded fund and supranational bond, and also has about 200 listed companies in twelve diverse sectors, including several global brands (NSE- FAQs; NSE-Gateway to African Markets; NSE-Q3 2013 Fact Sheet). The NSE has two Equities markets: First tier securities market (the Main Board) and Second tier securities market [Alternative Securities Market Board (ASeM)]. The second tier securities market (i.e. ASeM) was established by exchange in 1985 in order to help the Nigerian small and medium companies with high potential of growth to raise long-term capital at relatively low cost from the market (NSE-FAQs; Chigozie, 2009). The difference between the two
8
equities market segments: the Main Board and the ASeM, can be seen in their listing requirements.
The general requirements for listing on either of the two markets (Boards) are as follow:
1. The company must be a public limited liability company
2. The date of company’s last audited financial statements must not exceed nine months
3. The application for listing will only be accepted if sponsored by a dealing member of the exchange.
4. A maximum of 10% of an offering will be allowed to staffs of a company or its associated or subsidiaries companies
5. The securities must be fully paid-up at the time of allotment
6. After being listed on either of the two boards, the company can raise unlimited amount of capital from the general public, subject to the borrowing power of the directors of the company. And
7. The company must every year submit quarterly, semi-annual and annual financial statement
However, the following additional requirements for listing on the two markets differ:
1. For a company to be listed on the Main Board, it must have been in operation for a minimum of three years. Whereas, only a minimum of two years the company is required to have been in operation before listing on the ASeM, and must also provide a comprehensive business plan covering not less than two years periods.
2. For a company to be quoted on the Main Board, a minimum of 20% of company’s issued share capital must be offered to the general public. While in the case of ASeM, the company is required to make only a minimum of 15% of its issued share capital available to the public.
9
3. The companies that are quoted on the Main Board are required to pay an annual quotation fees based on the market capitalization. While a flat annual quotation fee of ₦200,000 is required to be paid by the companies listed on the ASeM.
4. To be quoted on the Main Board, the number of company’s shareholders must be at least 300. While in the case of ASeM, the number of company’s shareholders must reach at least 51.
5. Before listing on the Main Board, the company must have a minimum of ₦3billion shareholders’ equity. While this requirement is not applied on any company that want to be listed on the ASeM. (NSE-Green Book; NSE- FAQs)
The NSE maintains All Share Index (ASI), which was introduced since 3rd January, 1984 with 100 points base value. The ASI is a market capitalization weighted index. The index includes only fully paid ordinary shares of all the companies listed on the NSE. Therefore, it tracks the general market movement of all quoted equities on the Exchange (NSE). Initially, the index stood at 111.3 points in January 1985. Since then, it has been increasing slightly, until June 1985, when it fell to 116.3 points. From July 1985 to June 1988 the index fluctuated between 116.9 and 206 points, and then rose to 211.5 points in July 1988. It keeps on increasing until May 1989 when it declined to 257.1 points and then continue increasing for three months before it fell again to 279.9 point in September 1989, and then began to rise again. This increasing trend lasted for over three years. After reaching its peak points of 65652.38 in February 2008, in the next month i.e. march 2008, the index starts diminishing up to December 2009 except for February, April and March of 2009 were some positive changes are recorded in the index. It was ended with 28078.81 points as at December 2012. Figure 1 below, shows the trend in the NSE-ASI from 1985M1-2012M12.
During the period under review, the NSE went through a number of developmental stages and challenges, ranging from the indigenization policy in 1977, financial system deregulation in 1986, privatization of some public companies in
10
1988, internationalization of the Nigerian capital market in 1995 to banking sector consolidation spanning between 2005 and 2007 (Rano, 2010; Chigozie,2009).
In a moved to make the market more efficient and transparent, the exchange had since 27th April, 1999 introduced Automated Trading System (ATS), with bids and offers now matched by the dealers/stockbrokers on the trading floors of the market through a network of computers connected to a server. In order to achieve an online global dissemination of stock market information such as All Share Index, trading statistics, company news (corporate actions and accounts statements) and investment ratios of the companies, the exchange link-up with the Reuters Electronic Contributor system since 2nd June of 1987.
Before the deregulation of the capital market in 1993, the legislations such as Exchange Control Act 1962 and the Nigerian Enterprise Promotion Decree 1989 restricted the participation of foreigners in the Nigerian capital market regarding to the percentage of share they could have in the quoted companies as well as serving as operators in the market. After the deregulation of the market in 1993, the Nigerian government internationalized the capital market in 1995, with the abolition of those legislations that constrained the participation of foreigners in the market. Consequently, the foreigners can presently participate in the Nigerian stock market both as operators and investors without any limit. In order to meet the challenges of internationalization and enhance the service delivery, the NSE launched its internet system; CAPNET (intranet facility), in November 1996.
The transactions on the NSE are regulated by the Securities and Exchange Commission (SEC), which is a government agency mandated to regulate and develop the Nigerian capital market. In the process of regulating the market, the commission undertakes various activities that will provide adequate protection to investors as well as the market operators and also ensure market integrity (SEC-Website). Furthermore, the NSE as a self-regulatory organization (SRO) also regulates the transection in the market.
The prices of new securities (e.g. stocks) are determined by the issuing houses and stockbrokers, whereas the prices of the stocks on the secondary market are made only by the stockbrokers. The quoted prices together with the All Share Index and other NSE Indices are published every day in the NSE-CAPNET, The
11
Stock Exchange Daily Official List, Newspapers, the NSE website and on the stock market page of the Reuters Electronic Contributor System (Wikipedia, 2014).
The Clearing, Settlement and Delivery of the market’s transactions are done electronically by the associate company to The NSE, Central Securities Clearing System (CSCS) Plc, which serves as a clearing house of the exchange and also offers custodian services (NSE-FAQs).
The Nigerian Stock Exchange is currently an observer at meetings and affiliate member of the International Organization of Securities Commissions (IOSCO), an affiliate member of the World Federation of Exchanges (WFE), a founding member and executive committee member of the African Securities Exchanges Association (ASEA), as well as a foundation member of the World Economic Forum (WEF) (NSE-FAQs). Furthermore, it is also the leading exchange in West Africa, the second largest financial centre in sub-Saharan Africa and the third largest stock exchange by capitalisation in Africa (NSE website).
Figure 1: Trend in Monthly NSE-All Share Index from 1985M1-2012M12 Source: Drawn using Data extracted from 2012- CBN Statistical Bulletin
0
10000
20000
30000
40000
50000
60000
70000
86 88 90 92 94 96 98 00 02 04 06 08 10 12
12
2.3 Overview of the Nigerian Real GDP and Inflation Performance
The performance of real GDP and inflation over the sample period are briefly discussed below.
Real GDP
The average quarterly real GDP of ₦115,176.4989 million with an average growth rate of 1.71% were recorded over the sample periods (1985Q1-2012Q4). Initially, in the first quarter of 1985, the amount stood at ₦63,303.301 million. This was slightly fell to ₦63,021.689 million in the second quarter of the same year, which was the minimum amount of real GDP ever recorded during the period under review, indicating a negative growth rate of -0.44%. The amount was slightly rose to ₦63,095.2001 million and then to ₦63,593.08178 million, showing a positive quarterly growth rate of 0.12% and 0.79% in the third and fourth quarter of the same year, respectively. Since then, the quarterly growth rates of real GDP have been fluctuating over the period. The highest growth rate recorded during the sample period was 21.77% in the third quarter of 2010 with its level real GDP amount stood at ₦212,771.6788 million. Compared to this, the growth rate of the preceding quarter and corresponding quarter of the preceding year i.e. 2009, were 9.13% and 21.58% with their level real GDP amounted to ₦174,733.9713 million and ₦197,084.3269 million, respectively. However, within periods, the economy experienced the lowest quarterly growth rate of -26.10% in the first quarter of 2012, showing level real GDP of ₦182,119.4361 million, which was far lower than the growth rate of 7.88% (with level GDP-₦246,447.0951 million) recorded in the preceding quarter and slightly less than the one recorded in the corresponding quarter of the preceding year i.e. -25.12% in 2011, but higher than its level GDP amount of ₦171,265.8567 million. The peak amount of the level real GDP during the periods was reached in the last quarter of 2012 i.e. fourth quarter, which stood at ₦263,678.9108 million, higher than ₦243,263.0954 million and ₦246,447.0951 million recorded in the third quarter of the same year and corresponding quarter of the preceding year i.e. 2011, respectively. However, its growth rate of 8.39% is lower than 21.73% recorded in the preceding quarter (i.e. 3rd quarter of 2012). The trends in seasonally adjusted
13
quarterly real GDP level and growth rate are shown in panels (a) and (b) of figure 2, respectively.
Panel -(a)
Source: Drawn using 2012-CBN Statistical Bulletin Data
Panel-(b)
Figure 2: Trends in seasonally adjusted quarterly real GDP level (N’ Million) and growth rate [quarterly change in Real GDP (%)], 1985Q1-2012Q4
Source: Computed and Drawn by author using 2012-CBN Statistical Bulletin Data
0 50000 100000 150000 200000 250000 1 9 8 5 Q1 1 9 8 6 Q3 1 9 8 8 Q1 1 9 8 9 Q3 1 9 9 1 Q1 1 9 9 2 Q3 1 9 9 4 Q1 1 9 9 5 Q3 1 9 9 7 Q1 1 9 9 8 Q3 2 0 0 0 Q1 2 0 0 1 Q3 2 0 0 3 Q1 2 0 0 4 Q3 2 0 0 6 Q1 2 0 0 7 Q3 2 0 0 9 Q1 2 0 1 0 Q3 2 0 1 2 Q1 R ea l GDP ( N' Millio n ) Year/Quarter
Quarterly Real GDP (N' Million)
Real GDP (N' Million) -4 -2 0 2 4 6 8 1 9 8 5 Q1 1 9 8 6 Q3 1 9 8 8 Q1 1 9 8 9 Q3 1 9 9 1 Q1 1 9 9 2 Q3 1 9 9 4 Q1 1 9 9 5 Q3 1 9 9 7 Q1 1 9 9 8 Q3 2 0 0 0 Q1 2 0 0 1 Q3 2 0 0 3 Q1 2 0 0 4 Q3 2 0 0 6 Q1 2 0 0 7 Q3 2 0 0 9 Q1 2 0 1 0 Q3 2 0 1 2 Q1 Gr o w th Rat e (% ) Year/Quarter
Quarterly Real GDP Growth rate (%)
Real GDP Growth rate (%)
14 Inflation
Over the period of 1985Q1-2009Q4, the average quarterly inflation rate (percentage change in quarterly CPI) was recorded at 5.08%, whereas, the average quarterly CPI (as a measure of inflation) stood at 67.41 index points. The index was slightly rose by 0.39% in the second quarter of 1985 from 1.96 index points recorded in the first quarter. The inflation rate fell from 0.39% recorded in second quarter of 1985 to -2.46% and then to -1.31% in the third and fourth quarters of the same year, respectively. It declined further to -0.10% in the first quarter of 1986 and then accelerated to 7.05% in the second quarter and slightly fell again to 6.97% and largely to -0.62% in third and fourth quarter of 1986 respectively. It keeps on fluctuating before reaching peak of 31.26% in the first quarter of 1988. However, the least quarterly inflation rate over these periods (1985Q1-2009Q4), stood at -5.98%, which was recorded in the fourth quarter of 2005. Over these periods, the highest CPI (inflation) points were recorded at 215.6 in the last quarter of 2009, which was 1.51% higher than that of preceding quarter. While the least CPI was recorded at 1.89 index points in the first quarter of 1986, which was 0.10% lower than that of the preceding quarter. The trends in seasonally adjusted quarterly inflation, proxy by CPI, and inflation rate (quarterly change in CPI (%)) are shown in panels (a) and (b) of figure 3, respectively.
15 Panel-(a)
Source: Drawn using 2009-CBN Statistical Bulletin Data
Panel-(b)
Figure 3: Trends in seasonally adjusted quarterly Inflation (CPI) and Inflation rate [quarterly change in CPI (%)], 1985Q1-2009Q4
Source: Computed and Drawn by author using 2009-CBN Statistical Bulletin Data
0 50 100 150 200 250 19 85 Q1 19 86Q2 19 87Q3 19 88Q4 19 90Q1 19 91Q2 19 92Q3 19 93Q4 19 95Q1 19 96Q2 19 97Q3 19 98Q4 20 00Q1 20 01 Q2 20 02Q3 20 03Q4 20 05Q1 20 06Q2 20 07Q3 20 08Q4 In flatio n ( C P I p o in t) Year/Quarter
Quarterly Inflation (CPI)
INFLATION -5 0 5 10 15 20 25 1 9 8 5 Q1 1 9 8 6 Q2 1 9 8 7 Q3 1 9 8 8 Q4 1 9 9 0 Q1 1 9 9 1 Q2 1 9 9 2 Q3 1 9 9 3 Q4 1 9 9 5 Q1 1 9 9 6 Q2 1 9 9 7 Q3 1 9 9 8 Q4 2 0 0 0 Q1 2 0 0 1 Q2 2 0 0 2 Q3 2 0 0 3 Q4 2 0 0 5 Q1 2 0 0 6 Q2 2 0 0 7 Q3 2 0 0 8 Q4 Infla tio n r at e (∆ in CP I %) Year/Quarter
Quarterly Inflation Rate [Q-change in CPI(%)]
Inflation Rate (%)
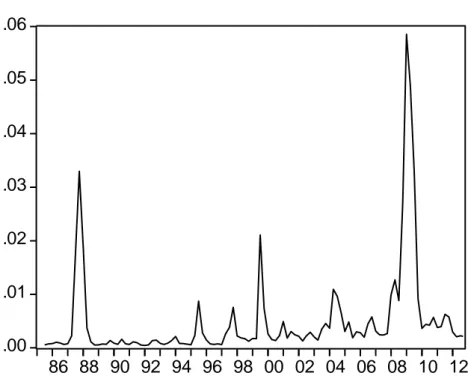
16 2.4 Nigerian Stock Market Volatility
Figure 4 below, shows monthly volatility of the Nigerian stock market over the sample periods (1985M1-2012M12), which were derived from the TGARCH(1,1) model estimated for the ASI series using EViews 5.0. It can be observed from the figure that the market experienced higher level of volatility during the period of 1986-1988, 1995, 1999, 2004-2006 and 2008-2009. The higher volatility recorded from the end of 1986 to 1988 could be attributed to the financial system deregulation in 1986 and privatization of some public companies in 1988. The occurrence of higher volatility in 1995 could said to be as a result of internationalization of the Nigerian capital market by the Federal Government of Nigeria in 1995, which enable the foreigners to fully participate in the Nigerian capital market whether as operators or investors without any restriction regarding to the percentage of shares they could hold in the registered companies in Nigerian. This attracts more investment into the stock market. Whereas, the higher volatility in 1999 could be attributed to the positive inflow of the foreign portfolio investment into the Nigerian capital market in 1999 after being negative for about nine years (spanning 1989-1998). While, the higher volatility recorded in the market from 2004-2006 could be attributed to the banking reforms in July 2004 as well as the insurance reforms in September 2005. In July 2004, the Central Bank of Nigeria (CBN) required the Nigerian banks to increase their capital base from ₦2 billion to a minimum of ₦25 billion. Similarly, in September 2005, the insurance and reinsurance companies were required by the Nigerian government to increase their capital base to the minimum of ₦2 billion, ₦3 billion, ₦5 billion and ₦10 billion for life insurance companies, non-life insurance companies, composite insurance companies and re-insurers respectively. In the process of meeting-up with these capital requirements, both of those banks and insurance companies that survived raised substantial part of such capital from the capital market. Finally, the extremely highest level of volatility experienced by the market within the sample periods was recorded between 2008 and 2009, and this could be attributed to the Nigerian stock market crash since March 2008 up to December 2009 coupled with the well-known global financial crisis of 2008. Since March 2008 up to December 2009, the prices of stock on the Nigerian stock market
17
have been falling, which also lead to decline in the ASI as well, (although there were some positive changes in the index in February, April and March of 2009).
Figure 4: Monthly Nigerian Stock Market Volatility from 1985M1-2012M12
Source: Derived from TGARCH (1,1) model estimated for ASI series by author
using EViews 5.0
2.5 Review of Related Empirical Studies
A number of empirical studies have been conducted to examine the relationship between stock market and macroeconomic variables. Only few of these studies examine the effect of stock market volatility on real GDP. Whereas other studies focus on the effect of macroeconomic variables or their volatility on stock market index, returns or volatility, other group of the studies focus on the impact of stock market development or performance on macroeconomic variables, and another group of the studies focus on the causal relationship between macroeconomic variables or their volatility and stock market index, returns or volatility. These studies apply various econometric methods such as: ARCH family models, VAR models VECM, Granger causality test, OLS, Impulse Response Function, Variance
.00
.02
.04
.06
.08
.10
86 88 90 92 94 96 98 00 02 04 06 08 10 12
18
Decomposition etc. However, only few of such studies have been conducted for African countries in general and Nigeria in particular.
2.5.1 Stock market volatility and Real GDP
Some few empirical studies that attempt to examine the effect of stock market volatility on real GDP are briefly reviewed below:
Arestis et al. (2001) investigate the relationship between stock market development and economic growth in five developed countries; Germany, Japan, U.S, France and U.K, while controlling for the effects of stock market volatility and banking system. They use quarterly data on real GDP, sock market development (measure by the stock market capitalization ratio), stock market volatility and the indicators of banking system development for all the five countries and apply VAR framework. Their findings indicate among other, that the stock market volatility has negative and significant effect on real GDP in Japan, France and U.K, while in the case of Germany; the stock market volatility has positive but insignificant effect on real GDP.
Guo (2002) investigates the link between stock market returns and volatility and later examines their relative forecasting power for real GDP growth. He uses the squared deviations of daily returns as a measure of stock market volatility, and employs OLS to regress one-quarter-ahead of real GDP growth on the one period lagged real GDP growth, excess stock market return, stock market volatility and their one quarter lags respectively. The results show that while the stock market return affects real GDP growth positively, the stock market volatility affects it negatively. The results suggest further that both the stock market returns and volatility have significant forecasting ability for real GDP growth. Based on this, he concludes that stock market volatility forecasts real GDP growth because volatility affects the cost of capital through its link with the expected stock market returns. However, the author failed to use ARCH family models to estimate the stock market volatility. Similarly, in their study titled “Have individual stock become more volatile?”, Campbell et al. (2001) examine whether the three components of volatility i.e. stock market, industrial and firm-level volatility have any significant power to forecast real GDP growth, using OLS regression with the real GDP growth as dependent variable while the lags of GDP growth, CRSP index returns and the three components of
19
volatility series as regressors. The results show that all the volatility series are negatively correlated with the GDP growth and also have significant forecasting power for it (real GDP growth).
Valadkhani and Chen (2014) examine the impact of U.S stock market and output growth volatility on those of three Anglo-Saxon countries: U.K, Australia and Canada, using quarterly data of stock market price indexes and real GDP growth covering the period 1961Q1-2013Q1 for all the three countries. Firstly, the authors apply GARCH model to generate the stock market and real GDP growth volatility series for all the four countries, and then use them in the second part of the analysis to examine the effect of the U.S stock market and real GDP growth volatility on those of the three countries, using Markov switching model. Their findings reveal that the U.S stock market volatility has significant influence on the real GDP growth volatility for both Australia and U.K, and also significantly affects the stock market volatility of all the three countries. However, the findings also indicate that the U.S real GDP growth volatility has significant impact on Canada’s output volatility only, and does not have any influence on the stock market volatility of both the three countries.
Beetsma and Giuliodori (2011) explore the relationship between stock market volatility, real GDP growth and its major components (consumption and investment growths) in U.S. That is, they examine how the stock market volatility shock affect U.S GDP growth and its major components (consumption and investment growth), using long period quarterly data from 1950Q2-2011Q2. They apply VAR framework through Variance Decomposition and Impulse Response Function analysis, and use variables such as real GDP growth, inflation, federal funds rate, stock market volatility (proxy by Dow-jones index volatility) and stock market return (proxy by return on Dow-jones index). They later replaced the real GDP with the consumption and investment growths in the VAR system to see how the stock market volatility shock affects them (as major components of GDP). Their results indicate that the GDP growth responded negatively to stock market volatility shock. They also confirmed that an increase in U.S stock market volatility lead to slowdown of both U.S real GDP growth as well as its major components (i.e. consumption and investment growths). However, the authors failed to use any one of the volatility models (i.e. ARCH family models) to generate the volatility series for their analysis.
20
Instead, they used a sample standard deviation as a measure of volatility, which is unconditional and does not capture some characteristic of volatility.
2.5.2 Stock market and Macroeconomic variables
In this sub-section, our empirical literature review briefly focuses on: the empirical literature that examine the effect of macroeconomic variables or their volatility on stock market index, returns or volatility and the literature that investigate the impact of stock market development or performance on macroeconomic variables.
In Nigeria, some few researchers examine the relationship between stock market and macroeconomic variables. For instance, Olasumbo (2012) examines the impact of macroeconomic variables on the Nigerian stock market index using All Share Index as a proxy. The macroeconomic variables employed in the study comprise of interest rate, inflation, exchange rate and real GDP. She utilises the annual time series of these variables from 1991 to 2010 and applies multiple regression model. The result of the regression indicates that the selected macroeconomic variables explain 93.4% of the variation in the All Share Index. The results also show that interest, inflation and exchange rates have negative impact on the All Share Index while the real GDP has positive impact on it. Izedonmi and Abdullahi (2011) obtain contrasting results after utilising three macroeconomic variables: inflation rate, exchange rate and market capitalization and the stocks of sixty firms from twenty different sectors in the Nigerian stock exchange market. They use monthly data for the period 2000 to 2004 to analyse the effects of macroeconomic factors on the Nigerian stock market returns. They conclude that the selected macroeconomic factors have no significant influence in the Nigerian stock exchange market.
Rano (2010) investigates whether inflation has any impact on stock returns and volatility in the two West African countries: Nigeria and Ghana, using monthly time series data (for stock market indices and inflation rates) covering the period 1998M1-2010M5 and 1999M12-2010M5 respectively. Because of the nonlinearity of these series according to him, the study adopts step-wise approach; firstly, the standard linear GARCH (1,1) model is applied to capture the stock returns volatility and then Quadratic GARCH (QGARCH) model is applied to test nonlinearities in the
21
effect of asymmetric information. The results reveal that bad news has larger impact on stock market volatility than good news in Nigerian case while the opposite holds in the case of Ghana and that the inflation rates and its 3-month average have significant effect on stock market volatility in both two countries.
Olugbenga (2011) attempts to distinguish his study from the previous studies on the relationship between stock price and macroeconomic variables by using microeconomic approach instead of macroeconomic approach that have been used in the preview studies. Hence, he examines the impact of macroeconomic variables on 36 selected stock prices out of 93 equity stocks as at 1985 in the Nigerian stock market, instead of on stock market All Share Index that have been used in the previous papers. The six macroeconomic variables used in the study include: inflation rate, exchange rate, broad money supply, interest rate, oil price and GDP. The study uses quarterly data on the selected firm’s stock price and the aforementioned macroeconomic variable covering period 1985:1-2009:4 and applies panel model. The results indicate that all the macroeconomic variables used in the study have significant impact on stock price in Nigeria except for inflation rate and money supply and that the impact of the variables on the individual firm’s stock price varies.
Adenuga (2010) hypothesizes that stock market development promotes economic growth in Nigeria. To confirm the validity of this hypothesis or otherwise, he uses quarterly data on indicators of stock market development and economic growth (proxied by the rate of change in real GDP) from 1990:1 to 2009:4, and employs Johansen co-integration and VECM techniques. The results confirm that the stock market development promotes economic growth in Nigeria over the sample period. This is because the models show positive relationship between the measures of stock market development and economic growth. However, the Johansen co-integration technique used in the study is inappropriate, since some of the variables used in the analysis were I(0) while others were I(1).
Bernard and Achugbu (2012) use stock market capitalization, value traded ratio and turnover ratio as measures of stock market devolvement to investigate the role of stock market development on economic growth in Nigeria. The time series data used in the study cover sample period 1994-2008 and OLS technique is employed to examine the correlation among the variables. Their findings suggest
22
that market capitalization and value traded ratio have weak negative correlation with economic growth while very strong positive correlation exists between turnover ratio and economic growth in Nigeria. Similarly, Osinubi (2002) investigates whether the stock market promote economic growth in Nigeria, using secondary data on stock market development indicators and economic growth for the period 1980 to 2000 and employs OLS method. He found a positive but statistically insignificant relationship between economic growth and the measures of stock market development utilises in the study.
Ihendinihu and Onwuchekwa (2012) employ OLS technique to examine long-run and short-long-run impact of stock market performance on economic growth in Nigeria. They use annual data of growth rate of GDP, as a proxy for economic growth, and All Share Index, Market Capitalization, Value of Transaction and Total number of Listed Companies, as indicators of stock market performance, for the period 1984-2011. The results indicate that Market Capitalization and Value of Transaction have significant impact on economic growth in both long-run and short-run in Nigeria, while the Total Number of Listed Companies remain insignificant. They conclude that the All Share Index fails to sustain its predictive power in the long-run.
By using annual time series data from 1981 to 2009 and employing OLS regression method, Johansen co-integration test and error correction mechanism in their study titled “The Impact of Capital Market Reforms on Economic Growth in Nigeria”, Ojo and Adeusi (2012) recommend that government should objectively evaluate enacted laws and reforms agenda in a manner that will enhance economic growth rather than considering political issue before embarking on reforms. They make this recommendation while their result indicates that the capital market reform positively impact on the economic growth in Nigeria.
Some of the empirical studies that examine the relationship between stock market and macroeconomic variables for other countries include the work of Olweny and Omondi (2011), Diebold and Yilmaz (2008) , Chinzara (2011), Choo (2011), etc. Olweny and Omondi (2011) investigate the effect of macroeconomic factors on the Nairobi stock market (NASE) volatility, Kenya. They use monthly time series data on NASE All Share Index and three macroeconomic variables including: foreign exchange rate, interest rate and inflation rate for the period of 10years, 2001:1 to
23
2010:12, and employ EGARCH and TGARCH models. They conclude that the selected macroeconomic variables affect stock return volatility at Nairobi stock market, Kenya. Similar results are obtained by Diebold and Yilmaz (2008) after investigating the relationship between stock market volatility and macroeconomic variables volatility for the entire world using approximately forty countries as samples. They utilise major stock market index for each sample country and use real GDP, real consumption expenditure and inflation, as macroeconomic variables. The annual data for the period 1983-2002 are used as a benchmark sample period. They found evidence of link between macroeconomic variables volatility and stock market volatility where the volatility in macroeconomic variables lead to stock market volatility. Similarly, Chinzara (2011) examines the impact that macroeconomic variables volatility have on four selected sectors: financial, industrial, mining and general retails sectors as well as on the stock market as a whole in South Africa, using monthly data on All Share Index for the aggregate market and indies for each of the aforementioned sectors, and utilises seven macroeconomic variables namely: industrial production, consumer price index, broad money supply, exchange rate, oil price, treasury bill and gold price. The sample period covers 1995M8-2009M6. The techniques of analyse employed by the study include ARCH family models and VAR model. Dummies for 1997-1998 Asian and 2007-2009 global financial crises are also included in the analysis to investigate whether these financial crises affect the relationship between macroeconomic variables’ volatility and stock market volatility. He found that the macroeconomic variables volatilities have significant impact on the stock market volatility and that the financial crises increase volatility in stock market and in most of the selected macroeconomic variables, and consequently strengthening the effect that macroeconomic variables volatility have on stock market volatility. Choo et al. (2011) obtained contrasting result after employing GARCH models to examine the impact of three macroeconomic variables: gold price, crude oil price and exchange rate, on Japanese stock market volatility using daily data on closing prices of Nikkei 225 index and the macroeconomic variables for about 12years (from May 1997 to July 2009). His findings suggest that the selected macroeconomic variables have no impact on the Japanese stock market volatility. However, although the author did very well in selecting the fittest volatility model to his data by comparing various alternative volatility models base
24
on both model selection criterion as well as forecast performance of the models, but he failed to include in his analysis the first introduced modern volatility model (i.e. ARCH model) from which all other modern volatility models were extended to.
Arnold and Vrugt (2006) empirically examine the link between stock market volatility and macroeconomic uncertainty using quarterly data on S&P 500 and ten macroeconomic variables from 1969Q1 to 1996Q4. They calculate cross-sectional standard deviations for each of the ten variables in each quarter as measure of uncertainty. They found that U.S stock market volatility significantly relates to macroeconomic uncertainty over the sample period, and conclude that this link is much stronger than that of between stock market volatility and more traditional time series measure of macroeconomic volatility, but disappear after 1996.
Engle et al. (2013) in an attempt to suggest several new component model specifications with direct link to economic activity, they revisit the relationship between stock market volatility and macroeconomic activities using new class of model: GARCH-Mixed Data Sampling (GARCH-MIDAS). Using inflation and industrial production growth, they found that both level and volatility of industrial production growth and inflation contain much information about the future stock market volatility.
Dopke et al. (2006) investigate whether forecasting stock market volatility base on real-time macroeconomic data is comparable to forecasting of such volatility base on revised macroeconomic data in Germany, using monthly data on VDAX-new index and macroeconomic variables such as growth rates of industrial production, orders inflow, output gap and other relevant variables covering the period 1995:1-2005:3. They employ recursive modelling approach to analyse whether macroeconomic variables help to forecast stock market volatility in real time: applying monthly average of square stock market returns and GARCH model as first and second alternative estimators, respectively. They use statistical, utility-base and option-utility-base criterions to evaluate the accuracy of the forecast implies by recursive modelling approach. Their main results suggest that the value of volatility forecast base on real-time macroeconomic data is roughly comparable to the value of volatility forecast base on revised macroeconomic data.
Hsing (2011) examines the impact of selected macroeconomic variables on the stock market index in South Africa. He applies EGARCH model. The results
25
reveal that growth rate of real GDP, U.S stock market index and the ratio of the money supply to GDP have positive effect on South Africa’s stock market index and negatively impacted by ratio of the government deficit to GDP, nominal effective exchange rate, real interest rate, inflation rate and the U.S government bond yield. Similarly, Sariannidis et al. (2010) examine the role of macroeconomic variables in U.S. stock market. Specifically, they investigate the impact of Yen/U.S dollar exchange rate, 10-years bond value, crude oil return and non-farm payrolls (U.S) on Dow Jones sustainability and Dow Jones Wilshire 5000 (U.S) indices. They use monthly data from February 1999 to January 2008 and apply GARCH model. The results reveal that crude oil return and exchange rate negatively affect U.S stock market and positively affected by 10-years bond value. The findings of the study also suggest that all selected macroeconomic indicators influence Dow jones sustainability index with a month delay.
Rahman et al. (2009) explore short-run and long-run dynamic relationship between five macroeconomic variables namely: real exchange rate, money supply, industrial production index, reserves and interest rate, and Malaysian stock market, proxy by Kuala Lumpur composite index, using monthly data from 1986:1 to 2008:3. They employ VAR framework to investigate the existence of long-run equilibrium and short-run dynamic adjustment relationship between the variables. Specifically, they apply Johansen methodology and VECM followed by variance decomposition (VD) analysis and impulse response function (IRF). They found that all the selected macroeconomic variables have significant long-run effect on Malaysia’s stock market in a VECM framework. This is also supported by the results of IRF and VD, which indicate that the Malaysian stock market responded to change in these variables. Based on these findings they conclude that the Malaysian stock market is sensitive to change in the macroeconomic variables. The same results are obtained by Adam and Tweneboah (2008), who also examine the long-run and short-run dynamic relationship between stock prices movement (with the databank stock index as a market index) and selected macroeconomic variables (such as interest rate, inflation, net foreign direct investment and exchange rate) for Ghana, using quarterly data from 1991Q1 to 2006Q4 and apply Johansen’s multivariate co-integration test and Innovation accounting techniques i.e. Impulse Response Function and Variance Decomposition, which are derived from VECM estimation. The results show
26
evidence of co-integration between stock price and macroeconomic variables, indicating the existence of long-run relationship between them. The results also show that the selected macroeconomic variables significantly influence share price movement in the short-run in Ghana. Harper and Jin (2012) also obtain similar results for Indonesia when they investigate both short-run and long-run relationship between stock return (using Jakarta composite index) and five selected macroeconomic variables (including; inflation, interest rate, money supply, industrial production index and exchange rate), using multivariate co-integration framework and VECM and monthly time series data for the period 2001M1-2010M2. They found the existence of co-integration relationship between the market index and the selected macroeconomic variables, and this suggests evidence of long-run equilibrium relationship between the variables. The result from VECM show that the short-run deviations return to their long-run properties. Similarly, Mahmood and Dinniah (2009) examine the dynamic short-run and long-run equilibrium relationship between stock prices and selected macroeconomic variables such as inflation rate, industrial production index and foreign exchange rate in six Asian-pacific: Malaysia, Korea, Thailand, Hong Kong, Japan and Australia, using monthly data on stock price indices and aforementioned macroeconomic variables spanning from 1993M1 to 2002M12 for all sample countries except for Hong Kong and Australia, where the quarterly data are used. They apply Engle and Granger (1987), Johansen and Juselius (1990) as well as Error Correction Model. The study provides evidence to support the existence of long-run equilibrium relationship between and among the variables for all the sample countries except for Malaysia and Thailand. However, the findings show no evidence of short-run relationship among the variables for all selected countries except for Hong Kong, where the relationship is only between exchange rate and stock prices, and Thailand, where the relationship is only between real output and stock price.
Ibrahim (2011) while conducting a study on the relationship between stock market development and macroeconomic performance in Thailand, uses real GDP, as a measure of the level of economic performance, and market capitalisation as a ratio of GDP represents the level of stock market development, while investment to GDP ratio and aggregate price level (represented by GDP deflator) are used as a controlled variables. The study applies VAR model to capture the existence of co-integration
27
among the variables. The VAR framework is also used to obtain Variance Decompositions and Impulse Response Function analyses. The co-integration test’s results suggest evidence of long-run relationship among the variables, while Impulse Response Function indicates bidirectional causality between stock market development and real GDP. This is also affirmed by the Variance Decompositions test, which show that a sizeable percentage of variation in real GDP accounts by shock in stock market development and vice versa.
Elly and Oriwo (2012) attempt to investigate whether there exist any relationship between macroeconomic variables and stock market performance in Kenya, using three macroeconomic variables such as lending interest rate, inflation rate and 91-day Treasury bill and Nairobi securities exchange’s All Share Index(NASI), as a proxy for the stock market. The study utilises monthly time series data for the period 2008:3-2012:3. To avoid dubious regression results according to the authors, the ARDL bound test approach of co-integration is applied to find the existence of long-run relationship among the variables. Their findings suggest a weak positive relationship between inflation and NASI, while 91-day Treasury bill negatively relates with NASI.
Becker and Clements (2007) apply Spline GARCH and Modified-Spline GARCH models to daily returns of S&P500 index from 3rd January, 1957 to 31st December, 2004. In order to demonstrate how macroeconomic variables can be used for longer-term forecasts of volatility within the Spline-GARCH framework, the macroeconomic variables such as GDP growth, growth in industrial production, inflation, 3-month treasury bill rate, 10-year treasury note and 10-year corporate bond rate are considered as independent variables. The results of the model indicate that a number of macroeconomic variables have significant explanatory power for explaining variation in unconditional volatility. They conclude that with the application of this model to S&P500 index the forecast of macroeconomic variables can be easily incorporated into volatility forecast for share index returns.
The studies of Azeez et al. (2012) and Polodoo et al. (2011), which have been done on the exchange rate volatility and macroeconomic performance are similar to but quite different from my study. Azeez et al. (2012) use real GDP, as unexplained variable, while Exchange rate volatility, Balance of payment and Oil revenue as explanatory variables, to examine the effect of exchange rate volatility on
![Figure 3: Trends in seasonally adjusted quarterly Inflation (CPI) and Inflation rate [quarterly change in CPI (%)], 1985Q1-2009Q4](https://thumb-eu.123doks.com/thumbv2/9libnet/3772840.29361/28.892.185.777.185.495/figure-trends-seasonally-adjusted-quarterly-inflation-inflation-quarterly.webp)