MODELLING THE RELATIONSHIP BETWEEN
PRODUCTIVITY, EMPLOYMENT AND WAGES IN TURKISH SMALL AND MEDIUM SIZED ENTERPRISES, 1981-1998
The Institute of Economics and Social Sciences of
Bilkent University
by
GÖRKEMLİ DEMİREL
In Partial Fulfilment of the Requirements for the Degree of
MASTER OF ARTS IN ECONOMICS in
THE DEPARTMENT OF ECONOMICS BİLKENT UNIVERSITY
ANKARA September 2001
I certify that I have read this thesis and have found that it is fully adequate, in scope and in quality, as a thesis for the degree of Master of Economics.
(Assist.Prof.Kıvılcım Metin-Özcan) Supervisor
I certify that I have read this thesis and have found that it is fully adequate, in scope and in quality, as a thesis for the degree of Master of Economics.
(Prof.A.Erinç Yeldan)
Examining Committee Member
I certify that I have read this thesis and have found that it is fully adequate, in scope and in quality, as a thesis for the degree of Master of Economics.
(Assist.Prof.Ahmet H.Köse) Examining Committee Member
Approval of the Institute of Economics and Social Sciences
(Prof.Dr.Kürşat Aydoğan) Director
iii
ABSTRACT
MODELLING THE RELATIONSHIP BETWEEN PRODUCTIVITY, EMPLOYMENT AND WAGES IN TURKISH SMALL AND MEDIUM SIZED
ENTERPRISES, 1981-1998 Demirel, Görkemli Master of Economics
Supervisor: Assist. Prof. Kıvılcım Metin-Özcan
September, 2001
This thesis analyzes the empirical relationship between wages and productivity as well as the relationship between wages and employment in Turkish manufacturing industry. Unlike the previous studies done for manufacturing industry, in this study the size definitions of manufacturing industry, sectoral distribution and the sectoral division between public and private sector are considered. In the empirical part of the thesis, first wage and productivity and wage and employment relationships are estimated by using OLS method. After finding out both wage-productivity and wage-employment relationships are significant, descriptive growth rate comparisons are made for the period of 1981-1998. The main conclusion that emerges from both analyses is that relationship between variables of interest is valid. Wages, productivity and employment relationship have important policy implications regarding especially on Turkish small and medium sized enterprises.
Keywords: Small and medium sized enterprises (SMEs), Productivity, Employment, Wages, Regression
iv
ÖZET
TÜRKİYE’DEKİ KÜÇÜK VE ORTA BÜYÜKLÜKTEKİ İŞLETMELERDE VERİMLİLİK, İSTİHDAM VE ÜCRETLER ARASINDAKİ İLİŞKİNİN
MODELLENMESİ, 1981-1998 Demirel, Görkemli
Yüksek Lisans Tezi, İktisat Bölümü
Tez Yöneticisi: Yrd.Doç.Dr. Kıvılcım Metin-Özcan
Eylül, 2001
Bu çalışma, Türkiye’deki Küçük ve Orta Büyüklükteki İşletmelerde verimlilikle ücretler arasındaki ilişkinin yanısıra istihdam ve ücretler arasındaki ampirik ilişkiyi açıklamaya çalışmaktadır. Bu çalışmanın bugüne kadar imalat sanayii için yapılmış diğer çalışmalardan farkı imalat sanayii ölçek tanımlarının, sektörel dağılımının ve kamu ile özel sektör arasındaki farklılığın incelenmesidir. Öncelikle ampirik analiz kısmında E.K.K (En Küçük Kareler) yöntemi uygulanmıştır. Ücretler-verimlilik ve ücretler-istihdam ilişkisinin anlamlılığı EKK tahminlerinden bulunduktan sonra, 1981-1998 dönemi için tanımlayıcı büyüme oranları karşılaştırması uygulanmıştır. Uygulama sonuçları her iki analizde de ilgili değişkenler arasinda anlamlı ilişki olduğunu göstermiştir. Türkiye’de ücretler, verimlilik ve istihdam arasindaki iliskinin özellikle küçük ve orta büyüklükteki işletmeler üzerinde önemli politika önermeleri olduğu sonucuna varılmıştır.
Anahtar Kelimeler: Küçük ve orta büyüklükteki işletmeler (KOBI), İstihdam, Verimlilik, Ücretler, Regresyon
v
ACKNOWLEDGEMENTS
I am grateful to Assist. Prof. Kıvılcım Metin-Özcan for her supervision and guidance throughout the development of this thesis.
I would also like to thank Prof. Erinç Yeldan and Assist. Prof. Ahmet H. Köse for their help and guiding comments.
My foremost thanks go to my family for their endless support and encouragements throughout all my years of study. Finally, I would like to dedicate this thesis to my brother, Cem Demirel.
vi
TABLE OF CONTENTS
ABSTRACT...iii ÖZET ... iv ACHKNOWLEDGEMENTS ... v TABLE OF CONTENTS ... vi CHAPTER 1. INTRODUCTION ...1CHAPTER 2. STRUCTURE OF TURKISH MANUFACTURING INDUSTRY...4
2.1 Phases of Macroeconomic Adjustments in Turkish Manufacturing Industry, 1981-1998...5
2.2 Size Definitions of Manufacturing Industry ...7
2.3 Historical Development of Employment, Number of Enterprises and Value Added in Turkish Manufacturing Industry...8
CHAPTER 3. THE ROLE OF MANUFACTURING INDUSTRY IN TURKISH ECONOMY REGARDING THE SUB-SECTORS ...17
3.1 Development of Employment, Number of Enterprises, Value added and Gross additions to fixed capital Regarding Sectoral Divisions...18
3.2 Sectoral Classification of Total Investment Incentives ...28
CHAPTER 4. LITERATURE SURVEY ON WAGES, EMPLOYMENT AND PRODUCTIVITY ...33
CHAPTER 5. EMPIRICAL ANALYSIS ...39
5.1 Analysis of Least Squares Estimation...40
5.2 Empirical Investigation of the Relationship Between Wages, Productivity and Employment ...43
vii
5.2.ii. Growth Patterns in Manufacturing Industry ...48
5.2.iii. Sectoral Labor Densities ...56
CHAPTER 6. CONCLUSION AND DISCUSSION...60
BIBLIOGRAPHY ...65
APPENDIX A
• Data and definition of variables.
APPENDIX B
• Table 1. Percentage share of the number of enterprises, number of employees
and the value added in Turkish Manufacturing Industry
APPENDIX C
• Extended Definitions of Small and Medium Enterprises in Turkey
Definition of KOSGEB Definition of HALKBANK Definition of EXIMBANK
Definition of Undersecretariat of Treasury Definition Of Undersecretariat of Foreign Trade Definition of SIS (The State Institute of Statistics) Definition of TOSYÖV
viii
APPENDIX D
• Definition of Small and Medium-sized Enterprises Adopted by the EU
COMMISSION (OJL 107.30.04.1994)
APPENDIX E
• Figure 1. Wage and input costs in the manufacturing industry for the period
1980-1998
APPENDIX F
• Table 1. Percentage share distribution of the number of enterprises, level of
employment, value added and gross additions to fixed capital of 9 small-sized manufacturing sectors for 1998
• Table 2. Percentage share distribution and growth rates for 4 important
small-sized manufacturing sectors
Table 2-a. Percentage share distribution and growth rates of the number of enterprises for 4 important small-sized manufacturing sectors
Table 2-b. Percentage share distribution and growth rates of the level of employment for 4 important small-sized manufacturing sectors
Table 2-c. Percentage share distribution and growth rates of the value added for 4 important small-sized manufacturing sectors
Table 2-d. Percentage share distribution and growth rates of the gross additions to fixed assets for 4 important small-sized manufacturing sectors
ix
• Table 3. Percentage share distribution of the number of enterprises, level of
employment, value added and gross additions to fixed capital of 9 medium-sized manufacturing sectors for 1998
• Table 4. Percentage share distribution and growth rates for 4 important
medium-sized manufacturing sectors
Table 4-a. Percentage share distribution and growth rates of the number of enterprises for 4 important medium-sized manufacturing sectors
Table 4-b. Percentage share distribution and growth rates of the level of employment for 4 important medium-sized manufacturing sectors
Table 4-c. Percentage share distribution and growth rates of the value added for 4 important medium-sized manufacturing sectors
Table 4-d. Percentage share distribution and growth rates of the gross additions to fixed assets for 4 important medium-sized manufacturing sectors
• Table 5. Percentage share distribution of the number of enterprises, level of
employment, value added and gross additions to fixed capital of 9 large-sized manufacturing sectors for 1998
• Table 6. Percentage share distribution and growth rates for 4 important
large-sized manufacturing sectors
Table 6-a. Percentage share distribution and growth rates of the number of enterprises for 4 important large-sized manufacturing sectors
Table 6-b. Percentage share distribution and growth rates of the level of employment for 4 important large-sized manufacturing sectors
x
Table 6-c. Percentage share distribution and growth rates of the value added for 4 important large-sized manufacturing sectors
Table 6-d. Percentage share distribution and growth rates of the gross additions to fixed assets for 4 important large-sized manufacturing sectors
APPENDIX F
CHAPTER 1
INTRODUCTION
In developing countries and Turkey in addition to factories, small production units named workshops also make production. Small and Medium Enterprises (SME’s) are known as fundamental economic units of our era. These small production units display production type differences and they have flexible production systems1. Today, these enterprises, besides large manufacturing industries, which are classified by considering number of employees, are accepted as locomotive of the Turkish economy. Manufacturing industries not only have important share in the value added and employment created in Turkish economy, but also are the important component of economic policies as they create economic and external advantage. In a country like Turkey where there is economic and social unrest, the saving cost created by manufacturing industries prevent the growth of the economic and social problems in economic depression periods, owing to their contribution to
employment, adaptation to conjuncture change and specialization in certain subjects. Firms in manufacturing industries are inclined to technological innovations and adapt easily to variations and kinds of demand; they constitute regional balanced progress by decreasing deformity of income distribution. In addition to encouraging and guiding personal savings, SME’s are supporter and complement of large enterprises2. SME’s are balance and stability component of social systems and they are one of the main insurance of the democratic society and liberal economy3.
Examining SME’s by enterprise numbers, employee numbers and value added created, it is clear that they have important place in Turkish economic and social life.
Considering the importance of SME’s in Turkish economy couple of empirical paper analyse the manufacturing industries data in late 1990s. Among them, Metin-Ozcan (2001) discussed historical development of employment, number of enterprises and value added in Turkish manufacturing industry by regarding size definition of both manufacturing industry and sub-sectors. By the guidance of the efficiency wage theory, the relationship between productivity and wages as well as employment-wage relationship are examined by Yenturk (1997). Metin (1995a), conducts two different models that are aiming to clarify the direction of the relationship between wages, productivity and employment. Having motivated from the previous works mentioned above, the purpose of this thesis is not only to have
2 For further information see “Economic and Industrial Report” by KOSGEB. 3Metin-Ozcan (2001).
general idea about the manufacturing industry4 but also to point out the relationship between employment, productivity and wages in manufacturing industry.
The rest of the study is organized as follows. In chapter 2, a summary of phases of macroeconomic adjustment in Turkish manufacturing industry is given. Then, by presenting the size definitions of manufacturing industry, and examining the historical development of employment, number of enterprises and value added in Turkish manufacturing industry, general structure of the industry is discussed. In chapter 3, the role of manufacturing industry in Turkish economy is evaluated regarding sectoral developments and incentive certificates reserved for the manufacturing sub-sectors. In chapter 4, early literature about the relationship between productivity and wages as well as the relationship between productivity and wages are discussed. Empirical analysis is given in Chapter 5. Firstly, OLS estimation is applied to the models constructed, which are displaying wage-employment and wage-productivity relationships. Next, the links between these variables are examined considering labor market elasticities, growth patterns and sectoral labor densities in manufacturing industry in order to confirm the test results. Finally, in chapter 6 the concluding remarks based on the empirical results are discussed. The tables, related definitions and figures are given in the corresponding Appendices.
4 In early studies, private manufacturing industry data is used, generally. However, manufacturing
CHAPTER 2
STRUCTURE OF TURKISH MANUFACTURING
INDUSTRY
In this chapter, after a summary of macroeconomic adjustments in Turkish
manufacturing industry, the size definitions of manufacturing industry are given so as to form a classification pattern for the thesis. Next, the historical development of the enterprises included in selected classification pattern and their percentage contribution to manufacturing industry are discussed regarding number of enterprises, employment and value added.
empirical analysis chapter of the thesis, the data is separated into public and private enterprises in order to set general characteristics.
2.1 PHASES OF MACROECONOMIC ADJUSTMENT IN TURKISH
MANUFACTURING INDUSTRY, 1981-19985
The post-1980 adjustments of Turkish economy can be partitioned into three broad periods: “1981-1988”, “1989-1993” and “1994-1998”. In the first period, integration to the global markets is achieved through commodity trade liberalization, in line with the declaration of structural adjustment program in 1980, aiming to reduce the state’s role in economic affairs. Over this period, which can be named as
“export-led” phase, both replacing fixed exchange rate regime with flexible regime
of crawling-peg and direct export subsidies are the main instruments. In addition, the suppression of wage incomes, which cuts labor costs as well as reducing domestic demand, is the source of the surplus created. 1980 program achieves its targets by lower inflation, higher GDP growth, liberalized external trade regime and financial system. The export-led growth strategy of the early 1980’s was successful and economy did not experience any recession in this period. However, after the general elections and new parliament in 1984, inflation started to rise again. The stated foreign trade objectives towards manufacturing exports are not applied consistenly and this led to a failure the export oriented growth strategy of the 1980's. In 1988, the classic mode of surplus creation reached its limits. In the second period, 1989-1993, with the pressure of populist policies labor unions succeeded in attaining significant increases in wages. Moreover, in 1989, convertibility of Turkish Lira is
5 This section is formed by examining Voyvoda, and Yeldan (1999), Boratav, Kose and
Yeldan(2000), Ertugrul and Selcuk. (2001), Ozcan, Voyvoda and Yeldan (2000), Metin-Ozcan, Voyvoda and Yeldan (2001) , see these papers for an over-view of the post-1980 Turkish structural adjustment reforms.
declared and by the flows of “hot money” Turkish domestic asset markets are opened to global financial competition. Post-1989 financial liberalization completed the integration of domestic economy with the global commodity and financial markets, and initiated a process of short-term foreign capital-led growth. So, it is possible to name this period as “unregulated financial liberalization” phase. Unsustainability of the post-1989 growth path resulted in the shortage of short-term funds. In early 1994, which was the beginning year for the third period, 1994-1998, the economy experienced major crisis as well as declaration of devaluation. Then, government announced a stand-by arrangement, which was approved by International Monetary Fund (IMF) Board. However, by the effect of post-1994 crisis environment, economic surplus move towards financial sectors rather than industrial sectors. So, the stabilization program of year 1994 and stand-by agreement came to end in 1995. Till 1998, government did not display any serious attempt to stabilize economy and to reduce inflation. Towards the end of the period 1994-1998, which can be named as “financial crisis and reinvigoration of short-term
capital-led” phase, government set up another disinflation program under guidance of IMF,
but the general elections in 1999, two devastating earthquakes and two major crisis in 2000 and 2001 led to deterioriation of fiscal balance of the public sector.
2.2 SIZE DEFINITIONS OF MANUFACTURING INDUSTRY
Small enterprises are owner directed, high degree personalized enterprises, they generally participate in local activities and finance their growth by internal resources. According to International Standardization Organization (ISO) the enterprises that employ workers less than 20 is categorized as small, the ones that employ 20-99 workers are accepted as medium enterprises. This fact shows that SME definition for our country and for other countries differ according to employment level and capital level in public and private sector. For instance, the enterprises that employ; 1000-1500 workers in USA, 50-500 workers in Germany, 101-300 workers in South Korea are classified as SME’s.6 In Turkey by the definitions of institutions that are concerned with the subject, it is possible to classify small and medium enterprises by a variety of criteria used by several institutions7.
Common definition according to number of employed worker criteria is the one formed by State Institute of Statistics (SIS). In manufacturing sector the enterprises that employ 1-9 workers are classified as micro-sized; the enterprises that employ 10-49 workers are classified as small-sized; the enterprises that employ 50-199 workers are classified as medium-sized enterprises. 8
6 The definitions given in this paragraph is taken from “Dünya’da ve Türkiye’de Kobi Tanımları”,
publication of KOSGEB.
7 Classification of SME’s by various criteria is given in Appendix C. 8 Size definition of SIS is used in our thesis.
Halkbank, one of the state banks, defines criteria of SME’s with incentive certificate as the enterprises that employ 1-150 workers. Halkbank again forms Normal SME definition as the enterprises that employ 1-250 workers. Halkbank and Undersecretariat of Treasury apply fixed investment loans to the enterprises with a fixed capital less than 400 billion TL. Net balance sheet value criteria is applied to the enterprises with a net balance sheet value less than TL value that cover 2 million USD by Undersecretariat of Foreign Trade.9
Considering various definitions given above, we decided to use the definition of SIS in the thesis, which also fits with our data.10
2.3 HISTORICAL DEVELOPMENT OF EMPLOYMENT, NUMBER OF ENTERPRISES AND VALUE ADDED IN TURKISH MANUFACTURING INDUSTRY
In this section, we analyse the distribution of Turkish manufacturing industry enterprises according to their sizes regarding number of enterprises, level of employment, value added and productivity11 for the years 1981, 1985, 1990, 1995 and 1998, considering the five years developments in the examined period.
9 The definition of small and medium enterprises that are accepted by European Commission is given
in Appendix D.
10 The data and definition of variables are given in Appendix A.
11 Value added is deflated by manufacturing industry WPI, taking 1981 as a base year and
TABLE 1-a. DISTRIBUTION OF TURKISH MANUFACTURING INDUSTRY ENTERPRISES ACCORDING TO THEIR SIZES Number of employees Number ofenterprises % share ofnumber of
enterprises
level of
employment % share of levelof employment (million TL)value added value added share (%) production per worker (productivity) million TL small enterprises 10-49 7857 63.58 195647 16.15 296096.9452 7.46 1.513424408 50-99 2012 16.28 141179 11.66 264550.0814 6.67 1.873862836 100-199 1224 9.91 170895 14.11 409166.4489 10.31 2.394256409 medium enterprises (50-199) 3236 26.19 312074 25.77 673716.5303 16.98 2.158835822 sme (10-199) 11093 89.77 507721 41.92 969813.4755 24.45 1.910130712 large enterprises (200+) 1264 10.23 703493 58.08 2997166.418 75.55 4.260406881 1998 total manufacturing sector 12357 100 1211214 100 3966979.893 100 3.275209743 TABLE 1-b. DISTRIBUTION OF TURKISH MANUFACTURING INDUSTRY ENTERPRISES ACCORDING TO THEIR SIZES
Number of employees Number ofenterprises
% share of number of enterprises
level of
employment % share of levelof employment (million TL)value added value added share (%) production per worker (productivity) million TL small enterprises 10-49 6774 66.22 162389 16.67 397.8889973 6.87 0.002450221 50-99 1450 14.18 100331 10.30 342.880288 5.92 0.003417491 100-199 955 9.34 132057 13.56 613.8100158 10.60 0.004648069 medium enterprises (50-199) 2405 23.51 232388 23.86 956.6903037 16.53 0.00411678 sme (10-199) 9179 89.74 394777 40.53 1354.579301 23.40 0.003431252 large enterprises (200+) 1050 10.26 579156 59.47 4434.044058 76.60 0.007656044 1995 total manufacturing sector 10229 100 973933 100 5788.623359 100 0.005943554 TABLE 1-c. DISTRIBUTION OF TURKISH MANUFACTURING INDUSTRY ENTERPRISES ACCORDING TO THEIR SIZES
Number of employees Number ofenterprises
% share of number of enterprises
level of
employment % share of levelof employment (million TL)value added value added share (%) production per worker (productivity) million TL small enterprises 10-49 5762 64.95 137319 13.36 4072.496288 5.53 0.029657194 50-99 1220 13.75 84503 8.22 3834.273739 5.20 0.04537441 100-199 852 9.60 118991 11.57 5709.843142 7.75 0.047985504 medium enterprises (50-199) 2072 23.36 203494 19.79 9544.116882 12.95 0.04690122 sme (10-199) 7834 88.31 340813 33.15 13616.61317 18.48 0.039953327 large enterprises (200+) 1037 11.69 687383 66.85 60083.34174 81.52 0.087408827 1990 total manufacturing sector 8871 100 1028196 100 73699.95491 100 0.071678897 TABLE 1-d. DISTRIBUTION OF TURKISH MANUFACTURING INDUSTRY ENTERPRISES ACCORDING TO THEIR SIZES
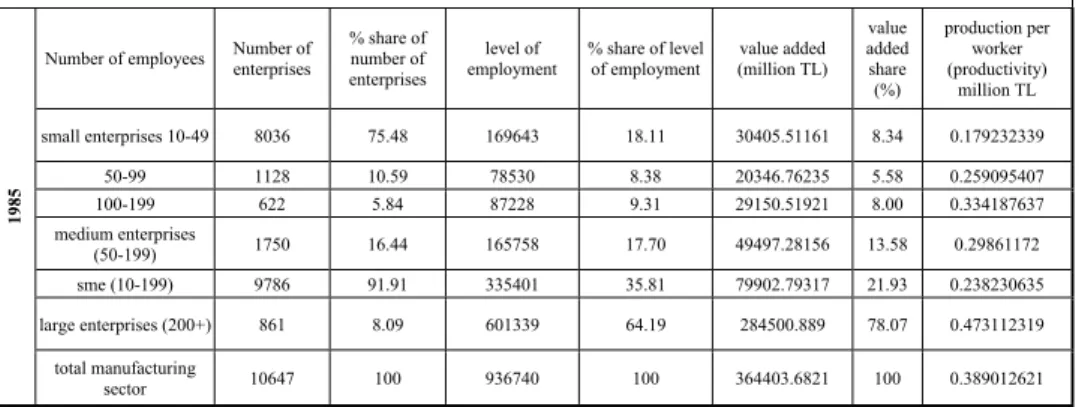
Number of employees Number of enterprises % share of number of enterprises level of employment % share of level of employment value added (million TL) value added share (%) production per worker (productivity) million TL small enterprises 10-49 8036 75.48 169643 18.11 30405.51161 8.34 0.179232339 50-99 1128 10.59 78530 8.38 20346.76235 5.58 0.259095407 100-199 622 5.84 87228 9.31 29150.51921 8.00 0.334187637 medium enterprises (50-199) 1750 16.44 165758 17.70 49497.28156 13.58 0.29861172 sme (10-199) 9786 91.91 335401 35.81 79902.79317 21.93 0.238230635 large enterprises (200+) 861 8.09 601339 64.19 284500.889 78.07 0.473112319 1985 total manufacturing sector 10647 100 936740 100 364403.6821 100 0.389012621
TABLE 1-e. DISTRIBUTION OF TURKISH MANUFACTURING INDUSTRY ENTERPRISES ACCORDING TO THEIR SIZES Number of employees Number ofenterprises % share ofnumber of
enterprises
level of
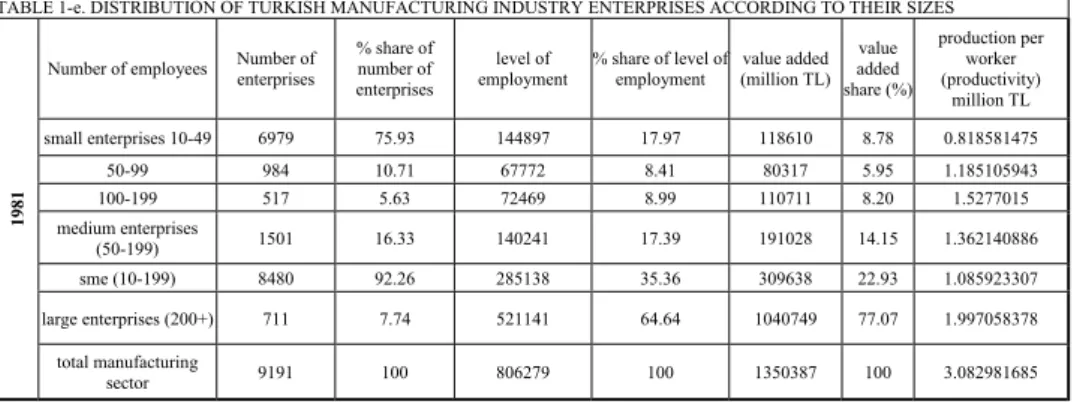
employment % share of level ofemployment (million TL)value added value added share (%) production per worker (productivity) million TL small enterprises 10-49 6979 75.93 144897 17.97 118610 8.78 0.818581475 50-99 984 10.71 67772 8.41 80317 5.95 1.185105943 100-199 517 5.63 72469 8.99 110711 8.20 1.5277015 medium enterprises (50-199) 1501 16.33 140241 17.39 191028 14.15 1.362140886 sme (10-199) 8480 92.26 285138 35.36 309638 22.93 1.085923307 large enterprises (200+) 711 7.74 521141 64.64 1040749 77.07 1.997058378 1981 total manufacturing sector 9191 100 806279 100 1350387 100 3.082981685
** Calculations are performed by the author using SIS data (Manufacturing Industry Censuses for 1981-1998) and value added is deflated by 1981=100 manufacturing WPI.
Examination of Table1-a, Table1-b, Table1-c, Table1-d and Table1-e showed that over 1981-1998 the shares of enterprises classified according to size definitions do not change significantly. It is observed that for the examined years the percentage share distribution among small, medium and large-sized enterprises display similar characteristics: large enterprises produce most of the value added and SMEs create huge employment capacity in the industry. In the following analysis, we firstly investigate the percentage distribution of the year 1998 to examine the general characteristics of manufacturing industry mentioned above. Secondly, we discuss the variations in the labour productivity of the enterprises.
Examining 1998 manufacturing sector SIS data reported in Table1-a, we could see that most of the enterprises in manufacturing sector are small enterprises by having %63.5 of the total. However, they only contribute %7.46 of the total value added of the manufacturing industry as well as %16.1 of the total employment. With lower share of number of enterprises, medium enterprises cause %25.77 of the total employment and create %16.9 of the total manufacturing value added. In addition, large-sized enterprises are the most important enterprises, as they create %75.55 of
the total manufacturing industry’s value added by using %10.22 of the total enterprises in the sector. Consideration of the production per worker roughly, which is formed by dividing the level of value added to employment level12, is useful to realize the productivity levels in the enterprises that are classified regarding the size definitions.
In 1981, a significant level of labor productivity is observed mainly for the total manufacturing industry with 3.082.981 TL. However, from Table1-d clear decline in productivity of manufacturing industry is realized. Although, the total number of enterprises and level of employment increases, there is a sharp decline in real value added which leads to lower productivity in manufacturing industry. Table1-c displays the characteristics of manufacturing enterprises in 1990. After 1989 elections, high inflation as well as high wage policy leads to lower level of productivity in this period, which is the direct consequence of “populist policies”. It is noteworthy that the total number of enterprises diminishes in 1990, due to the decrease in the number of small enterprises. The reflections of 1994 crisis are mainly observed, by drops in both value added and wages in addition to the transfer of economic surplus from industrial sectors towards financial sectors13, in 1995. In this year, employment level continues to decline, as it is expected. For 1998, the clear development is recognized in manufacturing industry due to higher levels of number of enterprises, employment and value added. The significant rise in value
12 The productivity is described as the ratio of value added to employment level, since the value
added is the part of output that is purified from input, which can be considered the real output of the enterprise. For further details please visit www.mpm.gov.tr.
added, which stems from the improvements in inflation rate-by the disinflation program14-leads to a higher productivity level that is above the 1981 level. It is important to note that the productivity of large enterprises exceeds the total productivity of the industry for the examined years, except for 1981.
The clear outcome from the discussion of productivity by considering Table1-a, Table1-b, Table1-c, Table1-d and Table1-e is that the number of workers employed in the enterprises determines level of productivity directly, as expected.15
14 Ertugrul, Selcuk (2001). 15 See Metin Ozcan (2001).
**The data used to form these graphs are taken from Appendix B, Table1
FIGURE.1-b PERCENTAGE SHARE OF EMPLOYMENT
0,00 10,00 20,00 30,00 40,00 50,00 60,00 70,00 80,00 1981 1982 1983 1984 1985 1986 1987 1988 1989 1990 1991 1992 1993 1994 1995 1996 1997 1998 time employment % 10-49 50-199 200+
FIGURE.1-a PERCENTAGE SHARE OF ENTERPRISE NUMBER
0,00 10,00 20,00 30,00 40,00 50,00 60,00 70,00 80,00 1981 1982 1983 1984 1985 1986 1987 1988 1989 1990 1991 1992 1993 1994 1995 1996 1997 1998 time enterprise number % 10-49 50-199 200+
FIGURE.1-c PERCENTAGE SHARE OF VALUE ADDED
0,00 10,00 20,00 30,00 40,00 50,00 60,00 70,00 80,00 90,00 1981 1982 1983 1984 1985 1986 1987 1988 1989 1990 1991 1992 1993 1994 1995 1996 1997 1998 time value added % 10-49 50-199 200+
Now, we analyse the development of employment, number of enterprises and value added in Turkish manufacturing industry by using graphical explanations over the
period of 1981-1998.
In Figure1-a, Figure1-b and Figure1-c over the period 1981-1998 Turkish Manufacturing industry’s number of enterprises, employment and value added 16 defined as a percentage of the total are reported respectively. From Figure 1-b, it is clear that the small enterprises (employ 10-49 workers) are substantial than the large (employ 200+ workers) and medium-sized enterprises (employ 50-199 workers). Although small enterprises follow a declining trend, they preserve their critical position by having more than % 60 of the enterprises of the total manufacturing industry. Interestingly, the trend of small enterprises shows upward movements in 1985, 1989 and 1992. As in1981-1988 period Turkey adapted to export-oriented growth policy17, the large enterprises that have capability to export gain more importance for the economy and promoted more than the small enterprises. This fact is reflected in the Figure1-a as the downward movement of the share of small enterprises. It is obvious that there is a steady increase in the contribution of the medium and large enterprises through the period 1980-1998. Moreover, they follow similar trends since both have a sharp decline in their shares in 1985,1989 and 1992. In 1985, both wage excluded costs and wage costs for the manufacturing enterprises decrease18, which encourages new enterprises to enter the industry, and in this year
16 Value added is deflated by taking 1981 as a base year. 17 Voyvoda, E. and Yeldan, A.E. (1999).
18 Similar to the analysis done by Yentürk (1997) covering the period 1974-1993, we also derived the
the total number of enterprises in manufacturing industry increases. The advantage of lower wage and wage excluded costs is mainly observed by small enterprises, as their share in the number of enterprises increased to % 75.5. In 1992, a sharp upward movement in the share of small enterprises is recognized. 1988-1991 is the period in which the wage costs for the manufacturing industry grow; in 1992; the wage costs for the industry declines. Since the wage excluded cost is having a diminishing trend in post-1989 period; this leads to an expansion in the total number of enterprises of manufacturing industry. This expansion is mostly reflected on small enterprises by increasing their share in the total industry.
By Figure1-b, it is obvious that although large enterprises are nearly %10 of the total enterprises of the manufacturing industry, they have great contribution to employment of the industry. During the period of 1981-1990, large enterprises share of the industries’ employment level is almost stable in %70-80 band. However, during the post-1990 period their share of total employment in manufacturing industry diminishes and reaches its lowest level in 1998. Both in 1985 and 1992 there is significant downward movement in their shares due to the lower wage excluded costs and lower wage costs of the manufacturing industry in these periods19. Small enterprises also have a declining tendency-yet we must note that in 1985 and 1992, they increase their percentage shares in the total employment of manufacturing sector-which is reverse of the fact for large enterprises. In
in Appendix E. Wage cost is calculated by dividing real wage to real output and wage excluded cost is calculated by dividing input to output.
1998 period, medium-sized enterprises slightly increase its contribution to the total manufacturing employment level and have its highest share in 1998.
Figure1-c gives us an opinion of the value added of the manufacturing industry. The greatest share of the value added is created by the contribution of large enterprises with nearly %75 of the total value added created in manufacturing sector. Until 1991 value added share of large enterprises in the industry is nearly flat, except for the year 1988. During the post-1991, period large enterprises show a declining tendency for their share in the manufacturing industry’s total value added. On the other hand, both small and medium enterprises have nearly stable trend till 1991 by exchanging their shares slightly and during the post-1991 period both of them started to increase their shares in the manufacturing industry value added.
By examining Figure1-a, Figure1-b and Figure1-c together, we must note that although small enterprises have considerable position in total manufacturing industry enterprises, yet their contribution to manufacturing industry employment and value added are weak. On the contrary, instead of their lower share in the number of total manufacturing enterprises, large enterprises are capable of having the highest shares of the total manufacturing industry for both the level of employment and the level of value added.
CHAPTER 3
THE ROLE OF MANUFACTURING INDUSTRY IN
TURKISH ECONOMY REGARDING THE
SUB-SECTORS
In this chapter we investigate the sectoral development of the manufacturing industry in Turkish economy regarding the data provided by SIS for the year 1998. We first analyse the total manufacturing industry and then we employ the data for each category for the number of employed persons, respectively.
3.1 DEVELOPMENT OF EMPLOYMENT, NUMBER OF ENTERPRISES, VALUE ADDED AND GROSS ADDITIONS TO FIXED CAPITAL REGARDING SECTORAL DIVISIONS
Industrialism means technology and it requires long-term way of thinking and planning.20 From the year 2000, the aim is to form a small and medium sized enterprises vision in Turkey, which is appropriate for both necessities and opportunities of the information society. Starting out from this motivation, nine sectors of the Turkish manufacturing industry are classified on the basis of the number of enterprises, number of employees, value added they produced and addition to their fixed capital in Table2. Having done this, we aim to determine the most important locomotive sectors of the manufacturing industry.
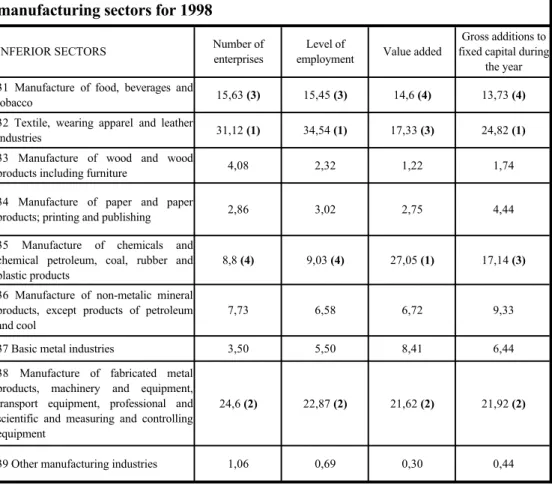
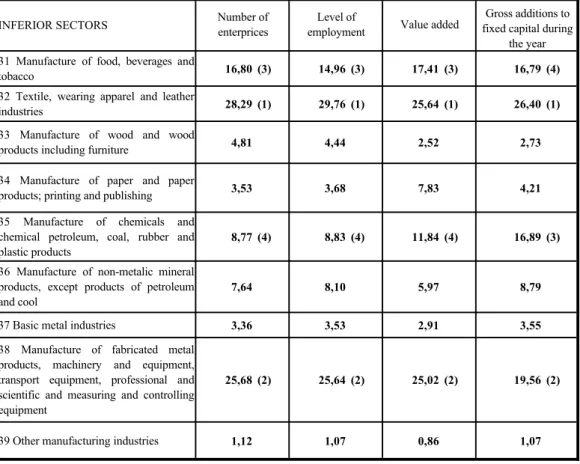
In Table 2, percentage share distribution of the number of enterprises, the number of employees, value added and gross additions to fixed capital of the 9 manufacturing sectors for 1998 are reported. By examining the share of 2-digit economic activities in total manufacturing industry regarding the number of establishments, number of employees, value added and gross additions to fixed capital during 1998 in the total manufacturing industry, four important sectors of the manufacturing industry are determined. These sectors, which can be considered as the locomotive sectors of the economy, are (32) textile, wearing apperal and leather industries, (38) manufacture of fabricated metal products, machinery and equipment, transport equipment, professional and scientific and measuring and controlling equipment,
INFERIOR SECTORS Number of enterprises
Level of
employment Value added
Gross additions to fixed capital during
the year 31 Manufacture of food, beverages and
tobacco 15,63 (3) 15,45 (3) 14,6 (4) 13,73 (4)
32 Textile, wearing apparel and leather
industries 31,12 (1) 34,54 (1) 17,33 (3) 24,82 (1)
33 Manufacture of wood and wood
products including furniture 4,08 2,32 1,22 1,74
34 Manufacture of paper and paper
products; printing and publishing 2,86 3,02 2,75 4,44
35 Manufacture of chemicals and chemical petroleum, coal, rubber and plastic products
8,8 (4) 9,03 (4) 27,05 (1) 17,14 (3)
36 Manufacture of non-metalic mineral products, except products of petroleum and cool
7,73 6,58 6,72 9,33
37 Basic metal industries 3,50 5,50 8,41 6,44
38 Manufacture of fabricated metal products, machinery and equipment, transport equipment, professional and scientific and measuring and controlling equipment
24,6 (2) 22,87 (2) 21,62 (2) 21,92 (2)
39 Other manufacturing industries 1,06 0,69 0,30 0,44
Source: State Institute of Statistics, Ankara
* Values in the paranthesis enumerate 4 important inferior sectors.
TABLE 2. % share distribution of the number of enterprises, level of employment, value added and gross additions to fixed capital of 9 manufacturing sectors for 1998
(35) manufacture of chemicals and chemical petroleum, coal, rubber and plastic products and (31) manufacture of food, beverages and tobacco21.
(32) Textile is the most important sector of the total manufacturing industry. It has %31.12 of the total number of manufacturing enterprises, %34.54 of the total manufacturing employment, % 17.33 of the total manufacturing industry's value added and %24.82 of the total gross additions to fixed capital during 1998.
Considering the share of the number of enterprises and the level of employment, value added and gross additions to fixed capital, (38) manufacture of fabricated metal products is the second important sector of the manufacturing industry. This sector produces % 21.62 of the total manufacturing industry value added and creates %21.92 of the total gross additions to fixed capital during 1998. Third important sector is (31) manufacture of food regarding the number of enterprises and level of employment, while it is the fourth important sector for both the total value added and the total gross additions to fixed capital created in the industry during 1998 with %14.6 and %13.73 shares, respectively. On the other hand, (35) manufacture of chemicals is the fourth important sector by considering its shares in the total number of enterprises and the total level of employment. In manufacturing industry, manufacture of chemicals sector is the most important sector with its %27.05 contribution to total manufacturing industry value added and third important sector
21 Similar test is conducted by Metin-Ozcan (2001) for micro-small sized enterprises, unlike the study
of Metin-Ozcan, in this thesis (35) manufacture of chemicals is the fourth important sector rather than (33) manufacture of wooden products sector.
of the total manufacturing industry’s gross additions to fixed capital during 1998 with its 17.14 percentage share.
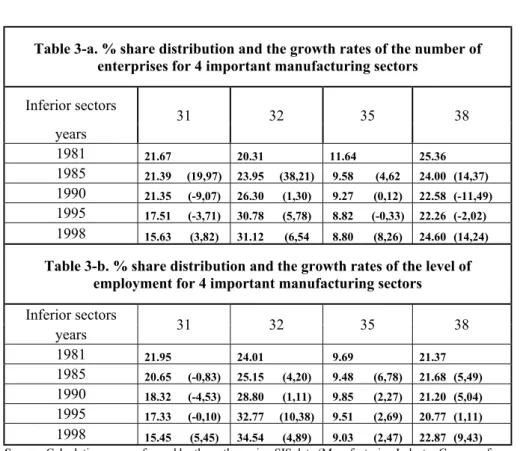
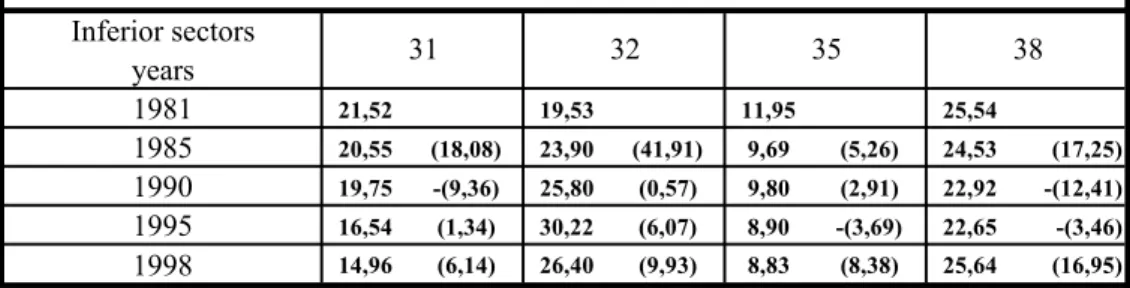
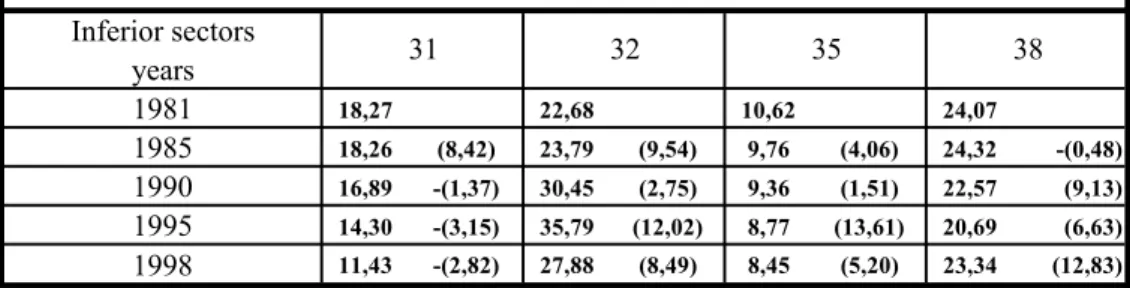
In order to examine the role of four important sub-sectors of the manufacturing industry and their contribution to economic development, percentage share distribution of number of enterprises, number of employed, value added and addition to gross fixed capital in the total of these sectors are computed in Table 3a-d an3a-d their respective growth rates regar3a-ding previous census value are calculate3a-d. In Table 3-a-d, the shares of the number of enterprises for the four important sectors and their growth rates are given for the years 1981, 1985, 1990, 1995 and 1998. Taking 1980-1995 period into consideration, the shares of food sector, manufacture of chemicals sector and manufacture of fabricated metal products sector diminish significantly. Food sector’s and manufacture of chemicals sector’s shares in the total number enterprises continue to decline between 1995-1998 whereas the share of manufacture of fabricated metal products increases and reaches a level that is above its 1985 share level. Textile sector’s shares in the total manufacturing industry show an upward trend-considering number of enterprises, level of employment, gross additions to fixed assets and value added-for the period 1980-1998.
Table 3-a. % share distribution and the growth rates of the number of enterprises for 4 important manufacturing sectors
Inferior sectors years 31 32 35 38 1981 21.67 20.31 11.64 25.36 1985 21.39 (19,97) 23.95 (38,21) 9.58 (4,62 24.00 (14,37) 1990 21.35 (-9,07) 26.30 (1,30) 9.27 (0,12) 22.58 (-11,49) 1995 17.51 (-3,71) 30.78 (5,78) 8.82 (-0,33) 22.26 (-2,02) 1998 15.63 (3,82) 31.12 (6,54 8.80 (8,26) 24.60 (14,24)
Table 3-b. % share distribution and the growth rates of the level of employment for 4 important manufacturing sectors
Inferior sectors years 31 32 35 38 1981 21.95 24.01 9.69 21.37 1985 20.65 (-0,83) 25.15 (4,20) 9.48 (6,78) 21.68 (5,49) 1990 18.32 (-4,53) 28.80 (1,11) 9.85 (2,27) 21.20 (5,04) 1995 17.33 (-0,10) 32.77 (10,38) 9.51 (2,69) 20.77 (1,11) 1998 15.45 (5,45) 34.54 (4,89) 9.03 (2,47) 22.87 (9,43) Source: Calculations are performed by the author using SIS data (Manufacturing Industry Censuses for
1981-1998). Values in the parenthesis are growth rates of the employment level and number of
enterprises to the preceding census value of the employment level and number of enterprises, accordingly
(Xt-Xt-1/Xt).
In Table 3-a, the values in parenthesis are the growth rates of the number of enterprises as to the preceding survey of the number of enterprises. From the table, rapid growth ratios are observed for (31) food sector, (32) textile sector and (38) manufacture fabricated metal products sector in 1985. 1985-1990 is the shrink period for all sectors as the growth ratios for them fall sharply. In 1990-1998 period, all sectors, except (35) manufacture of chemicals sector, show an upward growth trend. The falling growth rate (%-0.33) of manufacture of chemicals sector (35) reverses its trend in 1995-1998 period by having a significant growth ratio of %8.26. The number of employees' growth rates reflects our observations in Table 3-b for the period 1981-1990. In 1990-1995 period (31) food sector, (32) textile sector and (35) manufacture of chemicals sector increase their growth rates except (38)
manufacture of fabricated metal products sector has a decline in its growth rate when compared to growth rate of 1985-1990 period. For 1995-1998 period, (31) food sector and (38) manufacture of fabricated metal products sector have higher growth rates than the previous period whereas (32) textile and (35) manufacture of chemicals sector growth rates diminish. There are slight differences between the behaviour of two related variables, number of enterprises and employment, reported in Table 3-a and Table 3-b for post-1990 period. This might be due to the fact that after 1990, Turkey faced economic and fiscal crisis, which lead to not only a heavy inflationary pressure, but also weakened savings and credit assurance problems.22
Table 3-c. % share distribution and the growth rates of the value added for 4 important manufacturing sectors
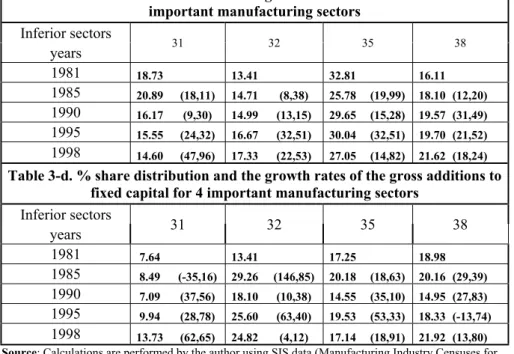
Inferior sectors years 31 32 35 38 1981 18.73 13.41 32.81 16.11 1985 20.89 (18,11) 14.71 (8,38) 25.78 (19,99) 18.10 (12,20) 1990 16.17 (9,30) 14.99 (13,15) 29.65 (15,28) 19.57 (31,49) 1995 15.55 (24,32) 16.67 (32,51) 30.04 (32,51) 19.70 (21,52) 1998 14.60 (47,96) 17.33 (22,53) 27.05 (14,82) 21.62 (18,24)
Table 3-d. % share distribution and the growth rates of the gross additions to fixed capital for 4 important manufacturing sectors
Inferior sectors years 31 32 35 38 1981 7.64 13.41 17.25 18.98 1985 8.49 (-35,16) 29.26 (146,85) 20.18 (18,63) 20.16 (29,39) 1990 7.09 (37,56) 18.10 (10,38) 14.55 (35,10) 14.95 (27,83) 1995 9.94 (28,78) 25.60 (63,40) 19.53 (53,33) 18.33 (-13,74) 1998 13.73 (62,65) 24.82 (4,12) 17.14 (18,91) 21.92 (13,80) Source: Calculations are performed by the author using SIS data (Manufacturing Industry Censuses for
1981-1998). Values in the parenthesis are growth rates of the value added and gross additions to fixed capital of the enterprises to the preceding census value of the value added and gross additions to fixed capital of the enterprises, accordingly (Xt-Xt-1/Xt). Value added and gross additions to fixed capital are deflated by 1981=100 manufacturing WPI.
Examining Table 3-c and Table 3-d, it is clear that (31) food sector’s share of the total value added created in the manufacturing industry follows a decreasing trend, except for the period 1981-1985. However, it is noteworthy that the real value added
in the sector shows positive growth rates: % 18.11 between 1981-1985, %9.30 in the period 1985-1990, %24.32 for 1990-1995 period and % 47.96 in the last period of our analysis (1995-1998). Taking the gross additions to fixed capital into consideration similar trend is observed. Although, insufficient credit conditions and involuntary economic effects of the 1981-1985 period, which leads the shrink of % 35.16, food sector soon recovers its position and makes an addition to its fixed capital in real terms (%37.56 in 1985-1990, % 28.78 for the period 1990-1995 and % 62.65 between 1995-1998). The gross addition for fixed capital share of the sector in the total decreases to %7.09 for the period 1985-1990, but with its high growth rates in the period 1990-1998 it increases its share to % 13.73 in 1998.
(32) Textile sector systematically increases its percentage share of the total value added created in the manufacturing industry between years 1981-1998. The real value added created by the sector is again has a growing trend and 1990-1995 is the period that growth of the textile sector is most recognizable (%32.51). Sector’s gross addition to fixed capital has its higher share of the total manufacturing industry in 1981-1985 period with the real growth rate of % 146.85. In 1985-1990, the shrink in the real growth rate of gross additions of fixed capital is also reflected on the share of the industry and the sector loses nearly % 10 of its industry power. For the period 1990-1995, the sector recovers its important position in the total gross additions to fixed capital of the industry by its growth of %63.40 in real terms. In the last period of our analysis (1995-1998), the share of the sector in the manufacturing industry slightly decreases, as the real growth rate is % 4.12 that is so low for the period.
(35) Manufacture of chemicals sector has the greatest share of the value added created in the manufacturing industry in 1981 (%32.81) and it carries on its significant position despite the fluctuations in its share of the total manufacturing value added for the years 1981-1998. Between 1981-1985, the value added share of the sector is sharply decreased to %25.78 although there is %19.99 real growth tendency of the sector’s value added. In the same period sector’s gross additions to fixed capital share expands in line with its %18.63 growth in real terms. For 1985-1995 period similar characteristics for both value added and gross additions to fixed capital share of the sector is recognized. In this phase, the industry shares of the sector in both criteria’s follow an upward trend with increasing real growth rates for the period. The highest real growth rates for value added and gross additions to fixed capital are recognized for the period 1990-1995, which is %32.51 and %53.33, respectively. The post-1995 period again the value added and gross additions to fixed capital have similar trends, in both of these criteria's the share of the manufacture of chemicals sector decreases according to the decline in the real growth rates, which are %14.82 and %18.91, respectively.
(38) Manufacture of fabricated metal products sector have an increasing tendency in its the value added share of the total. In 1981, it is the third sector of the manufacturing industry according to the comparison of the value added shares of the sectors (%16.11). However, in 1998, its value added share increases to %21.62 and becomes the second important sector of the manufacturing industry. In 1985-1990 period, important progress in the sector is reflected with the real growth rate of %31.49. Post-1990 period the real growth rate of the sector slows down, but this
does not affect the industry share of the sector. Manufacture of the fabricated metal products sector has contributed to the highest share of the gross additions to fixed capital of the industry during 1981. In spite of its increased share for 1981-1985 as well as its positive real growth rate, it becomes the third important sector considering gross additions to fixed capital. 1985-1995 is the recession period of the real growth of the sector’s gross additions to fixed capital with a shrink of %13.74 in 1990-1995 period. Although, the sector shrinks in 1990-1995 period, its share in the total manufacturing industry increases to %18.33. In the post-1995 period with a real growth rate of %13.80, the sector increased its share of the gross additions to fixed capital to %21.92 in 1998 and takes part as the second important sector for the manufacturing industry’s gross addition to fixed capital during 1998.
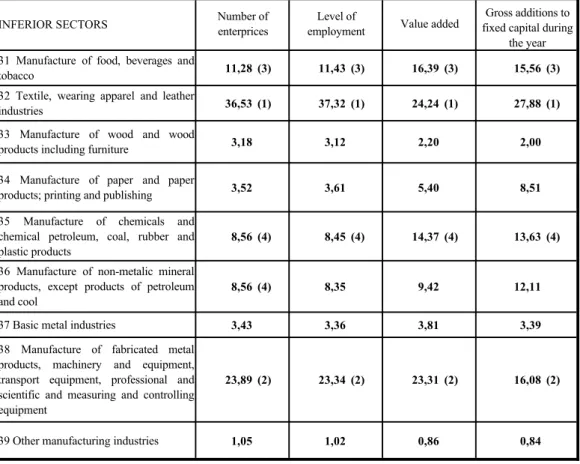
Furthermore, it is necessary to consider the characteristics of enterprises classified according to their size. Tables 1-623 give us a general view of the small-sized, medium-sized and large-size enterprises. Comparison of these tables shows us that in all sizes of enterprises employment level and enterprise number are distributed similarly between sectors whereas textile sector is the most important sector. Another important observation from this comparison is the direct relation between number of enterprises and level of employment. Similar trends are observed for small, medium and large-sized enterprises, when the growth rates and percentage shares of both employment level and number of enterprises are considered. The characteristic of food sector is an important issue, as it displays no difference considering the size definitions of enterprises. Moreover, it is clear that small-sized
and medium-sized enterprises have similar characteristics. For both of them textile sector increases its share in the industry through years. Food sector and manufacture of fabricated products sector have decreasing trend for their shares in the industry, except for the gross additions to fixed assets item whereas manufacture of chemicals sector has diminishing tendency in its industry share of all considered items. On the other hand, large enterprises have different characteristics than small-sized and medium-sized enterprises. Considering large enterprises, textile sector and manufacture of fabricated metal products sector have general upward trend in their shares but they have lower employment share and lower share of number enterprises, accordingly. Manufacture of chemicals sector’s downward trend in its shares is observed generally, except for the employment share of the sector.
To sum up, expansion of number of enterprises and the increasing tendency of employment in these sectors is very sensitive to structural problems of the economy, national and foreign economic crisis, modification of the governmental policies and the size of the financial support reserved for SME’s. Examining SME’s real contribution to country’s value added and their gross additions to country’s fixed capital also supports this result24.
3.2 SECTORAL CLASSIFICATION OF TOTAL INVESTMENT INCENTIVES
In this section of the thesis, we investigate the investment incentives reserved for the manufacturing sub-sectors. Discussing this concept is crucial to understand whether government plays a role in the development of four important sectors mentioned in the previous subsection or not. If we can find out strong evidences that the
government provided some funds to these sectors, then one can easily conclude that those incentives creates more employment and increase the level of output in these sectors.
In Figure2 and Figure3, the percentage share of the four important sectors of the previous analysis is shown according to sectoral classification of total investment and total number of incentive certificates in Turkey.
Generally, %5-6 of the total investment incentives in Turkey is reserved for (31) food sector. In 1981 with its %7.04 share of the total investment incentives in Turkey, it is the third important sector of the manufacturing industry. Then, the low level of the share of the food sector makes a peak in 1986 with %11.93 and it has the highest share of the total investment incentives in the manufacturing sector. In 1987 the investment level reserved for the food sector dramatically declines to %1.98 and reaches its lowest level in 1988 with %1.81. Examining Figure3, it is clear that the sight we gain by the share of the food sector in investment incentives is not really fit to the number of certificates’ share of the sector. There is a declining trend for the number of incentive certificates’ share of the sector through years except for 1985,1990 and 1996. The highest level of the number of incentive certificates share
FIGURE.2 PERCENTAGE SHARE O F NUMBER O F INCENTIVE CERTIFICATES 0,00 10,00 20,00 30,00 40,00 50,00 60,00 1981 1983 1985 1987 1989 1991 1993 1995 1997 1999 % 31 32 35 38
reserved for the sector is in 1996 with %12.62, yet the percentage share of the investment incentives for the sector is not enough with %3.03.
(32) Textile sector has a significant position regarding the total investment incentives and number of certificates reserved. The sector has %26.34 of the total investment incentives in 1984 and %36.50 of the total investment incentives in 1990. Between 1992-1997, textile sector improves its position by having nearly %30 of the total investment incentives. The importance given to textile sector is clearly seen by examining the graph of the percentage share of the total number of incentive certificates in Turkey reserved for the sector. Similar to total investment incentive share of the sector, in 1995 textile sector reaches its peak level of the percentage share of the total number of incentive certificates.
FIGURE.3 PERCENTAGE SHARE O F AMO UNT O F INVESTMENT INCENTIVES 0,00 5,00 10,00 15,00 20,00 25,00 30,00 35,00 40,00 45,00 50,00 55,00 60,00 65,00 70,00 1981 1983 1985 1987 1989 1991 1993 1995 1997 1999 % 31 32 35 38
(35) Manufacture of chemicals sector’s percentage shares of both the total number of incentive certificates and the total investment incentives are not so significant. But, the increasing trend of the total number of incentive certificates share of the sector implies that there is a significant support for the sector. For periods 1987-1990 and 1991-1995, this support diminishes as the total number of incentive certificates share of the sector decreases. In 1991, the ascending total number of incentive certificates share reserved for the sector is also reflected in investment incentives with %20.02 share of the sector. Trivial decrease in the trend of the sector between 1991-1995 is reflected on the percentage share of the total investment incentives of the sector with low reservation of the investment incentives, except for 1994. Instead of ascending graph of percentage share of the number of incentive certificates for the sector, there are fluctuations for the investment level reserved for the sector in total.
(38) Manufacture of fabricated metal products sector has higher share levels of investment incentives in 1981, 1992, and 1993 and makes a peak in 1982 by having %34.85 of the total investment incentives in Turkey. Number of incentive certificates reserved for the sector follows a fluctuating trend. The sector’s number of incentive certificate shares make a peak in 1993 with %15.40 of the total and %18.27 of the total investment incentives are reserved for the same year. The lowest share level of the number of incentive certificates of the manufacture of fabricated metal products sector is in 1990 with %6.12, yet the percentage share of the total investment incentives for the sector is not so low with %9.97 of the total investment incentives in Turkey.
In the periods of economic fluctuation, the capacity utilization ability of SME’s is affected negatively by the decline in their production and sales levels, which causes uncertain environment for wages, costs, employment and investments. In such a situation, small enterprises are more flexible than the large enterprises and they come over these crisis environments by their production diversity, which directs to an increase in their productivity level. In the process of industrialization, flexibility means to pass from one production process to another, and to regulate the production amount easily in the short-run25. SME’s are affected less from the crisis as their level of flexibility increase. In 1994-which is also included in our research period-economic crisis and financing problems affect the activities and development of the SME’s negatively.
CHAPTER 4
LITERATURE SURVEY ON WAGES, EMPLOYMENT
AND PRODUCTIVITY
After Phillips (1958) introduced the relationship between the wage rate (inflation) and the unemployment rate by using the famous Phillips Curve, determination of wages and its relation with unemployment became one of the main considerations of the labor economics. In our study, employment, which is the complement of unemployment, is used due to the fact that in Turkey unemployment is hard to figure out. Generally, most of the studies contribute to the relationship between wages and unemployment, but in this part of the thesis we investigate early literature considering the studies that either use employment rather than unemployment or display the relationship between productivity and wages.
Ioannides and Pissarides (1985) conduct a two period overlapping generations model considering the relation between wages and productivity in which both junior
and senior labor are assumed to maximize objective functions accordingly. Interestingly, they conclude that if the firm has monopsony power for junior workers in the market, wages of senior labor is set equal to their productivity whereas the productivity level of junior labor exceeds their wages. In contrast, if firms are not bounded to contractual commitments, senior wage level fall short of their productivity level.
Graafland and Lever (1994) investigate whether internal forces (productivity) or external forces (wages paid elsewhere and unemployment rate) are the main determinant of wages by GMM estimation. Their results display that the connection between wages and sectoral output prices and productivity in service sector is more visible than industrial sectors.
Amsden and Hoeven (1996) focus on manufacturing industry of developed, developing (excluding Asia) and Asian developing countries so as to examine the relation between wages, output, employment and production capacity. Results of the conducted regressions display that in developing countries wages are significantly linked to output rather than employment. The study includes Turkey under the Asian developing countries classification as a country having falling wages, falling or stagnant output, rising employment characteristics.
Arestis, Biefang and Mariscal (1997) estimate a vector autoregressive regression (VAR) model for the determination of labor productivity, real wages and unemployment. They report proportionality between labor productivity and real
wages implying that the productivity gains are absorbed by increases in wages without affecting unemployment. In the study unemployment is used as an instrument in the efficiency wage hypothesis.
Nordic Countries study by Alback, Asplund, Blomskog, Barth, Guamundsson, Karlsson and Madsen (1999) deviate from the main conclusions of the general wage curve analysis. They conclude that there is no evidence of a wage curve at regional level in the Nordic Countries as lagged wage rate comes out with a coefficient different from zero and the estimates of the lagged variable are not enough to show the existence of wage curve relation. Therefore, in this study they find no stable negative relation between wages and unemployment. Nevertheless, as the long-term relationship between regional wages and unemployment is negative, they conclude that productivity and labor market conditions have permanent effects on relative wages.
Generally, the wage curve is estimated by using the connection between wages and unemployment. However, for New Zealand, Morrison, Papps and Poot (2000) also find evidence for wage curve by using employment rate instead of unemployment and conclude that there is positive relation between employment rate and wages for males only. Instead, they include skill levels in their study and find that less mobile groups of workers are more responsive to changes in unemployment rate.
It is worth noting that, Guichard and Laffargue (2000) also report productivity has positive and significant impact on wages in all 16 countries they considered, except Greece, Spain and Portugal by their country specific productivity and employment rate model. Moreover, the negative relationship between unemployment and wage rate is supported by their study.
Another analysis is done by Bjornstad and Nymoen (2000). They examine the linkage between wage setting and profitability and conclude that the rate of return specification implied that wages are interlinked with value added, productivity and capital-labor ratio.
Borjas and Ramey (2000) study the relationship between initial industry wage premia and the adjustment of other economic variables. The evidence suggests that industries that had initially high wages experienced not only slower employment growth, but also slower GDP growth. Moreover, these industries also experienced significantly greater growth of labor productivity and capital-labor ratios.
There are also many other studies about the Turkish manufacturing industry. Metin (1995b), which composes a research for the manufacturing industry in order to examine the dynamic adjustment process of wage and price determination in Turkey by using the multi-cointegration analysis. Metin (1995b) concludes that real wages; labor productivity and inflation determine unemployment level.
In addition, Metin (1995a) analyses the effects of productivity on wage behaviour regarding Turkish iron steel basic industry and manufacture of industrial chemicals by the seasonal unit-root testing method, cointegration and OLS estimation.
Concluding remarks of the analysis are that productivity is negatively related to real wages in chemical industry whereas positive impact of productivity on real wages are observed for iron and steel industry with slightly higher value exceeding one.
Yenturk (1997:34-42) conducts a research to find out the relation between wages, employment and investments in Turkish manufacturing industry. She concludes that Turkey has stagnationary regime, wages are mainly influenced by government policies and manufacturing industry’s sub-sectors has growth that depends on the capacity usage ratio.
Yeldan and Voyvoda (1999) investigate the distributional consequences of post-1970 accumulation patterns and technological change in the Turkish manufacturing industries by considering 19 sub-sectors. They report that post-1980 export orientation of Turkish manufacturing industry could not lead to productivity gains in the leading sectors which means the strategy of industrialization is not viable.
Metin-Ozcan, Voyvoda and Yeldan (1999) constitute cyclical co-movements of economic variables in order to observe the dynamics of macroeconomic adjustment in Turkey. They find that manufacturing real wages in private sectors have weak correlations with average labor productivity and counter-cyclical correlations against real output.
Finally, Metin-Ozcan, Voyvoda and Yeldan (2000) investigate the accumulation patterns in the Turkish manufacturing industry and they conclude that real investments in the sector have direct relation with real wages and profit margins.
Metin-Ozcan (2001) discusses the importance of micro-small enterprises (employ 1-9 persons) and investigates the historical development in the four important sub-sectors of the manufacturing industry. She concludes that micro-small enterprises are highly sensitive to structural economic problems, policy implications, the change in incentives reserved and both domestic and foreign economic crisis.
The most recent studies support the evidence of relation between productivity and wages as well as employment-wage relationship also in Turkey, in this thesis the role of employment and productivity in wage determination process will be discussed and tested for Turkish manufacturing industry regarding both manufacturing sub-sectors and SME’s.
CHAPTER 5
EMPIRICAL ANALYSIS
In this chapter of the thesis our aim is to test the the relationship between wages, productivity and employment using two different methodologies. First we used, Ordinary Least Squares (OLS) method to estimate the relationships. Secondly we calculate the descriptive growth rates to observe the existence of the relationships for the period of 1981-1998. However, it is important to note that the direction of the causality between employment and wages should be determined first before one starts with the empirical analysis (see Yenturk (1997:14). To determine the direction of causality, we applied Granger causality26 test for 9 sub-sectors and the total manufacturing industry27. For most of the sectors Granger causality test is not found meaningful as the probabilities are insignificant. In (31) food sector, (36) manufacture of non-metalic mineral products sector and (37) basic mineral industries real annual payments to employees have predictive power for employment level for one lag. Therefore, the hypothesis that real annual payments to employees
26 For Granger Causality test see Gujarati, Damador N. Basic Econometrics, 3rd ed., Mc Graw-Hill,
New York, 1995.
does not Granger cause of number of employees is strongly rejected. On the other hand, in (35) manufacture of chemicals sector and (36) manufacture of non-metalic mineral products sector number of employees have predictive power for wages and the hypothesis of no Granger causality is strongly rejected. Since the results of Granger causality test is producing mixed results, in the empirical analysis part of this thesis, we further concentrate on the OLS estimation results and decomposition analysis.
5.1 ANALYSIS OF LEAST SQUARES ESTIMATION
The least squares estimation method is applied in our thesis in order to determine the relationship between wage and productivity as well as wage and employment. In Table 4 the sectoral results of the estimation is listed for both cases.
TABLE.4 REGRESSION OUTPUT
wage-productivity wage-employment
Sectors ß st.error t-stat. prob. ß st.error t-stat. prob.
31 0.84 0.15053 5.557472 0 -2.94 0.940845 -3.1244569 0.0065 32 1.14 0.175224 6.502087 0 1.06 0.135089 7.837929 0 33 0.8 0.135159 5.919377 0 1.17 0.422785 2.758528 0.014 34 0.58 0.089899 6.496194 0 0.65 0.724839 0.892931 0.3851 35 1.12 0.108092 10.33066 0 2.74 0.551598 4.967853 0.0001 36 0.67 0.8247 8.129213 0 0.9 0.668135 1.349384 0.196 37 0.29 0.105627 2.813332 0.0125 -0.83 0.513243 -1.608978 0.1272 38 0.83 0.087219 9.497049 0 2.11 0.263266 8.017107 0 39 1.06 0.153041 6.943272 0 1.37 0.170316 8.024289 0 total 0.93 0.10803 8.599595 0 1.81 0.363654 4.965056 0.0001 private 1.02 0.123057 8.30623 0 1.64 0.174282 9.427853 0 public 0.31 0.147215 2.095008 0.0524 0.01 0.018652 0.661221 0.5179 10-49 0.75 0.093926 7.974227 0 1.59 0.562522 2.829512 0.0121 50-199 0.94 0.115705 8.128283 0 1.41 0.141973 9.935388 0 200+ 0.691124 0.045186 15.29524 0 0.837713 0.676534 1.238243 0.2335
Regarding wage and productivity relation, we have clear evidence that a statistically significant increase in productivity level increases the wages. In (32) textile sector,
(35) manufacture of chemicals sector and (39) other manufacturing industries elasticities exceed one, so in these sectors wages are more responsive to productivity shocks. It is worth noting that (37) basic metal industries is the sector in which the wages are less responsive to the productivity shocks, this may be stemmed from its elastic characteristic.28 Taking the size definition of enterprises into account,similar to large-sized enterprises, small and medium-sized enterprises have significant elasticities for wage-productivity relationship, they are more responsive to the productivity shocks than large-sized enterprises. Another critical point is that public sector do not display a significant productivity effect on wages, however, both private sector and total manufacturing industry are in line with the sub-sectors by having significant and high elasticities.
Wage-employment relationship shows very different characteristics among sectors. In (31) food sector employment has significant negative effect on wages. For (34) manufacture of paper sector, (36) manufacture of non-metallic mineral products sector and (37) basic metal industries relationship between wage and employment is not significant. In the rest of the manufacturing sectors wages are highly influenced by the changes in employment level. Considering enterprises according to size definitions29, the relationship between wages and employment level is not significant for large enterprises. On the contrary, in small and medium-sized enterprises the relation between wages and employment level is obvious. Wage-employment relationship is also significant for both private sectors and manufacturing industry with elasticities exceeding 1.5. Examining the effects of