DEVELOPMENT OF DROPLET BASED
MICROFLUIDIC SYSTEM FOR
AGGLUTINATION ASSAYS
a thesis submitted to
the graduate school of engineering and science
of bilkent university
in partial fulfillment of the requirements for
the degree of
master of science
in
material science and nanotechnology
By
Merve Mar¸calı
October, 2015
DEVELOPMENT OF DROPLET BASED MICROFLUIDIC SYS-TEM FOR AGGLUTINATION ASSAYS
By Merve Mar¸calı October, 2015
We certify that we have read this thesis and that in our opinion it is fully adequate, in scope and in quality, as a thesis for the degree of Master of Science.
Asst. Prof. Dr. C¸ a˘glar Elb¨uken (Advisor)
Asst. Prof. Dr. Ender Yıldırım
Asst. Prof. Dr. Aykutlu Dˆana
Approved for the Graduate School of Engineering and Science:
Prof. Dr. Levent Onural Director of the Graduate School
ABSTRACT
DEVELOPMENT OF DROPLET BASED
MICROFLUIDIC SYSTEM FOR AGGLUTINATION
ASSAYS
Merve Mar¸calı
M.S. in Material Science and Nanotechnology Advisor: Asst. Prof. Dr. C¸ a˘glar Elb¨uken
October, 2015
Agglutination reactions have been carried out for several applications such as assessment of bacterial infection, blood typing or detecting non-infectious dis-eases. To observe agglutination reactions, several approaches have been devel-oped. Although microfluidic methods are more costly compared to the common methods in clinical practice, microfluidic systems provide a reliable and more con-trolled environment. Due to the ability of droplet based systems to manipulate minute volumes of fluids, microfluidic systems allow screening of several aggluti-nation reactions at a single run. In comparison to standard microfluidic devices, droplet based microfluidic systems provide efficient mixing which is a crucial parameter for agglutination reactions. This study reports detection of agglutina-tion reacagglutina-tions of whole blood in microdroplets using impedimetric measurement method. As a proof of concept demonstration of agglutination reaction, blood typing method was implemented in microdroplets. Using label free impedimetric measurement approach, agglutination reaction in microdroplets was monitored. Impedance monitoring was achieved using microelectrodes in the microchannel to measure the impedance signal generated by droplets in the continuous phase. Besides monitoring the reaction, an empirical approach was applied to find the lumped element model of the system. This model can be used as a guidance to design a detection system and to test the sensitivity of the detection system that is used for other type of immuno-diagnostic assays in microdroplets.
Keywords: droplet based microfluidics, droplet merging, droplet detection, im-pedimetric measurement, agglutination assay, equivalent circuit modelling.
¨
OZET
AGL ¨
UT˙INASYON TAHL˙IL˙I ˙IC
¸ ˙IN DAMLACIK
TABANLI M˙IKROAKIS
¸KAN S˙ISTEM˙I
GEL˙IS
¸T˙IR˙ILMES˙I
Merve Mar¸calı
Malzeme Bilimi ve Nanoteknoloji, Y¨uksek Lisans Tez Danı¸smanı: Asst. Prof. Dr. C¸ a˘glar Elb¨uken
Ekim, 2015
Agl¨utinasyon reaksiyonları enfeksiyonel hastalıkları tespit etmek ya da kan tip-ini belirlemek i¸cin uygulanmaktadır. Agl¨utinasyon reaksiyonlarını g¨ozlemlemek i¸cin birka¸c y¨ontem geli¸stirilmi¸stir. Klinik uyguluma a¸cısından mikroakı¸skan metodlar daha maliyetli olsa da, mikroakı¸skan sistemler daha g¨uvenilir ve kon-troll¨u bir ortam sa˘glamaktadırlar. Damlacık tabanlı mikroakı¸skan sistemlerde ayrı hacimlerdeki sıvıların manipule edilebilirli˘gi sayesinde tek bir seferde farklı agl¨utinasyon reaksiyonları ger¸cekle¸stirilebilir. Ayrıca agl¨utinasyon reaksiyonları i¸cin ¨onemli bir parametre olan karı¸stırma i¸slemi damlacık tabanlı mikroakı¸skan sistemlerde daha etkin bir ¸sekilde ger¸cekle¸stirilmektedir. Agl¨utinasyon reak-siyon kavramının ispatı a¸cısından kan tipi belirleme metodu kullanılmı¸stır ve etiketlemesiz empedans ¨ol¸c¨um metodu ile reaksiyon g¨or¨unt¨ulenmi¸stir. Empedans ¨ol¸c¨umleri mikrokanalın altına yerle¸stirilen mikroelektrotlar yardımı ile yapılmı¸stır. Reaksiyonun g¨or¨unt¨ulenmesinin yanında, deneysel verilerden yarar-lanılarak analitik model y¨ontemi uygulanmı¸stır. Bu model farklı mikrodamlacık tabanlı imm¨uno-te¸shis tahlileri i¸cin ¨ol¸c¨um sisteminin dizaynında ve hassasiyetinin test edilmesinde rehber olarak kullanılabilir.
Anahtar s¨ozc¨ukler : damlacık tabanlı mikroakı¸skan, damlacık birle¸stirme, damlacık tespiti, empedimetrik ¨ol¸c¨um, agl¨utinasyon tahlili, e¸sde˘ger devre mod-ellemesi.
Acknowledgement
First of all, I would like to express my sincere gratitude to Dr. C¸ a˘glar Elb¨uken for his guidance, knowledge throughout my studies. I would like to offer my deepest appreciation to him providing me high quality education for my future carrier and assist me to develop my research skills and to collaborate in various projects. In addition, I would like to thank Prof. Dr. Bora Garipcan, Asst. Prof. Dr. Ay¸se Beg¨um Tekinay for sharing their valuable knowledge during our collaboration. Moreover, I would like to thank Dr. Ender Yıldırım and Dr. Aykutlu Dˆana for improving quality of my work and my thesis with their helpful comments and suggestions.
Funding for this research was partially provided by (Scientific and Technolog-ical Council of Turkey) T ¨UB˙ITAK, with grant number 213S127.
Special thanks belong to my friends, Ercan Savcı, Ozan C¸ elik, Meltem Erdem, Alican Noyan, ˙Inci D¨onmez, Deniz Kocaay, Levent Erdal Ayg¨un, Dr. Fatih Bilge Atar, Feyza Bozkurt Oru¸c, Adem Sara¸c Ay¸se ¨Ozcan, Berk Berkan Turgut, Volkan H¨unerli, Canan Kur¸sung¨oz, ˙Ismail Kupa, Elif S¸im¸sek, Bartu S¸im¸sek, Ahmet Emin Topal, Ali Haider, Seda Kizir, T¨urkan Bayrak, Sami Bolat, Hamit Eren and Abdullatif ¨Onen for amusing memories we spent together. For those whom I have not mentioned above, I sincerely thank all people I met during last two years in UNAM.
I thank Elb¨uken group family members, Pelin K¨ubra ˙I¸sg¨or, Berkan Aydo˘gdu, Mustafa Ko¸c, ¨Omer ¨Ozdemir, Ozan Yakar for being nice friends to me. I also thank to UNAM cleanroom team Semih Ya¸sar, Fikret Piri and Hakan S¨urel for their cooperation.
I thank all my collaborators, ¨Ozgen ¨Ozdemir, Berna S¸ent¨urk, Nurcan Ha¸star, Dr. Mehmet Kanık, Muhammed Yunusa, Dr. Bihter Da˘glar for their help and contribution to this work.
vi
There are no words to express my deepest sense of gratitude to my parents Esin and Mehmet Mar¸calı and my dear brother Emre Berke Mar¸calı, who always give me faithful support and inspirational advice. I always feel debted to them.
I would like to specially thank my boyfriend, Burak Tekcan. Since the day we met, his deepest love, patience and sense of humour made me feel more positive than ever. Without his endless support I could not manage to overcome obstacles that I face with. (Thanks to ”mervesan adapt¨or ”)
Contents
1 Introduction 1
1.1 Motivation of the Thesis . . . 1
1.2 Overview of Thesis . . . 3
2 Literature Review 4 2.1 Introduction to Microfluidics . . . 4
2.1.1 History of Microfluidics . . . 4
2.1.2 Advantages of Microfluidics . . . 5
2.2 Basic Physics of Microfluidics . . . 5
2.2.1 Continuum Approximation . . . 5
2.2.2 Flow Profiles in Microchannel . . . 6
2.2.3 Dimensionless Numbers that Effects Droplet Formation . . 7
2.3 Classification of Microfluidics . . . 8
CONTENTS viii
2.4 Detection Methods for Microfluidic System . . . 15
2.4.1 Optical Detection . . . 15
2.4.2 Electrochemical and Electronic Detection . . . 16
2.5 Agglutination Reaction Mechanism and Detection Methods . . . . 18
3 Fabrication, Design and Characterization of Microfluidic Device 21 3.1 Fabrication of Microfluidic Device . . . 22
3.1.1 Fabrication process of Microchannel . . . 22
3.1.2 Fabrication Process of Microelectrodes . . . 25
3.2 Surface Modification of Microfluidic Chip . . . 29
3.3 Characterization and Optimization of Microfluidic Chip . . . 32
3.3.1 Ellipsometer . . . 32
3.3.2 Profilometer . . . 33
3.3.3 Surface Characterization with XPS (X-Ray Diffraction Spectroscopy . . . 34
3.3.4 Contact Angle . . . 36
3.4 Design of Microchip . . . 38
3.4.1 Design of Microchannel . . . 38
3.4.2 Design of Microelectrodes . . . 48
CONTENTS ix
Droplets 50
4.1 Introduction . . . 50
4.1.1 Impedance Theory . . . 50
4.2 Experimental Studies . . . 52
4.2.1 Materials and Blood Sample Preparation . . . 52
4.2.2 Microdevice Design and Droplet Generation Mechanism . . 53
4.2.3 Measurement Setup . . . 55
4.3 Experimental Results . . . 59
4.3.1 Effect of Bias Voltage on Impedance Signal . . . 63
4.3.2 Effect of Blood Sample Concentration on Impedance Signal 66 5 Numerical Modelling and Simulation of Agglutination Reaction of RBCs in Droplet 68 5.1 Equivalent Circuit Modelling . . . 68
5.2 Investigation of Stray Capacitance and Inductance of Probes . . 72
5.2.1 Stray Capacitance Measurement . . . 72
5.2.2 Stray Inductance Measurement . . . 77
5.3 Determining Electrical Properties of Solutions . . . 82
5.3.1 Modelling Silicone Oil in Channel . . . 82
CONTENTS x
5.3.3 Conclusion . . . 86
5.4 Modelling of Droplets in Microchannel . . . 88
5.4.1 Modelling Antibody Serum Droplet in Channel . . . 88
5.4.2 Modelling Whole Blood Droplet in Channel . . . 90
5.4.3 Modelling Plasma in Droplet in Channel . . . 91
5.4.4 Modelling Agglutinated RBCs Droplet in Channel . . . 93
5.5 Conclusion . . . 94
6 Conclusions 95 6.1 Conclusion . . . 95
6.2 Future Work . . . 96
List of Figures
2.1 Illustration of agglutination reaction of RBC’s . . . 18
3.1 Schematic of photolithography process for SU-8 2050. . . 24
3.2 Schematic of softlithography process for PDMS microchannel. . . 25
3.3 Schematic of deposition in sputtering system. . . 26
3.4 Schematic of deposition in thermal evaporator system. . . 27
3.5 Schematic of lift off process. . . 28
3.6 Schematic of reaction mechanism in PECVD. . . 29
3.7 Schematic of ellipsometer measurement setup (a) and measurement method (b). . . 33
3.8 Schematic of a profilometer and measurement method. . . 33
3.9 Schematic of XPS working mechanism. . . 34
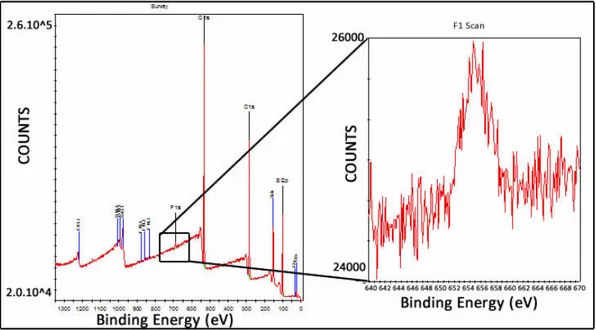
3.10 XPS measurement result of the PDMS surface that was used in Modification-A, percentage of the Flor molecule concentration was % 1.62. . . 35
LIST OF FIGURES xii
3.11 XPS measurement result of the PDMS surface that was used in Modification-B, percentage of the Flor molecule concentration was
% 72. . . 36
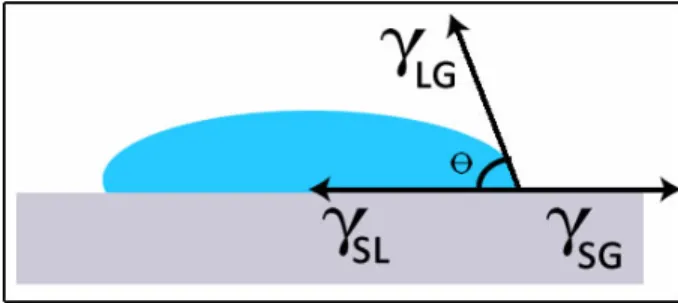
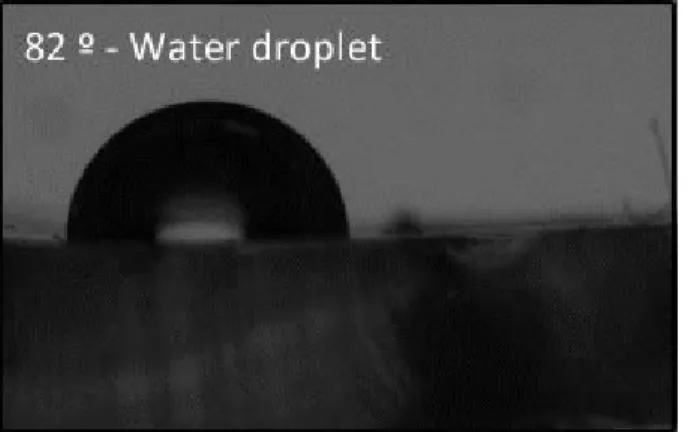
3.12 Illustration of contact angle and surface tension between surfaces. 36 3.13 Measured contact angle of PDMS that was treated using modifi-cation B. . . 37
3.14 Measured contact angle of PDMS that was treated using modifi-cation C. . . 38
3.15 Measured contact angle of PDMS that was treated using modifi-cation D. . . 38
3.16 Schematic of microfluidic channel design. . . 39
3.17 Microscope image of PDMS surface wetting. . . 40
3.18 Microscope image of PBS droplet formation in T-junction. . . 40
3.19 Microscope image of cell adhesion in channel. . . 41
3.20 Schematic of microfluidic channel design. . . 42
3.21 Microscope image of droplet formation in jetting regime. . . 42
3.22 Microscope image of surface wetting (a) flow focusing region, (b) serpentine part of the channel, (c) detection region of the channel. 43 3.23 Microscope image of droplet formation in fluorinated channel (a) single droplet in flow focusing region, (b) droplet that was flowing through the outlet, (c,d) sticking of the blood sample to the surface. 44 3.24 Microscope image of droplet formation using silicone oil in flow focusing channel design. . . 44
LIST OF FIGURES xiii
3.25 Microscope image of droplet formation using silicone oil in flow focusing channel design and injection of antibody serum from the
side channel. . . 45
3.26 Schematic of microfluidic channel design. . . 46
3.27 Schematic of microfluidic channel design. . . 47
3.28 Microscope image of droplet formation and blood sample injection in the channel. . . 47
3.29 Schematic of microelectrode design. . . 48
3.30 Illustration of data acquisition with passivated and bare electrodes. 49 4.1 Illustration of impedance in coordinate system. . . 51
4.2 Schematic of final microchannel design. . . 53
4.3 Microscope image of droplet formation. . . 54
4.4 Image of measurement setup. . . 55
4.5 Illustration of circuit of LCR Meter connection to DUT. . . 56
4.6 Probes of the LCR Meter. . . 57
4.7 Pressure pump and vial connection. . . 58
4.8 Glass vials and fluid flow direction. . . 58
LIST OF FIGURES xiv
4.10 Impedance of four different droplets in the combination a) impedance of whole blood droplet - 13 kΩ b) droplet of antibody solution - 9 kΩ c) agglutinated droplet clusters - (30-34 kΩ), mix-ture antibody-PBS - (10 kΩ) d) non-agglutinated droplet - 15 kΩ. 62 4.11 Microscope image of single agglutinated droplet at high
magnifi-cation. . . 63 4.12 Voltage dependence of impedimetric measurement. . . 64 4.13 Schematic of EDL- electrical double layer on metal surface. . . 65
5.1 Equivalent circuit model of microchannel a) channel without cell, Cdl is electrical double layer, Cmedium is the capacitance of of the
medium, Rmedium is the resistance of the medium b) channel with
cell, Cdl electrical double layer, Ccell and Rcell are the capacitance
and the resistance of the cells and Cmem is the membrane
capaci-tance of the cell. . . 69 5.2 Equivalent circuit of microchannel with droplet (Cdmem is droplet
membrane, Rmediumand Cmediumare the resistance and capacitance
of the reagent in the droplet, and Cdl is electrical double layer
capacitance). . . 70 5.3 Equivalent circuit of microchannel with cells in droplet a)
illustra-tion of individual cells in droplet b) illustraillustra-tion of approximaillustra-tion of cells as a homogeneous analyte. . . 70
LIST OF FIGURES xv
5.4 Whole equivalent circuit design for the simulation a) model of con-tinuous phase in the channel b) model of antibody serum droplet c) whole blood droplet model d) agglutinated droplet model e) non-agglutinated droplet model (Cdl is the electrical double layer
capacitance, Cmem is the membrane capacitance of the droplets,
Ranti and Canti are resistance and capacitance of antibody
solu-tion, Rblood and Cblood are the resistance and capacitance of blood
sample, Ragg, Cagg are the resistance and capacitance relate to
clusters of agglutinated cells, R and C antibody-PBS represents resistance and capacitance of antibody-PBS mixture that remain after agglutination reaction, Rnon−agg, Cnon−agg components of non
agglutinated droplets). . . 71 5.5 Image of resistor connection to probes. . . 72 5.6 Frequency response of impedance for 433 kΩ. . . 73 5.7 Frequency response of impedance for 43 kΩ (a) and 433 Ω (b). . . 75 5.8 Circuit design in the simulation to determine stray capacitance. . 76 5.9 Simulation result for stray capacitance. . . 76 5.10 Fitting of experimental data with the simulation results for 433 kΩ
resistor. . . 77 5.11 Image of capacitor connection to probes. . . 78 5.12 Frequency response of impedance for 220 µF. . . 78 5.13 Circuit design in the simulation to determine stray inductance. . . 80 5.14 Simulation result for stray capacitance. . . 81 5.15 Fitting of experimental data with the simulation results for 220 µF
LIST OF FIGURES xvi
5.16 Schematic of final circuit design of LCR Meter. . . 82
5.17 Frequency response of silicone oil impedance in microchannel. . . 83
5.18 Circuit design for silicone oil in the simulation (a) and fitting re-sults (b). . . 84
5.19 Frequency response of antibody sera impedance in microchannel. . 85
5.20 Circuit design for antibody sera in the simulation (a) and fitting results (b). . . 86
5.21 Frequency response of analytes impedance in the channel based on the EDL formation. . . 88
5.22 Circuit design for antibody sera droplet in the simulation. . . 89
5.23 Impedance fitting of antibody serum droplet. . . 90
5.24 Circuit design for whole blood droplet in the simulation. . . 90
5.25 Impedance fitting of whole blood droplet. . . 91
5.26 Circuit design for antibody sera and PBS mixture part in the sim-ulation. . . 92
5.27 Impedance fitting of antibody sera and PBS mixture part of ag-glutinated blood droplet. . . 92
5.28 Circuit design for cluster part of agglutinated droplet in the simu-lation. . . 93
List of Tables
3.1 Recipe of metal layers for microelectrodes. . . 27 3.2 Recipe of metal layers for microelectrodes. . . 27
Chapter 1
Introduction
1.1
Motivation of the Thesis
In last few decades, microfluidics is known as one of the key technologies of the miniaturization. It has been developed in many disciplines such as biol-ogy, chemistry, and engineering in terms of applications. With the need of the miniaturization, droplet based microfluidics which is one of the branches of the microfluidics have been developed. In the light of these developments of droplet based microfluidics in recent years, this project aimed designing a droplet based microfluidic device that detects the agglutination reaction to take an advantages of parameters which are explained below.
Droplet based microfluidics have been defined as a new path for biological and chemical processes. In those processes, mixing of the reagents is the one of the fundamental requirement. Droplet based mixing is more efficient than mixing in other microfluidic systems due to the high surface/volume ratio in droplets. Since agglutination reaction requires a mixing of antibody and antigen molecules in the samples, better mixing property became a significant parameter while choosing the system to be developed in this study. Another concern of macro scale process
is remaining residues of the solutions that are used for reaction. Cross contami-nation of the reagents can be prevented due to the compartmentalization of the droplets in the channel. Last but not the least parameters for the chemical and biological processes is evaporation and consumption of the reagents. Due to the nature of the small size of the droplet, less reagents are wasted for the same quality reaction in comparison to macroscale reactions and due to the ability of droplets to encapsulate the reagents, evaporation of the solvents becomes negligible.
In addition, the analysis of the reactions in microfluidics are in wide range. Based on the analysis requirements, it is crucial to determine a better detection system that is suitable for analysis. In general, for the optical based detection sys-tems, a fluoregenic substrate is used which is used by attaching an extra reagents to label the desired material. This labelling process increases the contamination of the reactions and also effects the cell viability. Since this project included a reaction with the cells, impedimetric detection method which is one of the label free detection method was preferred.
Besides label free detection, electrical measurements provide analysing the data using an analytical approach like an electrical circuit model of the microfluidic devices. By using this model single cell in microchannel was investigated in order to understand the electrical properties of a single cell. However, there is gap in the modelling of the cells or any biological and chemical reactions inside droplets. In this study, an equivalent circuit model of cells of the whole blood sample in droplets was demonstrated. Moreover, agglutinated cells that occurred after reaction in droplets were also modelled. Using the empirical results, electrical components in the models were estimated. By considering the estimated values of the components in the simulation as a limit, sensitivity of the detection system can be tested. In addition, these estimated components can be a guide to understand whether the detection system is enough to measure such kind of reaction in droplet or not for future applications.
1.2
Overview of Thesis
This work is organized into the following chapters: Chapter 2 introduces literature review that composes of droplet based microfluidics, detection methods used in microfluidics and mechanism of the agglutination reaction. Chapter 3 represents the fabrication of the microfluidic device, design parameters of the microdevice and modification and characterization of the microdevice. Chapter 4 reports the impedimetric measurements that are executed to detect agglutination reaction in droplets. Chapter 5 discusses the results of the simulation for equivalent circuits of the microdevice. Chapter 6 gives a summary of this research and possible future work.
Chapter 2
Literature Review
2.1
Introduction to Microfluidics
In this chapter, a basic physics that microfluidics rely on are explained. Classifica-tion and biological applicaClassifica-tions of microfluidic devices are menClassifica-tioned. Moreover, this review examines the development of the detection methods, especially the impedimetric detection method.
2.1.1
History of Microfluidics
Roots of the microfluidics lie in the microelectronics industry. In the mid-20th century, Golay et.al. [1] have showed that, reducing the size of the columns and particles that were used for gas chromatography (GC) could increase the performance of their technique. With the help of the microelectronics fabrication techniques, first silicon based gas chromatography was developed at Stanford University by Terry et.al. [2]. Afterwards, first capillary electrophoresis (CE) was developed in a microchannel by Mathies et al. [3]. As the researchers continued to work on miniaturizing the GC and CE, new microfluidic devices have begun to be investigated by the researchers for the other applications as well.
2.1.2
Advantages of Microfluidics
With the scope of the miniaturizing, the most obvious advantage of the microflu-idic device is reduction of reagent consumption. This is important especially when reagents are expensive. In addition, with the small reagent requirements, the microdevices provide running an experiment even the reagents are limited. Depending on the application, heat transfer is another crucial parameter. Be-cause of the micron scale nature of the microfluidic devices, dissipation of heat is more efficient than other macro scale devices. Moreover, it is more effective to mix reagents in microchannel. Because, only diffusion provides mixing different reagents in the channel by itself.
In terms of the integrating the steps that is used for the analytical investigation, microdevices provide an easier way to combine steps in one device. These devices generally are known as µTAS (Micro Total Analysis System) or LOC (Lab on a Chip) devices. By applying an integration, contamination that mainly comes from human involvement can be reduced automatically.
2.2
Basic Physics of Microfluidics
2.2.1
Continuum Approximation
In macro scale, generally, fluid mechanics, all liquids are taken as continuous. While considering the properties of the liquids such as velocity and density, these parameters are taking as an average value instead of considering each molecule velocity and density in the liquid. This approximation is called as continuum approximation. Even though, every individual molecule becomes dominant in microscale, in order to analyse fluid behaviour in microscale this approach is used. This approximation suffers when gas molecules are used or few micron scale channels are used.
2.2.2
Flow Profiles in Microchannel
There are three basic flow profiles that is governed in the microchannel. Elec-troosmatic flow, Couette flow and the Pouseuille flow profiles [4]. In microfluidics devices, these flow profiles almost always are laminar. In order to understand the flow profile, there is a dimensionless number which is called as Reynolds Number. This parameter is used to determine whether the fluid flow profile is turbulent or laminar in the channel. The Reynolds number is defined as explained in the Equation 2.1.
Re = vL
η (2.1)
where η is the kinematic viscosity, v is the flow velocity and L is the char-acteristic dimension of the channel. When Re < 2300, flow in the most of the microfluidics system is laminar. Viscosity is a term that explains the fluid resis-tance to the flow and can be defined as in the Equation 2.2,
ν = µ
ρ (2.2)
where µ is the dynamic viscosity and ρ is the material density.
In addition, in the microdevice that is used for this study to detect aggluti-nation reaction, the flow is pressure-driven based flow type. Therefore, Navier-Stokes equation for the incompressible fluids in that flow profile can be derived as explained in the Equation 2.3,
~ du dt + (~v · ∇)~v = − 1 ρ∇P + η ρ∇ 2~v (2.3)
where η is the dynamic viscosity, P is the applied pressure and ~v is the velocity of the fluid. Left side of the equation includes time dependent inertial component and non-linear inertial component. On the right side of the equation, the first
term is pressure gradient that is applied to the system, and the second term is related to viscous dissipation. Since, inertial terms become smaller than viscous terms where the velocity of the fluids is small and time dependent property of fluid velocity, both terms on the left side of the equation are cancelled. Hence, fluid flow becomes proportional to the applied pressure and equation changes as shown in the Equation 2.4,
∇P = η∇2~v (2.4)
2.2.3
Dimensionless Numbers that Effects Droplet
For-mation
One of the important parameter to form droplets is the surface tension between the liquid-gas interfaces. These forces effect the parameter which is known as Bond number that is explained in Equation 2.5. Bond number is the parameter that compares the gravitational force and surface forces [5]. In microchannel Bo < 1 means, the effect of gravitation is negligible.
Bo = ∆ρgL
2
γ (2.5)
where ∆ρ is the difference in mass density between the two fluids, g the gravity acceleration, L is the characteristic length scale, and γ is the interfacial tension. Besides Bond number, the other dimensionless number that relates to surface forces is the Weber number. This number compares the inertial force with the surface forces which is important in the moment of the breakup of droplets. In order to define the Weber number Equation 2.6 is derived.
W e = ρLv
2
γ (2.6)
the liquid. We < 1 means, the inertia becomes unimportant when the dimensions of the channel is decreased [5, 6].
Shape of the droplet also depends on the other dimensionless number which is called as Capillary number. Capillary number can be defined in Equation 2.7. As explained in the equation, the capillary number compares the viscous forces with the interfacial tension. As the interfacial tension increases, the interfacial area of the liquid decreases which is crucial for the stability of the droplets [7].
Ca = ηv
γ (2.7)
where η is dynamic viscosity of the most viscous fluid in the two-phase system, v is the velocity of that phase, and γ is the interfacial tension. Ca >1 means vis-cous forces are dominant which results deformation in droplet shape and droplets started to break up at the downstream of the channel [7, 8].
2.3
Classification of Microfluidics
Microfluidics systems can be divided into four main groups such as paper based microfluidics, droplet based microfluidics, continuous microfluidics, passive mi-crofluidics and digital mimi-crofluidics.
In paper based microfluidic system, basically the chromatography paper is pat-terned to form a channel using a printer. These types of systems are also known as PAD (microfluidic paper-based analytical devices). For example, Whitesides’s group initiated a simpler and an inexpensive paper-based platform for 3D cell culture which was used to validate different cell proliferation profiles in oxygen and nutrient gradient environment [9]. The main advantages of this system is low cost fabrications of a microchannels, high compatibility with the biological materials, and the property of self-triggered flow due to the capillary force that occurs in the paper [10]. Passive microfluidic systems are govern by the capillary
force as well. In order to control fluid flow capillary force is utilized [11].
Flow in the digital microfluidics base on the electrolyte- electrodes interactions and generally is generated by the help of the external voltage. When a voltage is applied to electrodes, an electric field is generated between those electrodes. This field effects the surface properties of the material and results transfer of the desired material from one electrode surface to the other electrode surface. Therefore, it can be said as advantage that, there is no external pump to drive fluid flow in the device. In these kind of systems, instead of using a channel like microdevice, open structures are used to transport liquids. In addition, these type of microfluidic devices require only a few microliter drop of the reagents which reduce reaction time. These systems are also known as EWOD (electrowetting on dielectric). Shen et.al. [12] have shown a EWOD-based immunoassay. In this method, by manipulating the magnetic beads, modification of bead with the antibody was done. In this functionalization process of beads, washing protocols were done in one chip by transferring the droplet of the magnets from one reservoir to the other. Hence, all the steps in the process were accomplished in a single chip without any cross-contamination of the reagents.
In continuous microfluidics, basically fluids in the channel are moved using an external source like pressure pump and syringe pump. These systems are usually used for the chemical reactions. Because of the continuous property of the flow in the channel, these systems suffer from ineffective fluid manipulation. In droplet based microfluidics, compare to continuous microfluidics, liquid flow in the channel is in segmented form. Droplet based microfluidic systems are the systems where the liquids are encapsulated by droplets and are carried by liquid which is immiscible to droplet content. In addition, droplet based systems provides a reliable control to manipulate reagents in the channel. Chemical reactions in droplets are more rapid in comparison to in continuous microfluidic device. Furthermore, droplet based systems provide less contamination of the reagents in the channel due to the presence of droplet membrane [13].
2.3.1
Droplet Based Microfluidics
Droplet based microfluidic systems are evolved with the concept of the segmented flow in the microchannel. Because of the high surface to volume ratio, mixing is more effective in the segmented flow. However, segmented flow was not efficient enough to mix two different reagents and in the segmented flow; the channel walls were contaminated where the reaction took place. Therefore, a need to droplet based microfluidics has shown up. As the droplet based microfluidics developed, new applications to manipulate droplet flow were developed. In this section, all principles that are used in droplet based system are explained.
2.3.1.1 Droplet Generation
The basic principles of the droplet based microfluidics rely on the generation of the droplet in the channel. To form droplets in the channel, few parameters are needed to be considered such as viscosity of the fluids, channel dimensions, flow rates of the fluids, channel geometry and immiscibility of the liquids. Researchers have developed various droplet formation techniques. In this part, only four of them will be discussed.
Droplet formation in the T-junction geometry occurs basically by interfering of two immiscible liquids at the T-junction. From the dispersed phase of the channel fluid flows to the main channel. Within the pressure gradient and shear forces in the channel, dispersed phase elongate through the main channel. Then, with the shear forces, dispersed phase thinned gradually and breaks into droplets. The size, shape, velocity of the droplet depends on the flow rates viscosity of fluids and the channel dimensions [14, 15].
In flow focusing geometry, droplets are formed by forcing both dispersed and continuous phase through the narrow channel. In the narrow channel, continuous phase starts to squeeze the dispersed phase. At some point, dispersed phase breaks into droplets. The size of the droplet can be altered by changing the flow rate of the continuous phase [16, 17].
DEP-driven droplet formation is basically a method that pulls the droplet from the reservoir by polarizing the fluid with a non-uniform electric field. Forces that cause to move the droplet depend on the interfacial tension of droplet with the surface, surrounding medium and body force of the liquid [18, 19, 20]. Similar approach to DEP-driven droplet formation, in EWOD-driven droplet formation, droplets occur when an electric field is changed that is applied to microelectrodes in the channel. By changing the electric field, the contact angle of the droplet on the electrode changes. Hence, droplet can be formed and removed from its reservoir [21, 22, 23].
2.3.1.2 Droplet Fission
Droplet fission which is also known as droplet splitting can be classified into two methods. One of them is a passive splitting. In this method, there is no external power to split droplets. Fission of droplets can be done by altering the shear forces in the channel, changing the flow rates, and changing the resistance in the channel. Generally T-shape channel is used which is also called bifurcation junction. At this junction, because of the equal flow rate at both side of the junction, droplets stretched and break up into two equal size automatically [24, 25, 26]. In active methods, splitting can be applied with many other external sources. Thermally induced splitting is one of the active splitting method. In this method, by applying the higher temperature, the viscosity of the liquid is decreased. So that, an interfacial tension of the liquid decreases. Hence, some part of the liquid separates from the main droplet and moves to higher temperature field [27].
2.3.1.3 Droplet Fusion
Droplet fusion is a method which is also known as droplet merging. In this method, two individual droplets are generated in the channel. Then these two droplets are brought together. In the passive fusion, one droplet is located in one part of the channel and by altering the flow rate in the channel, the other
droplet is brought into contact with the steady one [28]. In addition, instead of altering the flow rate, merging can be applied by changing the surface property of specific part of the channel. For example, Wilhelm et.al. [29] have showed a selectively hydrophilic channel where droplets were merged. In one of the active fusion method, merging simply is executed by applying a voltage to the droplet with the electrodes by using same principle to form droplets in EWOD-driven droplet formation [30].
2.3.1.4 Droplet Sorting
Sorting of the droplets provides a way to separate specific droplets from the other droplet population. Various approaches have been proposed. One of them is sorting by looking size of the droplets. Tan et.al. [24] designed a channel that small droplets are transferred by continuous phase to the side channel whereas, larger droplets tended to flow to the main channel because of the higher velocity flow rate on the larger droplet. Applying an electric field is also provides to sort droplet into branching channels [31]. Ahn et.al. [32] have developed a DEP-based sorting device, where an electrodes is located under the channel. By applying an electric field to these electrodes, droplets are moved to the desired branch channel.
2.3.1.5 Mixing within Microfluidic Device
Mixing of reagents in microfluidic devices is more effective than mixing in con-ventional methods in terms of few advantages. One of them is the requirement of the less reagents due the small scale of the microchannels. In addition small dimension also provides a better mixing because of the high surface volume ratio. In macro scale, mixing generally achieved with a turbulent flow. However, in the micro scale, as mention in section (2.1.3.2), turbulent flow cannot be achieved in small Re number. In order to avoid this limitation, mixing in microchannel can be executed by taking advantage of channel design, especially in passive mixing. The passive mixing does not require any external energy source. Passive
micromixers generally rely on the diffusion length and the contact surface area. Passive micromixers can be classified into few different methods. T-Y shape micromixers based on the diffusion of two liquid in coflow at the downstream of the channel. Kamholz.et.al. [39] have developed a method that splits and recombine the fluids in the channel in order to mix them. By using 3D structure in the channel, two different fluids are sorted so that the surface area of the liquids increased. When the liquids combine with each other, due to the increased surface area liquids get mixed better and mixing time decreases. By generating a whirl flow or recirculation in the channel can also cause a mixing. In order to generate such flow profile, Bhagat et.al. [40] have designed a channel that has a postures in cubic and rectangular inside.
In active mixing, applying an external source is needed such as magnet, volt-age, temperature, or ultrasounds. Deshmukh et.al. [33] have developed a method to generate segmented flow in the channel by altering the pressure in the chan-nel. Using T-junction geometry, two different liquids were flown into channel, by driving and stopping the flow with the altered pressure, two liquids aligned sequentially and mixed [33, 34]. The other active mixing method is generating a magneto-hydrodynamic disturbance in the channel. To do that, electrodes that are deposited in the side walls of the channel generate an electric field. By cou-pling this electric field with a magnetic field, deformation in the fluid stream is occurred, so that liquids get mixed [35, 36, 37]. As another example to active mixing, Krishnaa et.al. [38] have designed a channel which traps the air bubble inside. This bubble acted as a mixer when a sound wave was applied. Hence, when two fluid in coflow met the air bubble trapped region of the channel, liquids mixed in the channel.
In droplet based mixing, the mechanism is based on the turns and bends of the liquids that are encapsulated in droplet. When a droplet flows through the serpentine channel, body and the edges of the droplet contact with the channel at different angle [41]. For example, a trailing edge of the droplet exposes to larger arc whereas the receding edge of the droplet makes contact at small angle. So that, smaller circulation of liquids in droplet happen at receding edge compare
to trailing edge. In addition, turning in the serpentine channel causes the liq-uids become upside down and reoriented in droplet. So that, an extra stirring is generated. Since the droplets are isolated from the carrier in the microchannel, different types of mixing reactions can be run in a single channel. In the aggluti-nation reaction, which is the main focus in this study, large numbers of reactions are need to be performed based on the type of the blood and antibody that is used. Therefore, droplet based microfluidics was the most applicable approach due to ability to generate parallel reactions in channel.
2.3.1.6 Biological Applications of Droplet-Based Microfluidics
Droplet based microfluidics have been used for the biological applications such as cell growth, single cell detection, separation and counting, and drug discovery as explained in below.
With the development of the protein analysis using MALDI (matrix assisted laser desorption/ionization) in droplet based microfluidics [42], protein based drugs started to be investigated by researchers. In order to characterize pro-tein drugs, generally crystallization of the propro-tein is done. During crystallization process, various chemical experiments are needed to be run at the same time. Due to the ability of droplet based microfluidics to run different types of exper-iments in parallel, protein crystallization can be applied easily. Lau et.al. [43] have developed a device that crystallize glucose isomerase, ferritin and thaumatin .
In order to achieve cell growth in the microchannel, the environment condi-tions such as oxygen, carbon dioxide concentration, the medium to feed the cells, temperature and humidity of the chamber that cells requires are needed to be provided. Hung et.al. [44] have shown a microfluidic design that has high aspect ratio to provide stable microenvironment for mammalian cell growth. This high aspect ratio in channel dimension provides a better gas diffusion. In addition, due to high surface area/volume ratio, microchannel became more prone to lose less volume of liquid which is important to avoid cell suffering from lack of medium.
Separation of the desired cell from its population has been developed using various methods. One of the separation device was designed using an optical method by Joensson et.al. [45]. This device is used for the enzyme amplification to observe abundance of the biomarkers to specific cells. Cells were labelled with fluorogenic substrate and also with a biomarker. Based on the fluorescence intensity that reaches the detector, cells were sorted.
2.4
Detection Methods for Microfluidic System
Several methods have been developed for the detection of the bioanalytical and biochemical reactions. In this chapter, two main detection methods are explained: optical detection method and electrochemical-electronic detection method.
2.4.1
Optical Detection
Optical detection methods are generally based on the detection of absorbed UV (Ultra Violet), fluorescence and luminescence. To detect such quantities, many filters, lenses, light sources are required. In addition in microscale, these required components may be needed to be miniaturized. In order to avoid these obstacles, optoelectronic devices were used such as light-emitting diodes (LED), laser diodes, and complementary metal oxide semiconductors (CMOS). As an example for laser based detection, Xu et.al. [46] have developed a compact disc microfluidics device to analyse alcohol level in blood. In this system, a calorimetric assay of alcohol was used. A laser was exposed to the detection chamber; by looking change in the optical path length of the laser due to the change in the colour of the blood, detection was done.
Fluorescence detection can be used for any kind of reaction that is available to be labelled with desired material with a fluorogenic substrate in microchannel [46, 47]. Dittrich et.al. [48] have demonstrated a method that analysed a phenotype of the gene. They designed a flow focusing device to generate droplets. Every single
droplet that included enzyme-amino acid, fluorogenic material, and RNA’s mixed with the random gene library. As a result of mixing chromophore was formed and based on the intensity of the fluorescence that chromophore phenotype analysis of the gene was accomplished.
2.4.2
Electrochemical and Electronic Detection
Electrochemcial reactions can be classified in three main group: amperometry, impedimetry and potentiometry. Basic principle of the potentiometry for the measurement of the biological quantities is measuring the cell potential difference by applying zero current. In the amperometic measurement method, generally two different electrodes were used. A voltage difference is applied between these electrodes. Measurement is done by looking the current change due to the re-duction and oxidation reactions on the surface of the electrodes. Similar to am-perometric detection method, two different electrodes are used in impedimetric detection method as well. By applying an AC electric field to the electrodes, an impedance analyser measures the changes in the impedance of the solution. In electronic based systems, generally FET (Field Effect Transistor) is used. Work-ing principle of these devices is sensWork-ing the change in the ion concentration of the material that is to be tested [49, 50, 51, 52]. In addition, there are electronic based other methods which is developed using custom-electronic devices. For example, Elbuken et al.[53] have developed a capacitive sensor that measures the capacitive change in the solution that flows in the microchannel. Using this ap-proach, Isgor et al.[54] have developed a droplet content detection method to sense ethanol concentration in droplet capacitively. In this project, the basic approach was to detect the agglutination reaction in droplets impedimetrically. Theory of the impedimetric measurement is explained in section (2.2.2.1). A variety of the biological and biochemical reactions have been developed using impedimetric de-tection methods. Especially, single cell impedimetric analysis has been developed for many years [55, 56, 57, 58]. In this kind of analysis, underlying parameters such as electrical conductivity of the medium and the cell, dielectric character of the cells are needed to be understood very well. Jang et.al. [59] have developed
a method that trapped a HeLa cell in the detection region and the measured the impedance of a single HeLA Cell using Precision Impedance Analyzer. By changing the applied frequency and the voltage, impedance response of the cell was observed. Besides analysing the electrical characteristic of a single cell, by using this impedimetric approach, cells can be differentiated from its population and can be counted. Gou et.al. [60] have developed a device that measured the resistance and capacitance of the cells under flow. They were able differentiate apoptotic and necrotic SMMC-7721 cells by measuring the impedance of the cells. Moreover, Holmes et. al.[61] have shown a detection method that is able to sepa-rate cells in the whole blood. In this method two parallel electrodes were excited with an AC signal. One pair was for the detection and the other pair was used as reference. As the cells pass through the detection region, impedance change was measured by subtracting the signals that electrodes measured. As a result of this measurement, lymphocytes, monocytes, and granulacytes were differenti-ated. In comparison to these methods, an impedimetric detection system which measure the electrical properties of cells inside the droplets. In the one of the scope of this study, it is aimed to model the agglutination reaction in a droplet using an electrical circuit approach. In the literature, an equivalent circuit model was developed for a single cell in a microchannel [62, 63, 64, 65]. Holmes et.al. [63] have developed a circuit model for the leukocytes. Using this model they fit the simulation results with the experimental data. Even though the simulation data were fit with the experimental results, the components of the circuit model was not explained. In further development of this model was done by Kemna et.al. [66] which is explained a single cell modelling inside the droplet. Although, the construction of the model was done properly, in order to indicate the exact values of the components a simulation was not executed. In comparison to these methods, a model with an approximated number of the components in the circuit was developed in this study as explained in detail in chapter 5.
2.5
Agglutination Reaction Mechanism and
De-tection Methods
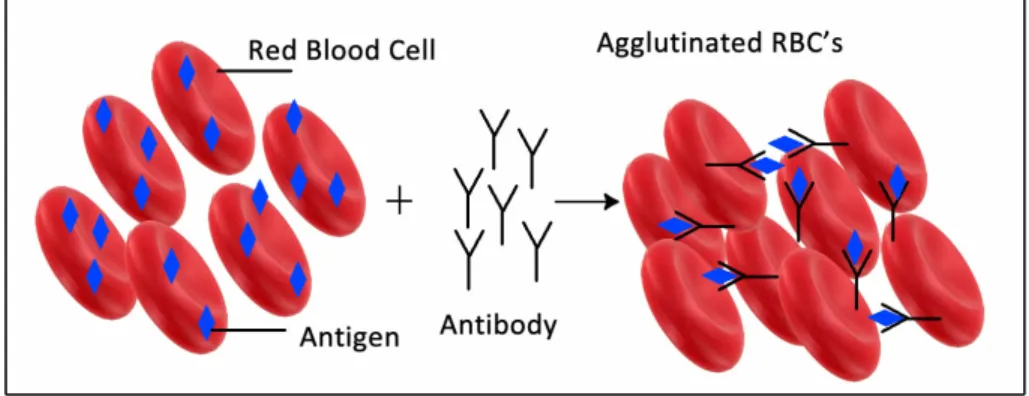
Agglutination comes from Latin aglutinare which means coming particle together and stick to each other. Agglutination is a serological reaction. Serology is the branch of the immunology which is related with the diseases that caused by the infection of viruses and bacteria. In some diseases these bacteria and virus can cause an agglutination of body fluids. In agglutination reaction, the basic mechanism composes binding of a specific antibody to specific antigen of the cell and clumping of cells together. Binding antigen to antibody resembles a key-lock interaction as shown in Figure 2.2. After the key-lock shape is formed, by binding of antibody to the free sites of the antigen, lattice of the cells is formed which is also called as clumps of the cells.
Figure 2.1: Illustration of agglutination reaction of RBC’s
Agglutination testing helps you to find antigens or antibodies in a sample. The sample can be any body fluids such as urine, blood, saliva, and cerebrospinal fluid (CSF). Therefore, agglutination reaction is important in the diagnostic laboratory to identify the cause of the diseases such salmonella, brucellosis, protozoa or parasites. Agglutination reaction can be classified into three main groups based on the reaction mechanisms. Direct agglutination occurs when a particle has a self-antigen naturally. However, in the passive agglutination reaction, artificial particles are used which are coated with an antigen. Hemagglutination involves the agglutination of the red blood cells (RBC’s).
In the immunology laboratories, the agglutination test is performed using two simple different techniques. These techniques are grouped as rapid agglutination tests and slow agglutination tests in tubes. In the rapid agglutination test, mix-ture of undiluted patient serum and the specific antigen in plate and this mixmix-ture is done by rotating the plate. In comparison to rapid agglutination test, the patient serum is diluted and mixed in tube in the slow agglutination tube test. Blood typing is one of the hemagglutination reaction. A-B-O blood groups are classified as A, B, AB, O and Rh depending on the presence or absence of the A or B, Rh antigens on the red blood cells. For example, a blood type which has A-type antigen on RBC’s, the agglutination only occurs if the anti-A type antibody is mixed with the blood sample.
The aim of the study was to detect any kind of agglutination reaction in droplets. In order to realize the reaction inside the droplet, blood typing method is used due to the simplicity to run in a microchannel. In the literature there are several techniques were developed to determine the type of the blood [67, 68, 69, 70, 71, 72, 73]. Kline et.al. [72] have developed a droplet based microfluidics to determine the type of the blood and the type of the bacteria optically. Using a serpentine channel shape, mixing of blood sample with the specific antibody was done. However, in this method a tedious silanizaton method was used to prevent cell stiction to the channel walls. In this study, compare to silanization process, simple modification method was developed. In addition, in the silanized channel, each antibody serum droplet were separated with trapped air. However, trapped air could not prevent the cross contamination of the serums in droplets. In this project it is prevented by separating the reagents with the silicone oil segments in PTFE tubing as explained in section 4.2.
In another approach, Al et.al. [67] have developed a paper based microfluidics to validate blood typing. A paper was introduced with a few microlitre of an-tibody serum . Then blood sample were spotted on this paper. After reaction occurred, agglutinated RBC’s were fixed on the paper and could not be washed away which provides determination of blood type. However, since the reaction depended on the capillary force which provided to wick the blood sample through
the antibody serum spot, efficacy of the reaction is limited. Since mixing in ser-pentine channel also depends on the flow rate of the droplet, by adjusting the flow rate mixing efficacy is more controllable. Therefore, droplet based microdevice is determined to use.
Chapter 3
Fabrication, Design and
Characterization of Microfluidic
Device
In order to measure electrical properties of biological samples in suspension, no-tably particles and cells, several techniques have been developed over the last century. More recently, screening the properties of single cell in suspension be-comes possible to investigate using lab on a chip systems. These systems require microfabrication techniques to fabricate microfluidic systems.
This chapter outlines fabrication procedure of PDMS microfluidic device and microelectrodes using photolihtography and PDMS molding methods which are one of the fundamentals of the microfabrication techniques. In addition, de-sign parameters and the characterization techniques of the microchannels are explained. Problems that were encountered during designing and fabricating the channels are presented as guidance to future researchers as well.
3.1
Fabrication of Microfluidic Device
3.1.1
Fabrication process of Microchannel
Most of the microfabrication processes for microfluidic device include two im-portant procedures. First one is photolithography and the second one is PDMS molding by using softlithography.
3.1.1.1 Photolithography
In photolithography process, photoresist is patterned on master with the UV-light transfer from a photomask. Depending on the design of the photomask, UV-light can be blocked in some parts of the mask or can pass through the mask. Exposure dose of the UV-light can be altered using Mask Aligner. Photoresist solubility can be changed by altering exposure dose of UV-light. There are two major type photoresist in terms of solubility response to the light. For the positive photoresist, the parts that expose to light become soluble and are removed during etching process. On the other hand, for the negative photoresist, parts that are exposed to the light remain on master while other parts are etched away. In addition, depending on the type, photoresist may has various viscosities. In general, more viscous photoresists are used to achieve thicker layer on the master. Therefore, the higher dose of UV-light should be applied.
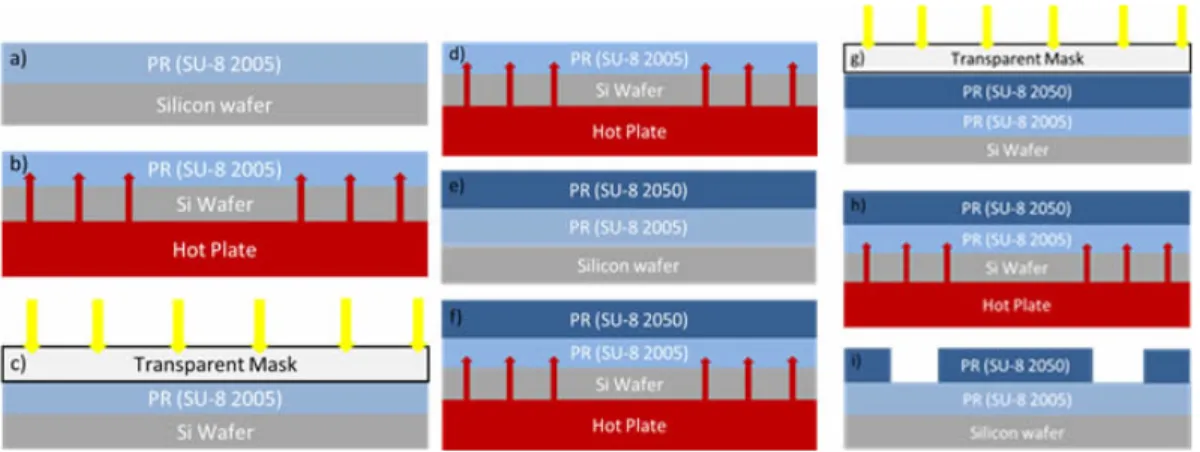
In this project for the photolithography process, silicon wafer was used as a master and as a photoresist SU-8 (Micro-Chem 2050-2005) was used. Process steps are shown in Figure 3.1. On silicon wafer, first SU-8 2005 was spinned at first 500 rpm for 25 s (Figure 3.1.a). Right after, the photoresist was spinned at 2500 rpm for 40 s. The reason for using SU-8 2005 in advance was to prevent adhesion of cured PDMS on wafer. Final thickness of this photoresist was 2 µm. In order to cross-link the photoresist, a ramped heating process was applied (Figure 3.1.b). Then silicon wafer was put on hot plate at 65◦C for 2 min, then 95◦ for 4 min and finally 65◦ for 1 min. In final cooling step was done to prevent
stress of photoresist surface because of the temperature difference between hot plate and room temperature. During this heating process, it is important not to use convention ovens because of incomplete drying of photoresist issue. After the photoresist dried, wafer was exposed to the UV-Light at 120 mJ with blind exposure mode (Figure 3.1.c). Afterwards, wafer was put on hot plate for further cross-linking of photoresist at 65◦ for 1 min, 95◦ for 3 min, 65◦for 1 min in order. (Figure 3.2.d) Then, SU-8 2050 was applied with a designated speed to achieve desired thickness of the microchannel Figure 3.2.e. Because of the high viscosity of the SU-8 2050, first the photoresist was directly poured at the center of the wafer from its bottle. Then, spinned the sample at 500 rpm for 45 s, then 2000 rpm for 35 s (Figure 3.1.e). During this process, build-up of the SU-8 2050 photoresist occurred at the edge of the wafer. By using a glass slide these residues were trimmed away from the edges. So that, a better contact with photomask was provided. This step is important to achieve better resolution in side walls of the feature. After that, the photoresist was baked at 65◦ for 4 min, 95◦ for 8 min, and 65◦ for 2 min to evaporate the solvent (Figure 3.1.f). Then, photoresist was exposed to UV-light at 230 mJ using transparent mask which had the desire channel design (Figure 3.1.g). After exposure step, wafer was put on hot plate to evaporate solvent of photoresist effectively. During this process, visible latent image of the design of the channel should be observed on the wafer. If this latent is not observed, it means that, heating and cooling are done insufficiently. In order to reveal final structure, SU-8 must be etched in a MicroChems SU-8 developer for 7 min (Figure 3.1.i) Duration of etching depends on the freshness of the developer. Finally, the wafer was taken out from developer and was dried with nitrogen. Due to the spinner parameters determines the height of the channel, after this process with a given spinning parameters above, the height of the channel was 80 µm.
Figure 3.1: Schematic of photolithography process for SU-8 2050.
3.1.1.2 Softlithography-PDMS Molding
Softlithography is a process for replicating structures using elastomeric materi-als, most notably PDMS. This method is originally developed by Whitesides’s group [74, 75]. The detailed steps of softlithography process are schematically represented in Figure 3.2.
In this project, PDMS microfluidics device was fabricated using this method. In order to create PDMS replica, first, an epoxy was needed to apply to the edges of the wafer to avoid delamination of SU-8 layers during peeling off cured PDMS on master. After applying epoxy, the wafer was placed on hot plate at 100◦for overnight. On dried epoxy, powder was applied to prevent stiction of PDMS. Afterwards, PDMS prepolymer was prepared in a mixture of 10:1 (base polymer: curing agent- w/w) by using a mass balance. Based on the curing agent ratio in the mixture, the stiffness of the PDMS prepolymers can change. Bubbles that occurred during mixing were degassed by putting the mixture in vacuum chamber applying for 80 kPa 30 min. After that, the mixture was poured over the master that was placed in aluminium dish and was baked at 100◦ for 4 h. At the end of the baking process, PDMS mixture was solidified on master and was peeled off from the master. After peeling off PDMS replica, in order to prevent contamination of channels, the cured PDMS was covered from both side. Then cured PDMS were cut using scalpel depending on the design on master. Then,
using biopsy punch inlets and outlet of the microchannel were punched. Finally, PDMS microchannel was bonded on a desired substrate in order to enclose the microchannel. To sealing the channel, most notably oxygen plasma treatment is used. By the help of oxygen plasma treatment, silanol groups on the PDMS surface generated oxidations of methyl groups. These groups tend to bond to similar surfaces such glass, silicon dioxide and silicon nitride covalently. The optimized procedure to bond PDMS channel on glass surface was achieved by applying 50 W RF power in vacuum chamber during 30 s either surfaces of PDMS and glass.
Figure 3.2: Schematic of softlithography process for PDMS microchannel. [76]
3.1.2
Fabrication Process of Microelectrodes
Electrodes were patterned on a glass slide (25 mm x 75 mm) using photolithogra-phy as explained in section 3.1.1.1. Firstly, in order to prevent organic contami-nation on glass slide, glasses were rinsed with acetone, then glasses were dipped in IPA (isopropyl alcohol) and finally, were rinsed with DI-water. After that, glass slide were dried with nitrogen and were put on hot plate at 120◦ to evaporate the residuals of solvents on the glass surface. In order to increase the adhesion of second photoresist layer, Hexamethyldisiloxane (HMDS) was spinned on the glass first at 5000 rpm for 40 s. Then, AZ5214E positive photoresist was coated
on glass slide at 4000 rpm for 40 s. A commercial transparency mask that was designed using AutoCAD was used to transfer the desired geometry to the glass slide. At 40 mJ dose UV-light (365nm-EVG620) was adjusted to expose photore-sist on glass slide and the photorephotore-sist was patterned with the final developing step in AZ400K: DI-water (1:4 v/v) solution.
3.1.2.1 Deposition of Metal Layer
In order to achieve metal contacts on the glass slides, two different metal depo-sition techniques were used: Sputtering and Thermal Evaporating techniques.
• Sputtering: In sputtering method, highly ionized argon or nitrogen gases bombard the target of the desired material to be deposited on the substrate as shown in Figure 3.3. This bombardment generates an atomic flux of target material in the reaction chamber and atom of the target material eject from the surface. The ejection occurs when bombarded ion energy is higher than the binding energy of the target atom on the material surface. The flux can be altered by changing the power of DC source which ionized the inert gases. Thickness of the deposited material can be adjusted by changing the amount of the gases in the chamber that involve in the reaction. Based on this parameters, glass slide that AZ5214E photoresist was spinned on top, was coated with 15 nm Cr (Chromium) and 35 nm (Copper) respectively by using magnetron sputtering (Vaksis, NanoD-4S) Performed recipes are given in Table 3.3.
Material DC Power Chamber Pressure Ar Flow Deposition duration Chronium (Cr) 150 W 8 mTorr 70 sccm 2 min
Copper (Cu) 150 W 20 mTorr 50 sccm 8 min Table 3.1: Recipe of metal layers for microelectrodes.
• Thermal Evaporating: In this technique, based on the joule heating, as high current is passed through the filament, filaments gets warmer. The target material which is evaporated placed on these filaments. As the fil-ament gets warmer, the material to be deposited is heated to the vapor pressure point. Under vacuum condition, the evaporated target material condenses on the substrate and forms a thin film as shown in Figure 3.4. Based on the current that is applied to the filaments and material density, thickness of the deposited film can be adjusted. Using this technique, 15 nm Cr (Chromium), 35 nm Au (Gold) were deposited on photoresist spinned glass slide respectively using thermal evaporator (Vaksis, PVD, Vapor 3S). Deposition parameters for Au, Cr metals are shown in the Table 3.2 below:
Figure 3.4: Schematic of deposition in thermal evaporator system. Metal Density Acoustic Impedance Tooling Factor
Gold 19.3 23.18 70
Chromium 7.15 28.95 60 Table 3.2: Recipe of metal layers for microelectrodes.
• Lift Off: After deposition of metal contacts, in order to achieve final pattern, the lift off process was done for both type of deposition techniques. During lift off process, acetone was used as etchant of photoresist. This etchant removed entire photoresist on the glass slide as shown in Figure 3.5
Figure 3.5: Schematic of lift off process.
3.1.2.2 Deposition of Passivation Layer
During experimental studies, pining of the solutions on bare coplanar electrodes is a familiar issue when the passivation layer was not used [77, 54]. In order to prevent cross contamination between microelectrodes and the material that is tested, a passivation layer of was deposited. To deposit the layer, optically transparent SiO2 was chosen as a passivation layer. Using PECVD deposition
technique, microelectrodes were coated with SiO2. In this technique, the chemical
reaction of the ionized target gases with the substrate was utilized. The capacitive coupling electrodes in the reaction chamber energized the target gases and create plasma. This plasma induces a chemical reaction with the heated substrate in the chamber. Then, energized gases turns from the gas phase to solid phase on the substrate as shown in Figure 3.6. In order to deposit SiO2, silane gas was
plasma power, chamber pressure and amount of the gas reactants in the chamber. By using this method, 220 nm SiO2 thickness was achieved for 30 min reaction
time.
Figure 3.6: Schematic of reaction mechanism in PECVD.
3.2
Surface Modification of Microfluidic Chip
Since this project based on generating the agglutination of red blood cells in droplet, surface property of the PDMS microchannel was significant parameter. Although, PDMS is a biocompatible material, modification of PDMS surfaces can be vital based on the application of the chip and the material is used. In this project, main parameter was generating a droplet and mixing whole blood droplet with the antibody serum to observe agglutination reaction. As explained in section 2.3.1.1, droplet formation based on several parameters such as surface tension and channel geometry. Since red blood cells have more tendency to adhere to the PDMS wall, surface tension becomes so dynamic that prevents droplet formation. In order to avoid adhesion of RBCs to surface the of the PDMS wall, several surface modifications were tried on PDMS surface which is applied to achieve super hydrophobic PDMS and glass surfaces. After modification was accomplished characterization and droplet formation was executed as explained in section 3.4.
• Modification A: Aytug et.al. [78] have explained that modification of both PDMS and glass surfaces using a mixture of 1H, 1H, 2H, 2H Perfluoro-1 Octanol (PFOTS) and n-hexadecane caused the facials to turn to super hydrophobic surfaces. Based on this method, PDMS channel was modified with a mixture of 1H, 1H, 2H, 2H Perfluoro-1 Octanol (PFOTS) and n-hexadecane. The mixture was flowed through the channel using a syringe pump and the channel was exposed to the flow for 10 min. After sample was loaded with the solution, PDMS channel was baked at 100◦for 1 h. Then, droplets were tried to be generated in FC-40 (Fluorinated oil-which is also flour based solution) as a carrier of droplets. However, droplets tended to stick to the walls as explained in section 3.4.1.
• Modification B: Instead of physical absorption of the mixture of 1H, 1H, 2H, 2H Perfluoro-1 Octanol (PFOTS) and n-hexadecane to the channel walls, PDMS channel was exposed to oxygen plasma before modification in order to achieve chemical absorption. After oxygen plasma treatment, oxygen molecules breaks to -OH bonds on the surface of the PDMS and open free sites for bonding of 1H, 1H, 2H, 2H Perfluoro-1 Octanol covalently. By loading channel with the mixture of 1H,1H,2H,2H Perfluoro-1 Octanol and n-hexadecane using syringe pump right after plasma treatment, cause to covalent bonding to be formed. However, similar adhesion profile was observed with the process in modification A.
• Modification C: In this modification process, contrary to loading the microchannel with the mixture, a piece of PDMS was tested by dropping a fluorinated mixture on top. PDMS sample was washed with Piranha solution for 30 min (Piranha is a mixture of sulfuric acid (H2SO4) and
hydrogen peroxide (H2O2) to clean organic residues on substrates [79]. Then
sample was rinsed with DI-water and dried with nitrogen. The sample was inserted into a solution which included %1 v/v PFOTS and toluene for 1 min. After that, sample was dried in an oven at 80◦ for 5 h. As a result of exposing PDMS to Piranha solution, the surface roughness of the PDMS increased. Therefore, this modification process was not preferred to be used for droplet generation.
• Modification D: As it is explained in the previous process, a piece of PDMS sample was prepared. First, sample was rinsed with sulphuric acid for 2 min and then rinsed with hydrofluoric acid (HF) for 10 min [80]. For the following, sample was baked at 80◦ overnight. In order to generate covalent bonding, sample first treated with oxygen plasma and right after plasma treatment, sample was immersed in the solution of 5 mL of ethanol containing 5 L PFOTS for 1 h. Then, sample was placed on hotplate at 80◦. On the contrary of the process in modification C, the sample surface was smooth. However, the adhesion of RBC’s to the walls of the channel was noticed.
• Modification E: Due to the failure of the modification process with PFOTS, silicone oil (Viscosity 100 mPa s, Ultrakim) was used to increase the hydrophobicity of the channel. Beginning of the process, glass slide was rinsed with acetone, IPA and DI-water in order. Then, glass slide was placed on hot plate for 2 h at 100◦, during this process glass slide was cov-ered to prevent contamination from environment. After heating, the glass slide and a PDMS microchannel was inserted in plasma asher to be ex-posed to oxygen plasma for 3 sec at 900 W. Then, the microchannel was bonded on glass slide. Throughout plasma treatment, the surface of the PDMS becomes hydrophilic, in order to increase the hydrophobicity of the surface, the microchip placed on hot plate for 2 h at 100◦. After two hours, the channel was loaded manually with silicone oil (Viscosity 100 mPa s) using a standard 5 mL syringe and was baked at 100◦ overnight. Finally, droplet generation was tried and no adhesion issue was observed during an experiment as explained in section 3.4.1.
3.3
Characterization and Optimization of
Mi-crofluidic Chip
3.3.1
Ellipsometer
Ellipsometry can be used to measure the output polarization of light that is reflected or transmitted from the sample surface. Output polarization of light includes the information of the changed amplitude and phase.To collect data, ellipsometry setup includes the following: light source, polarisator, sample polar-ization analyser, and detector as shown in Figure 3.7.a. In order to get the desired information from the sample surface, model-based analysis should be done. As a result of this analysis, film thickness, refractive index, surface roughness, and uniformity of the material can be extracted. Generally, ellipsometry is used to measure the thickness of the films on sample. As shown in Figure 3.7.b, the light wave is reflected and absorbed from the surface of the sample. If the refractive index of the film, material of the sample and the model that is used to fit are known, thickness of the film can be calculated. Due to the non-destructive mea-surement method of ellipsometer, it is preferred to measure the thickness of the SiO2that is deposited with PECVD on our coplanar electrodes as a passivation
layer. Variable Angle Spectroscopic Ellipsometer (J.A. Woollam, V-VASE, UK) were used for thickness measurements at an incidence angle of 65 degree from 400 nm to 2058 nm. Cauchy dispersion function was used in order to determine passivation layer thickness. In order to fit experimental data, refractive index of PDMS and SiO2 were taken as 1.42 and 1.55, respectively and the thickness of
Figure 3.7: Schematic of ellipsometer measurement setup (a) and measurement method (b).
3.3.2
Profilometer
A profilometer is basically contact measurement method of sample which is also known as Stylus profilometer. It is used to measure the variations on the sample surface. Stylus profilometer has the following components: Scan head, electronics, and PC interface as shown in Figure 3.8. As the scan head is moved across the sample surface, vertical displacement of the scan head generates an analog signal. Then this signal is converted into digital signal that includes the information a height value of the sample studied. We measured the width and height of the channel that is patterned on silicon wafer using stylus profilometer as 80 m for the recipe which is given in section 3.1.1.1. (KLA Tencor, P6 Surface Profiler, and USA).
Figure 3.8: Schematic of a profilometer and measurement method. [81]