Levels of Fat-Soluble Vitamins in Some Foods
HARUN CIFTCI*, AHMET OZKAYA†, B. SITKI CEVRIMLI‡ and ADIL BAKOGLU§ Department of Chemistry, Faculty of Science and Art, University of Ahi Evran, Kirsehir, TurkeyFax: (90)(386)2114514; Tel: (90)(386)2114552 E-mail: [email protected]
The levels of vitamins in nine food of winter season which are grown in Turkey were determined. High performance liquid chromatography (HPLC) was used in this work. Eight vitamins were detected in the foods. The contents of vitamins were determined as β-carotene, 38.4-144.5; δ-tocopherol, 0.63-6.15; γ-tocopherol, 0.7-936.2; α-tocopherol, 0.7-72.8; α-tocopherol acetate, 3.7-113.1; vitamin D2, 5.2-47.8; vitamin
D3, 36.4-642.2 and vitamin K1, 12.6-67.4 µg g-1. For the simultaneous
determination of all the vitamins, the mixture of acetonitrile/methanol (3/1, v/v) was used as the mobile phase. Detection was performed at 202 nm for vitamins. The results showed that vitamin D3 level is high
for corn and γ-tocopherol is rich in bulgur. Key Words: HPLC, Vitamin, Food, Cereals.
INTRODUCTION
Vitamins are biologically active controlling agents for an organism's health and growth. These agents are often accompanied by an excess of compounds with similar chemical properties. Human diet should contain appropriate amount of vitamin for its essential functions. Systematic absence of vitamins in human diet can results
in deficient growing and development1,2. Vitamins generally are chemically unstable,
especially in high temperature, light or oxygen. Thus not only quantification but also instantaneous identification is mandatory for the detection of vitamins in food. For separation and detection, different HPLC methods are used at room conditions in order to compensate the effect of such parameters on stability of molecules under
investigation3.
Vitamins, studied in this work, are critical components of many antioxidant processes. Any deficiency in the level of these vitamins in living organism may impair the function of overall oxidant system because these compounds (i.e. vitamins)
are essential in living systems4.
†Department of Chemistry, Faculty of Science and Art, University of Adiyaman, Adiyaman, Turkey. ‡Department of Chemistry, Faculty of Science-Art, University of Gazi, Ankara, Turkey.
The correlation between diet and health has led the consumers to ingest foods containing vitamins, included the fortifier ones and more recently, the pharmaceutical supplements. But the addition of these nutrients to industrial products can be utilized as only marketing strategy and several times, the commercial advantage has priority
in damage of individual real necessity5.
There are a lot of analytical procedures including spectrophotometry6,
spectro-photoflurorimetry7, voltammetry and chromatography8,9 to carry out the assay of
vitamins in food.
In this study, eight fat soluble vitamins (β-carotene, vitamin D2, vitamin D3,
γ-tocopherol, δ-tocopherol, α-tocopherol, α-tocopherol acetate, vitamin K1) in nine
winter season foods of Turkish origin were determined, using HPLC.
EXPERIMENTAL
The vitamins standard stock solution, 100.0 mg L-1, were prepared by dissolving
10 mg of each reactive obtained from Sigma-Aldrich (St. Louis, USA) in 100 mL of methanol using dark brown volumetric flasks. These solutions were stable for at least 1 month when stored in the dark at 4 °C. Working solutions were prepared from the stock solutions by appropriate dilution with ethanol and shielded from light.
The chromatographic system was equipped with a Shimadzu LC-9A pump, SPD-M10AVP photodiode array detector. Supelcosil LC 18 DB column (250 mm × 4.6 mm, 5 µm; Sigma, USA) for separation of vitamins.
Corn, pepper, sweet basil, bean, aubergine examples used in study were gathered from vegetable market in August 2007 taking into consideration to be grown in Elazig (Turkey). Each of these three numbers corn, pepper, aubergine and a hundred each gram packed green bean and sweet basil examples were obtained from various sales. After collection, the samples were washed and then dried under the sun for 20 days. Tarhana, Bulgur, Red lentil and chickpea were bought from cereal market in Elazig. Tarhana, a traditional fermented food made from a mixture of white
wheat flour and yoghurt, is widely consumed in Turkey10.
Determination of fat soluble vitamins in foods: Dried vegetables (1 g) were
homogenized in 6 mL acetonitrile/methanol/isopropanol (2/1/1, v/v/v)-containing tubes and the samples were vortexed for 30 s and centrifuged at 6000×g for 10 min at 4 °C. Supernatant was dried under nitrogen in the 37 °C, it was redissolved in 1 mL mobile phase. Samples were transferred to auto sampler vials of the HPLC instrument. For vitamins, the mixture of acetonitrile/methanol (3/1, v/v) was used as the mobile phase and the elution was performed at a flow-rate of 1 mL/min. The temperature of column was kept at 40 ºC. Detection was performed at 202 nm for vitamins. Identification of the individual vitamins was performed by frequent compar-ison with authentic external Standard mixtures analyzed under the same conditions.
RESULTS AND DISCUSSION
Some of the vitamins such as A, E, D3 and K1 are high hydrophobic whereas
some are hydrophilic. Studies on hydrophobic vitamins are based on present high
affinity of the selected C18 group stationary phase, but in studies about other group
there are difficulties thus, to promote the elution of fat-soluble vitamins from the column, even in conventional methods exploiting reversed phase chromatography,
it is necessary the usage of high concentrations of methanol and acetonitrile12 to
increase the affinity of the vitamins by the mobile phase, becoming possible to elute them from the column. The levels of vitamin in some foods were shown in Table-1.
TABLE-1
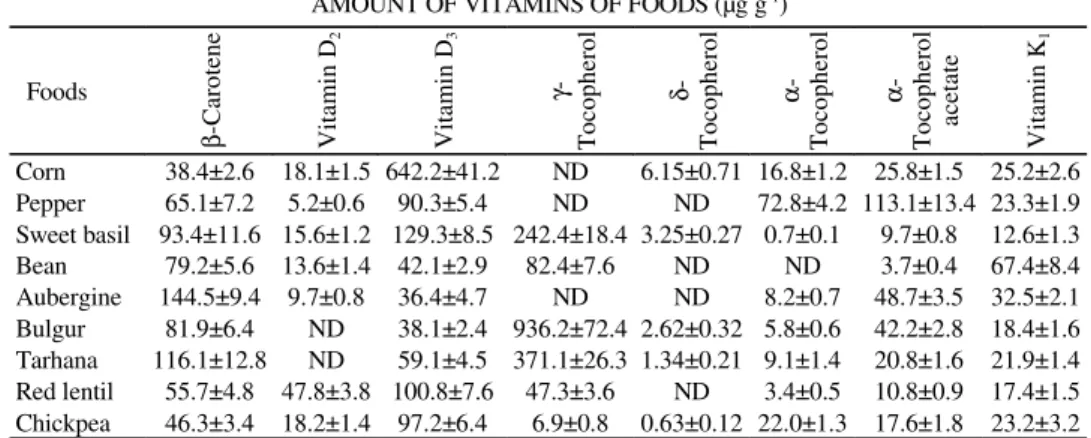
AMOUNT OF VITAMINS OF FOODS (µg g-1)
Foods β -C ar o te n e V it am in D 2 V it am in D 3 γ-T o co p h er o l δ - T o co p h er o l α -T o co p h er o l α -T o co p h er o l ac et at e V it am in K 1 Corn 38.4±2.6 18.1±1.5 642.2±41.2 ND 6.15±0.71 16.8±1.2 25.8±1.5 25.2±2.6 Pepper 65.1±7.2 5.2±0.6 90.3±5.4 ND ND 72.8±4.2 113.1±13.4 23.3±1.9 Sweet basil 93.4±11.6 15.6±1.2 129.3±8.5 242.4±18.4 3.25±0.27 0.7±0.1 9.7±0.8 12.6±1.3 Bean 79.2±5.6 13.6±1.4 42.1±2.9 82.4±7.6 ND ND 3.7±0.4 67.4±8.4 Aubergine 144.5±9.4 9.7±0.8 36.4±4.7 ND ND 8.2±0.7 48.7±3.5 32.5±2.1 Bulgur 81.9±6.4 ND 38.1±2.4 936.2±72.4 2.62±0.32 5.8±0.6 42.2±2.8 18.4±1.6 Tarhana 116.1±12.8 ND 59.1±4.5 371.1±26.3 1.34±0.21 9.1±1.4 20.8±1.6 21.9±1.4 Red lentil 55.7±4.8 47.8±3.8 100.8±7.6 47.3±3.6 ND 3.4±0.5 10.8±0.9 17.4±1.5 Chickpea 46.3±3.4 18.2±1.4 97.2±6.4 6.9±0.8 0.63±0.12 22.0±1.3 17.6±1.8 23.2±3.2
ND: Not detectable, Data presented are in means ± standard deviation (n = 3).
400 300 200 100 0 5 10 15 20 V o lt s Minutes -T o c o p h e ro l -L o c o p h e ro l V it a m in D 2 V it a m in D 3 -T o c o p h e ro l -T o c o p h e ro l a c e ta te V it a m in K 1
Fig. 1. Chromatography of standard vitamins
Vitamin A belongs to fat soluble group is nearly found in trace amount in nature, but its modified (i.e. a little structural change between) form, the substance β-carotene, is found naturally in plants extensively. If β-carotene is taken abundantly, necessity
of vitamin A has been meet, too. Vitamin A is stored mostly in liver in the animal
tissue13.
The mean β-carotene (vitamin A) content varied between 38.4 and 144.5 µg g-1
dry weight. The highest and lowest levels of β-carotene were found in aubergine, tarhana and sweet basil. It is found in the study done in literature that level of the
β-carotene in aubergine is 169 mg/100 g raw weights14.
All people need vitamin A to maintain strong bodies, mental sharpness, fight
off disease and bear healthy children15.
Liver development also needs vitamin A because of its ability to turn off a particular liver promoting gene. The high dietary intake of vitamin A reduces the risk
of some healty problems such as cancer, cardiovascular disease and other diseases16.
Vitamin A depletion is associated with low phosphoenolpyruvate carboxykinase
mRNA levels during late fetal development and at birth in mice17.
Vitamin E, is mainly stored in adipose tissue, the liver and muscle, belongs to a fat-soluble class present in all cellular membranes. Vitamin E is a essential anti-oxidant in the living organism and protects the organism from polyunsaturated fatty acids in cell membranes from peroxidation. In fact, singlet oxygen can damage DNA and be mutagenic. Vitamin A is a singlet oxygen quencher, neutralizing these highly reactive and unstable singlet oxygen molecules. This vitamin also protects the double bonds of β-carotene from oxidation and thus exhibits a sparing effect. Due to the ability of vitamin E to work at higher oxygen existence, free radicals are scavenged and tissue injury is minimized. Besides its anti-aging properties, vitamin E is known to afford protection against cancer, ischemia and reperfusion injury,
cataract, arthritis and certain neurological disorders18.
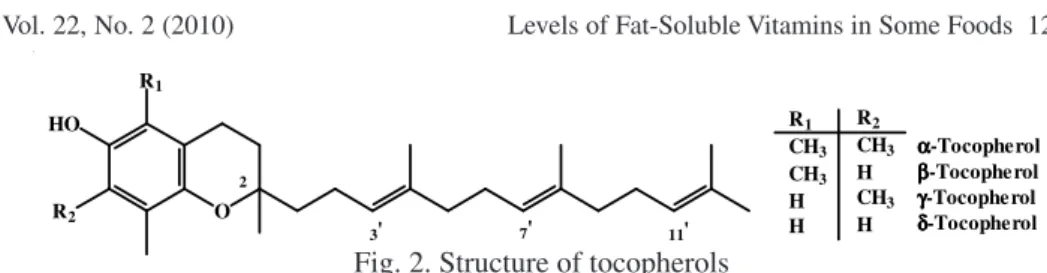
Vitamin E has eight different forms α, β, γ and δ-tocopherols (Fig. 2) and α, β, γ and δ tocotrienols with varying activity and mechanism profiles relevant to cancer
prevention19. The U.S. average daily intake of vitamin E is ca. 10 mg for men and 7 mg
for women of naturally occurring or all-rac-tocopherol levels that are substantially lower than the 15 mg recommended by the Institute of Medicine Food and Nutrition
Board for both men and women20. Although all forms of vitamin E are absorbed,
only certain stereoisomers of α-tocopherol are maintained in human plasma and tissues. Therefore, only α-tocopherol currently is considered to contribute to the recommended daily allowance for vitamin E.
The contents of tocopherols in food samples were found in the ranges,
3.4-78.8, 6.9-936.2, 0.63- 6.15 and 3.7-113 µg g-1 (dry matter) for α, γ, δ-tocopherols
and α-tocopherol acetate, respectively. γ-Tocopherols were found as 936.2 and 371.1
µg g-1 for Bulgur and Tarhana, respectively.
The highest content of δ-tocopherol was 6.15 µg g-1 in corn, whereas the lowest
δ-tocopherol was 0.63 µg g-1 in chickpea. The levels of δ-tocopherol were not
detec-table in pepper, bean and aubergine. α-Tocopherol levels were determined to be
72.8 µg g-1 in pepper and 0.7 µg g-1 in sweet basil. The higher α-tocopherol acetate
O R1 HO R2 2 3' 7' 11' R1 CH3 CH3 H H R2 CH3 H CH3 H α α α α-Tocopherol β β β β-Tocopherol γγγγ-Tocopherol δ δδ δ-Tocopherol
Fig. 2. Structure of tocopherols
Vitamin D belongs to a group of several related sterols, with the two most
important ones being D2 and D3. Vitamin D2 is derived from plants and can substitute
for D3 in the human body. Vitamin D3 is the natural form found in foods and made
by the skin when exposed to sunlight. A dietary source of vitamin D is thought to be required only in animals not exposed to sunlight. Metabolism of vitamin D in
ruminants has been reviewed21. The best known role of vitamin D is maintaining
Ca homeostasis by increasing intestinal Ca absorption and is regulating Ca meta-bolism in bone. However, this view to function of vitamin D should be expanded to include regulation of numerous Ca binding proteins and Ca function in many types
of living organisms and especially in much kind of cells22.
The mean vitamin D2 content varied between 5.2 and 47.8 µg g-1. The highest
and lowest levels of vitamin D2 were found in Red lentil and pepper. It is not detectable
in Bulgur and Tarhana. The contents of vitamin D3 in food samples were found in
the ranges 36.4-642.2 µg g-1. The higher vitamin D
3 content was found in corn.
Vitamin K is naturally occurring in all nine foods as naphthoquinone ring structure as menadione, but differ in the structure of the side chain at the position 3. They are traditionally classified into two groups according to whether they are synthesized by plants or bacteria. In plants the only major form of this vitamin is phylloquinone
(vitamin K1), which has the same phytyl side chain as chlorophyll. Bacteria, on the
other hand, synthesize a family of compounds called menaquinones (vitamin K2)
with side chains based on a number of repeating prenyl units23.
The application to foods of vitamin K1 is shown in the items of corn (25.2 µg g-1),
pepper (23.3 µg g-1), sweet basil (12.6 µg g-1), bean (67.4 µg g-1), aubergine (32.5 µg
g-1), bulgur (18.4 µg g-1), tarhana (21.9 µg g-1), red lentil (17.4 µg g-1) and chickpea
(23.2 µg g-1). Bean is rich in point of vitamin K
1. The reported vitamin K1 values in
the literature for plants were found 30, 20 and 190 µg g-1 (dry matter) for corn, red
pepper and bean, respectively23.
Conclusion
The results showed that used winter season foods are rich in vitamin D3,
α-tocopherol acetate and γ-α-tocopherol levels and include less level of vitamin D2 and
vitamin K1. Levels of fat soluble vitamins in sweet basil, tarhana and bulgur are
high.
ACKNOWLEDGEMENTS
REFERENCES
1. A. Lebiedzinska, M.L. Marszall, J. Kuta and P. Szefer, J. Chromatogr. A, 1173, 71 (2007). 2. W.H.J. Sebrel, R.S. Harris, The Vitamins: Chemistry, Physiology, Pathology, Methods,
Publish-ing Academic Press, edn. 2 (1971).
3. L.M. Nollet, Food Analysis by HPLC, New York (1992).
4. E. Lemberkovics, E. Czinner, K. Szentmihalyi, A. Balazs and E. Szoke, Food Chem., 78, 119 (2002).
5. A.J. Paixao, E. Tania and L.M. Stamford, Nova, 27, 96 (2004). 6. H. Abdollahi and L. Bagheri, Anal. Chim. Acta, 514, 211 (2004).
7. A. Alonso, M.J. Almendral, M.J. Porras and Y. Curto, J. Pharm. Biomed. Anal., 42, 171 (2006). 8. F. Karatas, A. Cansiz, H. Cifci and Z. Serbetci, Chem. Nat. Comp., 43, 310 (2007).
9. V. Kienen, W.F. Costa, J.W. Visentainer, E. Souza and C. Oliveira, Talanta, 75, 141 (2008). 10. A. Koca, F. Yazici and M. Anil, Eur. Food Res. Technol., 215, 293 (2002).
11. O. Yilmaz, S. Keser, M. Tuzcu and B. Cetintas, Environ. Tox. Pharm., 24, 79 (2007). 12. A. Gliszczynska-Swiglo and E. Sikorska, J. Chromatogr. A, 1048, 195 (2004). 13. W.L. Hurley and R. Doane, J. Dairy Sci., 72, 784 (1989).
14. B. Kandlakunta, A. Rajendran and L. Thingnganing, Food Chem., 106, 85 (2008).
15. R.S. Gibson, Principles of Nutritional Assessment, New York Press: Oxford University Press (2006).
16. G. Regima and A. Ziegler, J. Nutr., 119, 116 (1989).
17. S. Ghoshal, S. Pasham, D.P. Odom and H.C. Furr, J. Nutr., 133, 2131 (2003). 18. K. Bagchi and S. Puri, East Mediterr Health J., 4, 350 (1998).
19. A.M. Pappas, Vitamin E: Tocopherols and Tocotrienols, Antioxidant Status, Diet, Nutrition and Health, Boca Raton (FL): CRC (1998).
20. Institute of Medicine, Panel on Dietary Antioxidants and Related Compounds. Dietary Refer-ence Intakes for Vitamin C, Vitamin E, Selenium and Carotenoids, Washington (DC), National Academy Press (2000).
21. R.L. Horst and T.A. Reinhardt, J. Dairy Sci., 66, 661 (1983). 22. I. Dickson, Nature, 18, 325 (1987).
23. J. Martin, S.A. Bach and M. Kohlmeier, J. Nutr., 126, 1181 (1996).