http://journals.tubitak.gov.tr/veterinary/ © TÜBİTAK
doi:10.3906/vet-1302-16
Immunohistochemical localization of transforming growth factor beta 2 and gene
expression using real-time PCR in capsaicin-administered rat testis during puberty
Gökhan NUR1, Mümtaz NAZLI2, Sevda ELİŞ YILDIZ3,* 1Directorate of Food Control Laboratory, Hatay, Turkey
2Department of Histology-Embryology, Faculty of Veterinary Medicine, Mehmet Akif Ersoy University, Burdur, Turkey 3Health High School, Kafkas University, Kars, Turkey
1. Introduction
Chili pepper is a plant included in the family Solanaceae; the botanical name of the plant is Capsicum annuum, and its active ingredient is capsaicin (CAP). CAP is a spicy, white, and odorless alkaloid. Tresh was the first person to isolate this active ingredient in 1846 (1–3). CAP affects the histophysiologies of numerous systems in the organism, mainly the cardiovascular, gastrointestinal, and respiratory systems. It has started to be used widely in the field of medicine and in the pharmaceutical industry, especially due to its said effects (4–6).
Transforming growth factor beta (TGFβ) was isolated from epithelial cell culture in the early 1980s. TGFβ acquired its name due to its phenotypic transformation in cells found in epithelial cell cultures (7,8). TGFβ is a potential inhibitor in terms of cell reproduction; it regulates cellular reproduction in most mesenchymal, endothelial, and hematopoietic stem cells (hemocytoblasts) by exhibiting this feature. Numerous studies report that each TGFβ isoform has only one function in the testis. For example, it regulates testis development, the reproduction of TGFβ2 germ cells, and TGFβ3spermatogenic cell differentiation
by intercepting the release of gonadotropins such as TGFβ1, luteinizing hormone, and follicle-stimulating hormone at the beginning of puberty (9–11).
The purpose of this study was to determine the effect of TGFβ2 on gene expression and the localization of immunohistochemicals in testis tissue by using the real-time PCR method to determine the gene expression of TGFβ2 in the testis tissue of rats that were administered capsaicin during puberty.
2. Materials and methods
2.1. Experimental animals and injection
This study was approved by the Animal Testing Local Ethics Committee of Kafkas University (no: 08.01.2010/01). The sample group of the study consisted of 50-day-old pubescent male Sprague Dawley rats with average weight of 150 g. Rats were fed ad libitum with pellet rat food and allowed to consume drinking water freely. The rats were kept in a 12-h daylight/12-h dark environment at 20–22 °C, with an average humidity level of 45%–60%.
The pubertal rats were divided into 3 groups: CAP (n = 10), sham (n = 10), and control (n = 10). The CAP
Abstract: The objective of this study was to investigate the effects of capsaicin on the testis distribution of transforming growth factor
beta 2 (TGFβ2) and gene expression using real-time PCR in pubescent rats. In this study, rats were divided into 3 groups: capsaicin (CAP), sham, and control. The CAP group was injected with 1 mg/kg doses of capsaicin (10% ethanol and 1% Tween in an 80% distilled water mixture) subcutaneously every day for a period of 1 week. The sham group was injected with a solution of 10% ethanol and 1% Tween in a mixture of 80% distilled water and nothing was injected in control rats. Regarding the histological appearance of testicular sections, the sham and control groups maintained the structure of connective tissue and seminiferous tubule, while in the CAP group, gaps among the tubule cells, invagination in the tubule cell wall, tubular integrity degradation, and breakdowns in the connective tissue were also observed. TGFβ2immunoreactivity was observed in mature spermatids of all groups; moreover, immunoreactivities in the groups were similar in intensity. These results demonstrate that capsaicin, which is already known to affect gastrointestinal, cardiovascular, and respiratory systems, also interferes with the expression of TGFβ2 in rat testis.
Key words: Capsaicin, TGFβ2,testis, real-time PCR, immunohistochemistry
Received: 28.02.2013 Accepted: 22.04.2014 Published Online: 17.06.2014 Printed: 16.07.2014 Research Article
group was injected with 1 mg/kg doses of capsaicin (10% ethanol and 1% Tween in an 80% distilled water mixture) subcutaneously every day for a period of 1 week. The sham group was injected with a solution of 10% ethanol and 1% Tween in a mixture of 80% distilled water, and the control group was not injected with anything. At the end of the week of treatment, all rats were weighed and then killed using deep ether anesthesia before removing the testis. 2.2. Histological and immunohistochemical analysis After removal, testis tissues were immediately fixed in a 10% formaldehyde and Bouin solution and routinely embedded in paraffin blocks, and 4-µm-thick serial sections were used for conventional histology. For immunohistochemistry, the sections were incubated in 3% H2O2 for 15 min to inhibit endogenous peroxidase activity after undergoing deparaffinization and rehydration. Maximum heat was applied in a microwave for 10 min in a citrate buffer solution to reveal antigens, after being washed with phosphate buffered saline (PBS). Blocking solution A (Invitrogen Histostain plus Broad Spectrum (AEC) Ref. 85.9943) was dripped onto the sections to reduce nonspecific binding of antibodies. Sections were then incubated with primary antibodies (Rabbit anti-TGFβ2; Santa Cruz Biotechnology Inc., USA) diluted 1:100 in PBS at room temperature for 1 h. Only PBS was dripped onto the tissues of the negative control group. The streptavidin-biotin peroxidase technique was used after primary antibody incubation (12). For this purpose, a broad spectrum antibody (Invitrogen Histostain plus Broad Spectrum (AEC) Ref. 85.9943) antibody, counter to the type produced by the primary antibody, was added to the sections, which were left at room temperature for 15 min. Streptavidin-horse radish peroxidase (Invitrogen Histostain plus Broad Spectrum (AEC) Ref. 85.9943) was dripped on the sections, which were then incubated at room temperature for 15 min. After adding 3-amino-9-ethylcarbazole (AEC) staining kit solution, the sections were placed under a light microscope to check for immunoreactivity; the reaction was inactivated with distilled water in accordance with the immunoreactivity status. It was then dipped in hematoxylin for negative staining. A lamella was placed over the kidney tissue after dripping water-based glue on them (LabVision, Large Volume Vision Mount, TA-060-UG). The slides were examined using a light microscope, and their photographs were taken. Scoring was conducted using a semiquantitative method on an area of the sections, based on criteria of the percentage of stained cells and the degree of staining. The degree of staining was evaluated as follows: 0 (no staining), 1+ (weak), 2+ (moderate), and 3+ (strong staining). The 5-µm-thick sections were stained with Crossman’s triple stain for histological investigations and other sections were immunostained for evidencing TGFβ2 in the testis (13).
2.3. Real-time PCR analysis 2.3.1. Isolation of total RNA
RNA was isolated using the RNeasy Mini Kit (QIAGEN, Germany). To avoid contamination with genomic DNA, RNA samples were treated with RNase-free DNAse I (QIAGEN). NanoDrop was used to measure the amount of RNA. RNA purity was verified in a formaldehyde-agarose gel.
2.3.2. Generation of gene-specific real-time PCR standards
With gene-specific primers, a cDNA fragment was amplified and column-purified using the QIAquick PCR purification kit (QIAGEN). The following primer sequences were used: rTGFβ2 (GI:311324) F(ATCGATGGCACCTCCACATATG), R(GCGAAGGCAGCAATTATGCTG); rGAPDH (GI:10190788) F(AGCCCAGAACATCATCCCTG), R (CACCACCTTCTTGATGTCA TC) (www.ncbi.nlm.nih. gov). 2.3.3. cDNA synthesis
Nine microliters of RNA template (2 ng to 2 µg) and 1 µL of random nanomer primer mix (QIAGEN) were added to 0.2-mL Eppendorf tubes in order to conduct cDNA synthesis. The tubes were then kept in the thermal cycler for 5 min at 65 °C. A master-mix (a total volume of 10 µL) was prepared for cDNA synthesis by mixing 2 µL of qScript 10X buffer, 1 µL of dNTP mix (deoxyribonucleotide triphosphate) at 10 mM each, 2 µL of DTT at 100 mM, 4 µL of RNAse/DNAse-free water, and 1 µL of qScript enzyme. Next, 10 µL of this master-mix was added to each Eppendorf tube. cDNA was obtained after keeping these tubes in the thermal cycler at 55 °C for 20 min and at 75 °C for 15 min. A gene-specific standard curve was generated from serial 10-time logarithmic dilutions of the cRNA by reverse transcription. By means of this strategy, we achieved a comparable PCR kinetic of standard and sample.
2.3.4. Real-time PCR
The lyophilized-form primer was diluted with RNAse/ DNAse-free water in accordance with protocol. The primers were kept at 56 °C for 5 min for better performance. Ten microliters of 2X qPCR SYBR Green master-mix, 4 µL of PCR-grade water (RNAse/DNAse-free water), 1 µL of reconstituted primer mix (TGFβ2 and GAPDH into different Eppendorf tubes), and 5 µL of cDNA were added into the Eppendorf tube to prepare the RT-PCR mix. The 20 µL of RT-PCR mix was then kept in the thermal cycler at 95 °C for 5 min in order to achieve enzyme activation. Afterwards, the content of the RT-PCR mix was subjected to reaction at 95 °C for 10 s for denaturation, at 55 °C for 30 s for annealing, and at 72 °C for 10 s for extension (50 cycles). Quantities of specific mRNA in the sample were
measured according to the corresponding gene-specific standard curve.
TGFβ2 gene expression levels were measured in samples of testicular sections between groups; data were expressed as mean ± standard deviation and were compared using one-way ANOVA and the Tukey honestly significant difference test. Differences were considered as significant when the P-value was less than 0.05.
3. Results
3.1. Histological findings
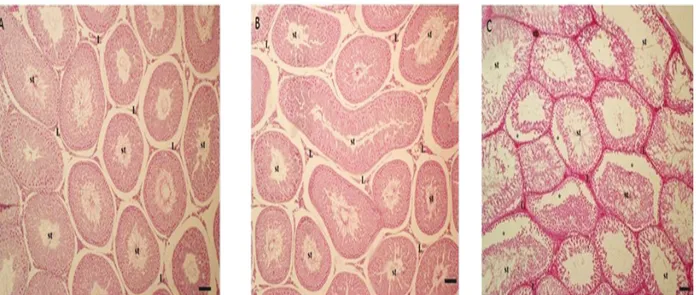
In terms of the histological appearance of testicular sections, while the sham and control groups maintained the structure of connective tissue and seminiferous tubule, in the CAP group, gaps among the tubule cells, invagination in the tubule cell wall, tubular integrity degradation, and breakdowns in the connective tissue were also observed (Figures 1A–1C).
3.2. Immunohistochemical findings
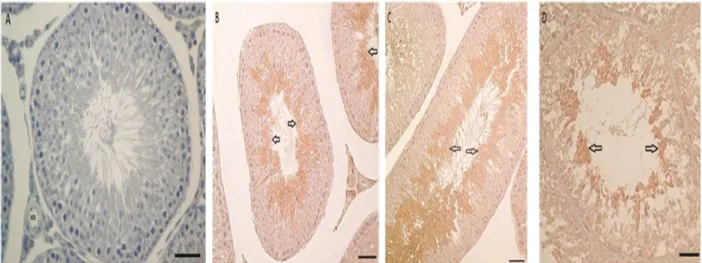
No staining was seen in the negative control samples when only secondary antibody was administered (Figure 2A). TGFβ2expression was examined using testis samples of the control, sham, and CAP groups (Figures 2B–2D). TGFβ2 displayed immunoreactivity in the mature spermatids in the experimental groups and the control group. The intensity of immunoreactivity was similar for all 3 groups. 3.3. Real-time PCR results
The gene expression level of TGFβ2 in the testis of CAP-administered pubertal rats was analyzed using the RT-PCR technique in the CAP, sham, and control groups; they were normalized with GAPDH as the reference gene. The standard curve was used to obtain complete
quantitative results (Figure 3A). Groups were statistically compared in terms of the GAPDH gene expression level in the testis tissue; there was no statistically significant difference between the groups based on a significance level of P < 0.05 (Table 1). There was a slight increase in the amplification of the GAPDH gene of the CAP group in comparison to the sham and control groups. The mean of GAPDH amplification values was similar for all 3 groups. After normalizing TGFβ2 amplification results using the reference gene, it was revealed that the expression levels of the CAP group and the sham group decreased in comparison to the control group. There was a statistically significant difference between the 3 groups at P < 0.05 (Table 2). Average gene concentration was calculated using quantitative data of the target and reference gene (Table 3). 4. Discussion
The changes in the histological structure of the testis tissue, the immunohistochemical localization of TGFβ2, and the gene expression (measured using real-time PCR) of rats receiving capsaicin during puberty were analyzed in this study. Jung et al. (14) stated that TGFβplays an important role in testicular development and function (7). Another study stated that in the immunohistochemical expression of TGFβin capsaicin-administered rat testis during postnatal development, while TGFβ1expression was observed in the Leydig cells and immature spermatids, TGFβ2expression was observed in the Leydig cells and mature spermatids. It was also reported that the expression in Leydig cells decreased with age (15). Some other studies determined that immunoreactivity of TGFβ2 was identified only in Leydig cells in pubertal rats, and in both Leydig cells and mature spermatid in mature rats. It was also
Figure 1. The general appearance of the testis section. A: Control group, B: Sham group, C: CAP group; st: tubulus seminiferus
reported that the strength of the reaction decreased with age in the Leydig cells (16–18). Jung et al. reported that TGFβ2 expression increased depending on age in mature spermatid in testis (14). This study’s results concluded that expression of TGFβ2was observed in mature spermatids, which reflects the results of other studies (16–18).
The real-time PCR method supports the results of other methods, which are conventional methods in particular. As a result of the immunohistochemical analysis that Kulka et al. conducted for the same gene region, it was reported that
there was an increase in the protein expression level in 70 of 210 patients (19). In this study, the TGFβ2 expression was examined with real-time PCR and immunohistochemical analysis of testis tissue taken from all groups, in parallel with results of studies in which real-time PCR and classic method results supported each other (19,20). Since the expression amount can be different at the protein and gene levels (19,20), TGFβ2 expression was observed to have different levels in the immunohistochemical and real-time PCR methods. In the real-time PCR section of
Figure 2. A: Immunoreactivity in the negative control group (only secondary antibody applied to testis section), B: Immunoreactivity
of TGFβ2 in the control group, C: Immunoreactivity of TGFβ2 in the sham group, D: Immunoreactivity of TGFβ2 in the CAP group (bar: 50 µm). 21227 bç 5148 bç 3530 bç 2027 bç 1584 bç 1375 bç 947 bç 831 bç 564 bç
Figure 3. The TGFβ2gene expression in the testis tissue of rats receiving capsaicin during puberty. 1: Marker, 2–11: CAP group, 12: Marker, 13–22: Sham group, 23: Marker, 24–33: Control group.
Table 1. A comparison of the GAPDH gene expression between
groups.
Groups N GAPDH mRNA SD F
CAP 10 80.660 6.465
3.27
Sham 10 72.307 3.100
Control 10 78.338 10.917
*: P < 0.05 (SD: standard deviation, F: F-value).
Table 2. A comparison of the TGFβ2 gene expression between
groups (TGFβ2normalized: TGFβ2 mRNA/GAPDH mRNA).
Groups N TGFβ2 normalized SD F
CAP 10 0.0032* 0.00032
185.44
Sham 10 0.0060* 0.00034
Control 10 0.0076* 0.00076
this study, the TGFβ2expression level in the testis tissue was examined in terms of the difference between groups. After TGFβ2amplification, values were normalized using the reference gene GAPDH, and this rate was determined to be 0.0032 in the CAP group, 0.0060 in the sham group, and 0.0076 in the control group. In the control group, the entirety of the seminiferous tubule was preserved, the spermatogenic cell lines were normal, and their bonds with the Sertoli cells were ordinary; this enabled TGFβ2 expression to be at the normal level in this group. Even though in the sham group the carrier solution containing solvents of this ingredient was injected instead of a CAP injection, the TGFβ2 expression was lower in this group in comparison to the control group; this situation is thought to be associated with oxidative stress caused by the diethyl ether anesthesia to which rats were exposed before each injection. The TGFβ2 expression level was particularly significantly lower in the CAP group compared to the control group; the reason for this is the effect of CAP on the testis depending on the ingredient used and its amount. These effects stimulate the neurotransmitter ingredient release from sensory nerve ends (13) and
change the hormonal secretion amount in the pituitary glands; therefore, the possible effects of these hormones on the testis may change the gene expression in the target cells and cause the TGFβ2expression to decrease.
We think that while the seminiferous tubule had a normal appearance in the control and sham groups, vacuoles may have formed in the CAP group due to increased cell death in some tubules. According to real-time PCR and immunohistochemical analysis, it is seen that the decrease in TGFβ2expression in the CAP group, based on the applied dosage in comparison to the control group, causes the changes in testicular functions, and some of the cases that arise in the tubules, as stated above, result in structural disorders in seminiferous tubules and changes in the expression level of growth factors.
Acknowledgments
This study was conducted with the support of the Kafkas University Scientific and Technological Research Fund (Project No: 2010-VF-21) and with contributions from QIAGEN ATQ Biotechnology. This study was summarized from the PhD thesis of the first author.
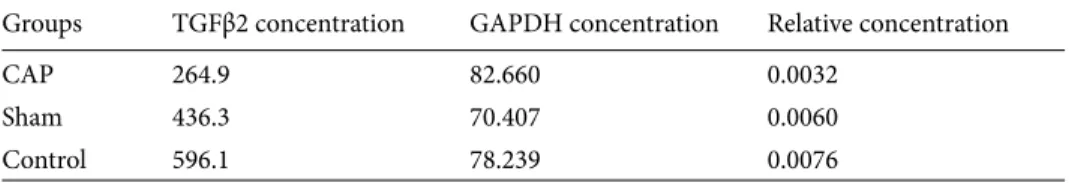
Table 3. Average gene concentrations calculated using quantitative data belonging to the target and
reference gene.
Groups TGFβ2 concentration GAPDH concentration Relative concentration
CAP 264.9 82.660 0.0032
Sham 436.3 70.407 0.0060
Control 596.1 78.239 0.0076
*: P < 0.05 (SD: standard deviation, F: F-value).
References
1. Lembeck F. Columbus, capsicum and capsaicin: past, present and future. Acta Physiol Hung 1987; 69: 265–273.
2. Szallasi A, Blumberg PM. Vanilliod (capsaicin) receptors and mechanisms. Pharmacol Rev 1999; 51: 159–211.
3. Takahata K, Chen X, Monobe K, Tada M. Growth inhibition of capsaicin on HeLa cells is not mediated by intracellular calcium mobilization. Life Sci 1999; 64: 165–171.
4. Jancsó G, Such G. Effects of capsaicin applied perineurally to the vagus nerve on cardiovascular and respiratory functions in the cat. J Physiol 1983; 341: 359–370.
5. Kress M, Gutimann C, Averbeck B, Reeh PW. Calcitonin gene related peptide and prostaglandin E2 but not substance P release induced by antidromic nerve stimulation from rat skin in vitro. Neuroscience 1999; 89: 303–310.
6. Teng CH, Kang JY, Wee A, Lee KO. Protective action of capsaicin and chilli on haemorrhagic shock-induced gastric mucosal injury in the rat. J Gastroen Hepatol 1998; 13: 1007–1014.
7. Bondestam J. Ligands & signaling components of the transforming growth factor beta family. Helsinki University Biomedical Dissertations 2002; 17: 9–12.
8. Piek E, Heldin C, Dijke PT. Specificity, diversity, and regulation in TGF-β superfamily signaling. FASEB J 1999; 13: 2105–2118.
9. Konrad L, Albrecht M, Renneberg H, Aumuller G. Transforming growth factor-β2 mediates mesenchymal-epithelial interactions of testicular somatic cells. Endocrinology 2000; 141: 3679–3686.
10. Lui WY, Lee WM, Cheng CY. TGF-βs: their role in testicular function and Sertoli cell tight junction dynamics. Int J Androl 2003; 26: 147–160.
11. Mullaney BT, Skinner MK. Transforming growth factor-beta (beta 1, beta 2, and beta 3) gene expression and action during pubertal development of the seminiferous tubule: potential role at the onset of spermatogenesis. Mol Endocrinol 1993; 7: 67–76.
12. Hsu SM, Raine L, Fanger H. Use of avidin-biotin-peroxidase complex (ABC) in immunoperoxidase techniques: a comparison between ABC and unlabeled antibody (PAP) procedures. J Histochem Cytochem 1981; 29: 577–580.
13. Crossmann GA. A modification of Mallory’s connective tissue stain with a discussion of the principles involved. Anat Rec 1937; 69: 33–38.
14. Jung JC, Park GT, Kim KH, Woo JH, An JM, Kim KC, Chung HY, Bae YS, Park JW, Kang SS et al. Differential expression of transforming growth factor-β in the interstitial tissue of testis during aging. J Cell Biochem; 2004: 92: 92–98.
15. Akkoç-Özgüden CG, Özer A. Immunohistochemical localization of transforming growth factor β1 and β2 in mouse testis during postnatal development. Biotech Histochem 2012; 87: 154–159.
16. Ingman WV, Robertson SA. Defining the actions of transforming growth factor beta in reproduction. BioEssays 2001; 24: 904–914.
17. Teerds KJ, Dorrington JH. Localization of transforming growth factor beta 1 and beta 2 during testicular development in the rat. Biol Reprod 1993; 48: 40–45.
18. Olaso R, Pairault C, Habert R. Expression of type I and II receptors for transforming growth factor beta in the adult rat testis. Histochem Cell Biol 1998; 110: 613–618.
19. Kulka J, Tôkés AM, Kaposi-Novák P, Udvarhelyi N, Keller A, Schaff Z. Detection of HER-2/neu gene amplification in breast carcinomas using quantitative real-time PCR - a comparison with immunohistochemical and FISH results. Pathol Oncol Res 2006; 12: 197–204.
20. Pellegrini C, Falleni M, Marchetti A, Cassani B, Miozzo M, Buttitta F, Roncalli M, Coggi G, Bosari S. HER2/neu alterations in non-small cell lung cancer: a comprehensive evaluation by real-time reverse transcription-PCR, fluorescence in situ hybridization, and immunohistochemistry. Clin Cancer Res 2003; 9: 3645–3652.