CONDENSED MATTER
Comparative Investigations of Light Transmission in Aligned
and Non-aligned Textures of Homogeneous Mixtures
of 4-n-alkyl-4
′-Cyanibiphenyl Mesogens at Direct and Reverse
smectic A ↔ isotropic liquid Phase Transitions
Arif Nesrullajev1
Received: 14 November 2016 / Published online: 6 March 2017 # Sociedade Brasileira de Física 2017
Abstract The thermo-optical properties of various types of textures (the homeotropic, planar, and tilted aligned and non-aligned textures) in liquid crystalline materials with smec-tic A mesophase have been investigated. Investigations have been carried out for large temperature interval and at the direct smectic A mesophase–isotropic liquid (SmA–I) and isotropic liquid–smectic A mesophase (I–SmA) phase transitions that have been carried out. Homogeneous mixtures of 4-n-octyl-4′-cyanobiphenyl with 4-n-decyl-4-n-octyl-4′-cyanobiphenyl were the objects of the investigations. Temperature dependences of the optical transmission for aligned and non-aligned textures have been measured. Temperature widths of the heterophase regions for the SmA–I and I–SmA phase transitions have been determined. The temperature shift in the optical transmission dependences to low temperatures for the reverse I–SmA phase transition temperatures and the thermal hysteresis has been found for the aligned and non-aligned textures.
Keywords Liquid crystals . Thermo-optical properties . Defects . Aligned textures . Non-aligned textures . Biphasic regions
1 Introduction
Liquid crystalline materials exhibit partially ordering ties of solid crystalline materials and have rheological proper-ties of fluids. Therefore, liquid crystals exhibit unusual
structural and physical properties and are sensitive materials to various external effects and boundary conditions [1–4]. These materials display anisotropy of the optical, diamagnetic, dielectric, acoustic, viscous-elastic etc. properties and are im-portant and perspective materials for application in special liq-uid crystalline devices as active displays, multimatric elements, indicators etc. [5–10]. In such devices, the aligned liquid crys-talline textures are the active elements. Besides, the aligned textures (homeotropic, planar, tilted, and twist aligned textures) and non-aligned textures (specific textures for definite liquid crystalline mesophases) are used for studies of physical aniso-tropic properties of liquid crystalline materials.
Liquid crystalline devices, displays, and indicators usually use within various temperature intervals, at different thermal regimes and climatic conditions. Moreover, liquid crystals are attractive materials for application as reversible active matrix in various optical systems for heating–cooling and cooling– heating processes. Therefore, investigations of the thermo-tropic and thermo-optical properties of liquid crystals, which can be switched at the liquid crystalline mesophase–isotropic liquid and isotropic liquid–liquid crystalline mesophase phase transitions, are important topics from both fundamental and application points of view.
For large application of liquid crystalline materials in tech-nique and technology, materials with diverse mesophases, var-ious mesomorphic degree, different width of thermal interval, and different types of phase transitions are necessary. Besides, for such applications, liquid crystalline materials with definite physical and physico-chemical properties, especially with def-inite thermo-morphologic, thermo-optical, and thermotropic properties, are requested. Therefore, investigations of physical properties of liquid crystalline mixtures attract the intent atten-tion of scientists over the past decade [11–17]. The point is that liquid crystalline mixtures display physical and physical–chem-ical properties, which are not displayed in individual mesogens.
* Arif Nesrullajev [email protected]
1 Faculty of Natural Sciences, Department of Physics, Laboratory of Liquid and Solid Crystals, Mugla Sitki Kocman University, 48000 Mugla, Turkey
In this work, we are interested in comparative investiga-tions of the thermo-optical properties in various types of tex-tures of smectic A mesophase at the direct smectic A mesophase–isotropic liquid (SmA–I) and reverse isotropic liquid–smectic A mesophase (I–SmA) phase transitions. Temperature dependences of the optical transmission for the homeotropic, planar, and tilted aligned and non-aligned tex-tures have been investigated. Temperature widths of the heterophase regions for the SmA–I and I–SmA phase transi-tions have been determined. Homogeneous mixtures of 4-n-octyl-4′-cyanobiphenyl with 4-n-decyl-4′-cyanobiphenyl have been used in our investigations.
2 Experimental
2.1 Materials
In this work, two homogeneous mixtures of 4-n-octyl-4′-cyanobiphenyl (8CB) with 4-n-decyl-4′-cyanobiphenyl (10CB) have been used. Compositions of these mixtures were as 3 5.0 0 wt.%8CB + 65 .00 wt. %10CB (M1) a nd 20.00wt.%8CB + 80.00wt.%10CB (M2). 4-N-alkyl-4′-cyanobiphenyls were purchased from Merck and used without further purification. The structural formula of 4-n-alkyl-4′-cyanobiphenyls are given in Scheme1.
4-N-alkyl-4′-cyanobiphenyl liquid crystals are mesogenic compounds, which have uniaxial molecular symmetry and good photo(chemical) stability, and also are thermally stable and stable to a moisture. Molecules of 4-n-alkyl-4′-cyanobiphenyls can be considered as rigid rods, which have the cylindrical symmetry about the axis of maximum polariz-ability. Besides, these liquid crystals have large dipole mo-ment and can easily form various types of aligned textures. Therefore, 4-n-alkyl-4′-cyanobiphenyls are important mate-rials for scientific investigation and technical and technologi-cal applications.
2.2 Methods and Samples
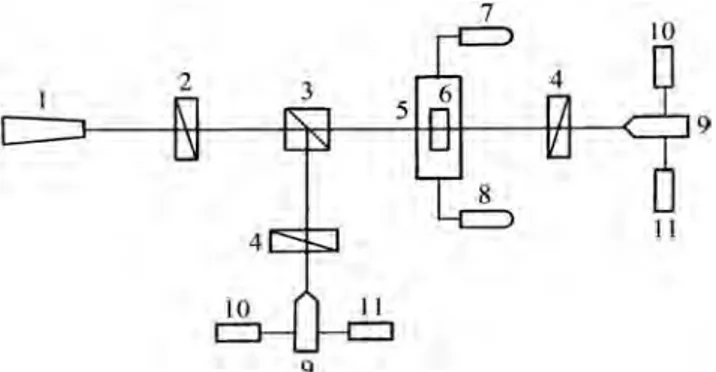
In this work, temperature dependences of the optical transmission (OT) have been investigated, and temperature widths of the heterophase regions of the direct SmA–I and reverse I–SmA phase transitions have been determined for M1 and M2 mixtures. The temperature dependences of the OT have been investigated using the special thermo-optical set-up. A sketch of the
experimental setup is presented in Fig. 1. The heating and cooling rate during the optical measurements was as 0.5 K min−1. The samples as the sandwich cells with the homeotropic, planar, and tilted aligned textures and with non-aligned mono-crystalline texture have been used in this research. For investi-gations of the OT behavior, the samples with the planar align-ment were placed between the crossed polarizers in position with 45°, for maximum light intensity and also perpendicularly to the incident light. The samples with non-aligned textures were placed between crossed polarizers in arbitrary position and perpendicularly to the incident light. The samples with the homeotropic and tilted alignment were placed in the set-up without polarizers and perpendicularly to the incident light. Investigation of the thermo-morphologic properties and de-termination of the temperature width of the heterophase re-gions for the SmA–I and I–SmA phase transitions have been carried out by the capillary temperature wedge (CTW) device [18,19]. The CTW device is based on the temperature wedge method [20]. This device was presented in the references [19–22] and was used for studies of the thermotropic proper-ties and thermal states of liquid crystalline materials [22–25]. The CTW device allows to obtain simultaneously all of the thermal states of liquid crystalline material in real-time scale and also to calculate the temperature and linear widths of the heterophase regions of the phase transitions with accuracy not less as ±10−2K and ±2.0 10−3mm, respectively [19–22]. In the CTW device, a homogeneous temperature gradient along the long axis of the sample was performed. The temperature gradient has been determined as 1.2 K mm−1.
The samples, which were used in this research, were the sandwich cells as the plane capillaries. The thickness of liquid crystal was determined as 20.0 ± 0.1μm.
3 Results and Discussion
In this work, as is noted above, the samples with the homeotropic, planar, and tilted aligned textures and with
Scheme 1 The structural formula of 4-n-alkyl-4′-cyanobiphenyls. 8CB:
Fig. 1 Schematic representation of the experimental set-up. 1 He-Ne laser; 2 polarizer; 3 beam splitter; 4 analyzers; 5 thermostat; 6 the sandwich cell; 7 digital temperature control system; 8 power supply; 9
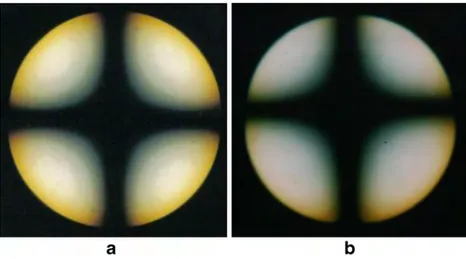
non-aligned texture of M1 and M2 mixtures have been used. The homeotropic aligned textures are optically isotropic for light, falling perpendicularly to the sandwich cell (Fig.2a). In this texture, molecules of liquid crystal are placed perpendic-ularly to the reference surfaces of the sandwich cell. These textures in M1 and M2 mixtures are characterized by the conoscopic images, which are presented in Figs.3a and4a, respectively. The degree of homeotropic alignment was deter-mined by an invariance of the center of the conoscopic image relatively a rotation of the sandwich cell, which was placed between crossed polarizers. In such texture, the angle between the normal to the reference surfaces of the sandwich cell and the director n!is asθ = 0. The planar aligned textures are optically anisotropic for light, falling perpendicularly on the sandwich cell surface (Fig.2b), and exhibit the optical bire-fringence. In such texture, molecules of liquid crystal are placed parallel to the reference surfaces of the sandwich cell. Besides, in such texture, the angle between the normal to the reference surfaces of the sandwich cell and the director n!is as θ ¼π
2. In the planar texture, by rotation of the sandwich cell,
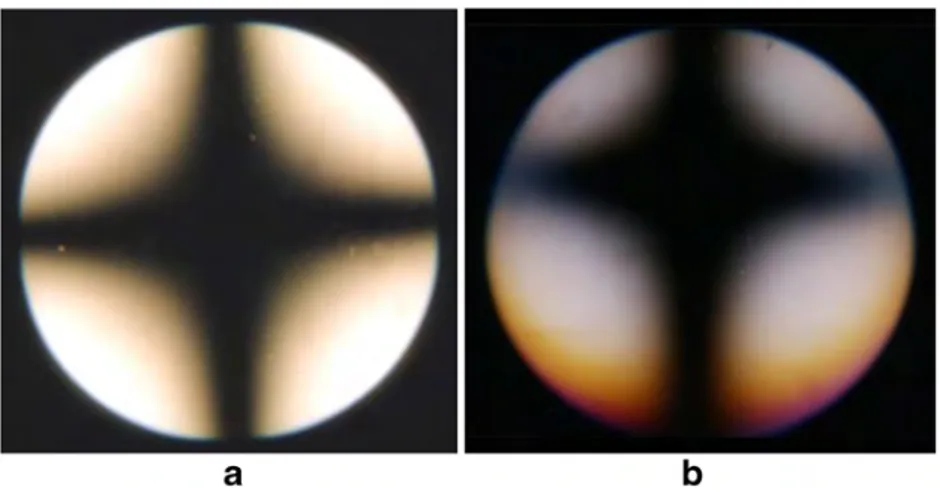
which was placed between crossed polarizers, successive brightness and darkness for each 45° have been observed. The tilted aligned textures are partially optically isotropic for light, falling perpendicularly to the sandwich cell (Fig. 2c). These textures in M1 and M2 mixtures are characterized by the specific conoscopic images, which are presented in Figs.3b and4b, respectively. In these textures, molecules of liquid crystal are placed tilted to the reference surfaces of the sandwich cell. In the tilted aligned texture, the angle between the normal to the reference surfaces of the sandwich cell and the director n!is as 0< θ≤π2. From measurement of the shift of the conoscopic image center from the geometric center of the figure by the optical object micrometer,θ angle can be determined. These angles were determined as 14∘ and 22∘ for M1 and M2 mixtures, accordingly. The non-aligned tex-tures of liquid crystals cannot be characterized by definite value of the director n!. Such textures consist of separately aligned regions and are monocrystalline (Fig.2d). As the non-aligned textures, the confocal textures have been observed in M1 and M2 mixtures (Fig. 5). As is known, the confocal
Fig. 3 Conoscopic images of aligned textures of M1 mixture. a Homeotropic alignment. b Titled alignment
Fig. 2 Sketch of texture types. a Homeotropic aligned texture. b Planar aligned texture. c Tilted aligned texture. d Non-aligned texture t:::
1111111 II I Ill
II
Ill I
T
I
11111
1111111
I
11111
1111
I
cs
I 1111111111111 1111
o
;
o
f i11cide111 lighta
a
-=
- -
= =
=---=---
---,...:
--=
=- -
_____.,.
-- -- -- -- -- -- -- -- -- -- ~ -- directorn
---
---=
---
=
0=tr/1t
incide111 lighrb
t
incidenl lightd
b
formations are three-dimensional figures [1,26–28]. The ge-ometry of each individual confocal formation is sufficiently complicated. In the confocal textures, the ellipse and hyper-boles in confocal arrangement take place. A plane of elliptic basis of the confocal formation and the hyperbole is mutually perpendicular. Appearance of the above mentioned formations is connected with layering structure of liquid crystalline mesophase, as it takes place in SmA mesophase.
Investigations showed that M1 and M2 mixtures are mono-morphic mesogens and display the crystal (Cr)–SmA mesophase–isotropic liquid–SmA mesophase–crystal (Cr) se-quence of the phase transitions. Investigations by the CTW method showed also that temperatures of the direct Cr–SmA and SmA–I phase transitions are different from temperatures of the reverse I–SmA and SmA–Cr phase transitions. Namely, the shift of the reverse phase transition temperatures to low temperatures has been observed in M1 and M2 mixtures (Table1). Such distinction in temperatures of the direct and reverse phase transitions indicates that in M1 and M2 mix-tures, the thermal hysteresis takes place. Such type of the thermal hysteresis is typical for the first-order liquid crystal-line mesophase–isotropic liquid phase transitions and has been also observed by different researchers for various liquid crystalline materials [22,29–39].
Investigations also showed that the homeotropic, planar, and tilted aligned and non-aligned textures of M1 and M2 mixtures exhibit quite different type of dependences of the
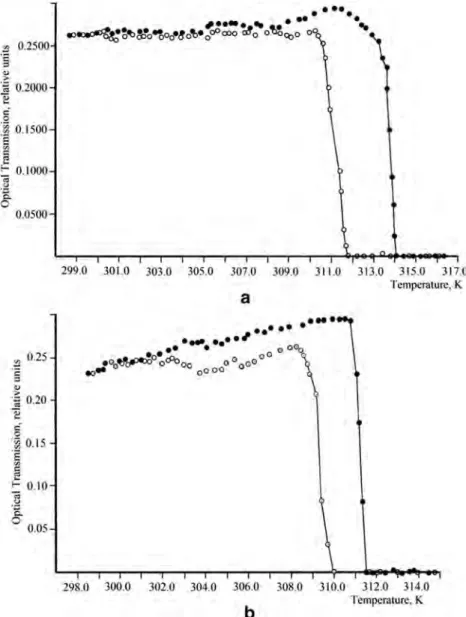
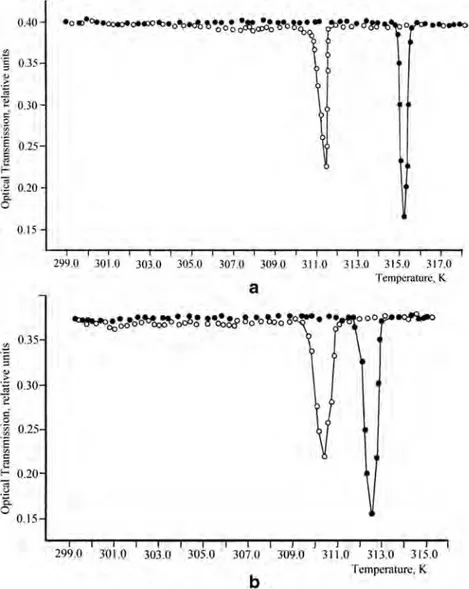
OT vs temperature. In Figs. 6,7,8 and 9, dependences of the OT vs temperature for M1 and M2 mixtures are given. As seen in Fig.6, in non-aligned textures by an increase of temperature, weak and continuous fluctuations of the OT take place. Investigations of texture transformations in this temper-ature regions showed that fluctuations of the OT are connected with weak transformations of the confocal formations and with change of their distribution in volume of the sandwich cell. By drawing near to a region of the SmA–I phase transi-tion, sharp decrease of the OT has been observed for both M1 and M2 mixtures. Investigation of texture transformations showed that sharp transformations of the confocal formations take place in this temperature region. For these samples, the OT values were equal 0 at the clearing point.
As seen in Fig.7, with an increase of temperature, the OT remains constant in definite and sufficiently large temperature interval in the homeotropic aligned samples of M1 and M2 mixtures. The thermo-morphologic investigations showed that in this temperature interval, any texture transformations have not been observed and the image of the conoscopic cross has been kept stable. This fact indicates on stability of the homeotropic alignment in M1 and M2 mixtures. The jump of the OT has been observed in the regions of the SmA–I phase transitions. Then, in isotropic liquid temperature inter-val, behavior of the OT was as this behavior in the homeotropic aligned textures of SmA. This peculiarity of the OT is connected with the fact that samples with the
Fig. 5 Non-aligned confocal textures of M1 and M2 mixtures. Crossed polarizers; magnification ×100. a M1 mixture, temperature 300.3 K. b M2 mixture, temperature 298.6 K Fig. 4 Conoscopic images of aligned textures of M2 mixture. a Homeotropic alignment. b Titled alignment
homeotropic alignment in SmA mesophase and in isotropic liquid state are optically isotropic for the light, falling perpen-dicularly to the sandwich cell (and, accordingly, parallel to the director n!of the homeotropic aligned mesophase).
Samples with the planar alignment of M1 and M2 mixtures exhibit sufficiently interesting temperature behavior of the OT. As seen in Fig.8, values of the OT are practically constant in temperature interval of SmA mesophase. Then, by an increase
Fig. 6 Temperature dependences of the OT for non-aligned texture in M1 (a) and M2 (b) mixtures. These dependences were obtained with crossed polarizer and analyzer
Table 1 Features of phase transition temperatures in M1 and M2 mixtures
Liquid crystal Texture type Phase Transition temperatures, K
Cr–SmA SmA–I I–SmA SmA–Cr M1 mixture Homeotropic aligned 274.0 315.3 313.3 273.5
Planar aligned 273.7 316.1 314.0 273.0 Tilted aligned 273.1 314.8 312.7 272.6
Non-aligned 272.5 314.1 311.9 272.1
M2 mixture Homeotropic aligned 274.5 312.6 310.8 274.2 Planar aligned 274.9 313.3 312.0 273.3 Tilted aligned 274.1 312.0 310.3 273.7 Non-aligned 273.8 311.4 309.7 273.3 o11 0,2500 '§l ~ ·~ 0.1000
f
c 0 ·~ 0.1500·
e
..
c:;e
!- 0.1()(1(15
·g_ 0 0.0500 .~ 0.25 5 §! ·;1 0.20i
c 0 ,~ 0.15·
e
i
r 0.10]
C. 0 0.05 299.0 301.0 303.0 305.0 307.0 309.0 311.0 313,0 15.0 ]17\)a
•••
••
.... • •• 1 •• • • oo-•
r,,
•
_,,_
00 • % ~ o-.rvoo o O 0oGeo
-
0 000 Temperature, K...
298.0 300.0 302.0 304.0 306.0 308.0 310.0 312.0 314.0b
Tempcr.1111rc, Kof temperature, the sharp decrease of the OT in definite tem-perature interval for these mixtures has been observed (Fig.8). The thermo-morphologic investigations showed that such changes of the OT take place in the heterophase regions of the SmA–I phase transition. Temperature dependences of the OT for the planar alignment texture, which is optically bire-fringent (i.e., is optically anisotropic), are very similar to a temperature dependences of the birefringenceΔn. Such de-pendences were observed in various liquid crystalline mesophases by different researchers for the first-order mesophase–isotropic liquid phase transitions [40–46]. We would like to note that some tensorial parameters, such as the anisotropy of dielectric, magnetic, optical, viscous-elastic etc. properties can be used for the determination of the macroscop-ic order parameter in liquid crystals [1,26,37,47,48]. As is known, the OT is also tensorial parameter [1, 49–51]. Therefore, it is clear that the temperature behavior of the OT in the planar alignment textures of liquid crystalline material
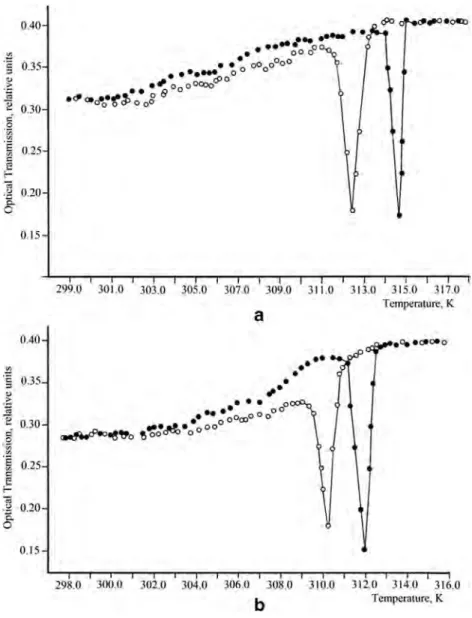
In Fig.9, dependences of the OT vs temperature for the tilted aligned texture in M1 and M2 mixtures are presented. As seen in this figure, gradual increase of the OT and some fluctuations of this parameter with an increase of temperature take place. The thermo-morphologic investigation of textures and observa-tion of transformaobserva-tions of the conoscopic image of the tilted aligned texture in mixtures under investigations showed that in SmA mesophase temperature interval, texture fluctuations and fluent changes of the conoscopic images take place. Change of view of the conoscopic image is connected with change of homogeneity of tilted alignment of SmA mesophase in M1 and M2 mixtures. This fact indicates on non-stability of the tilted alignment in these mixtures. In the region of the SmA–I phase transitions, the jump-like change of the OT has been observed (Fig.9). Then, in isotropic liquid state, the OT was stable and did not change with an increase of temperature. As seen in Figs.6,7,8and9, the shift of fluctuation regions of the OT at the reverse I–SmA phase transition to low
tem-Fig. 7 Temperature dependences of the OT for the homeotropic aligned texture in M1 (a) and M2 (b) mixtures. These dependences were obtained with parallel polarizer and analyzer
0.40 !!I .§ OJ.S
"
.:: ;; ~ 0.30 ,:'' ~ "' ·~ 0_15e
i--;;; .!:t 0.20 C. 0 0.15 c!l 0.35 ·1: :;-~
;. 0.301!
e: 0 :~ 0.25 E "' C e !- 0.20]
<>. 0 0.15 299.0 301.0 JOJ_O 305.0 307.(1 309,U 311.0 313,0 315.0 317.0a
·rempcrncure, K ooo 299.0 0\,0 30m 305.0 307,0 109.0 JIU) 313.0 31'5.0b
Tcmpernture, Ktemperature shift for the reverse phase transitions, i.e., the thermal hysteresis, is typical for the first-order transitions. The thermal hysteresis was theoretically predicted in the ref-erences [52–55] and was experimentally observed for such transitions in various liquid crystals by different researchers [22,29–39]. Comparison of temperature behavior of the OT with temperature transformations of textures showed that val-ue of this temperature shift in the OT dependences to low temperatures is in full conformity with differences in the SmA–I and I–SmA phase transition temperatures (Table1).
Besides, as seen from comparison of Figs.6,7,8and 9, temperatures of the SmA–I phase transition in M1 and M2 mixtures depended on type of liquid crystalline texture. In Table1, temperatures of the SmA–I phase transitions in M1
and M2 mixtures are tabulated. As seen in this table, change of
type of liquid crystalline texture leads to change of SmA–I phase transition temperatures in M1 and M2 mixtures. Namely, for the direct SmA–I phase transition, the differences in phase transition temperatures for various types of aligned textures in comparison with temperature of non-aligned tex-ture in M1 mixtex-ture are as 0.7 K (for the tilted aligned textex-ture), 1.2 K (for the homeotropic aligned), and 2.0 (for the planar aligned texture); in M2 mixture, these differences are as 0.6 K (for the tilted aligned texture), 1.2 K (for the homeotropic aligned), and 1.9 K (for the planar aligned texture). For the reverse I–SmA phase transition, the differences in phase tran-sition temperatures for various types of aligned textures in comparison with temperature of non-aligned texture in M1 mixture are as 0.6 K (for the tilted aligned texture), 1.2 K (for the homeotropic aligned), and 1.9 K (for the planar
Fig. 8 Temperature dependences of the OT for the planar aligned texture in M1 (a) and M2 (b) mixtures. These dependences were obtained with crossed polarizer and analyzer
8 C: !l, C: :.E I!:! iii I) 3500
o
.
00() 0,2500 0,2000 0.1500 0.1000 (l.0500 0.30 !!I '.,
§ 0.25.
;:;:::
~
0.20 C: 0 •;;; .!:!! ~ 0.15{5
]•
a
0.10 0 0.05 • aeo•
...
0 0 0 0 0 0 0 0 0 0 % 0 0 0 0 0~
0"
...
•
\•
•
•
•
'
•
•
•
•
'
I•
•
•
•
•
•
I•
•
•
299.0 301_0 30 ,0 3(15J} 107,0 309 0 311,0 313,0 315.0 JJ7.0a
rcmpcratun:. K-~~-
o o oOOo...
00000 0000oe···
0.. .
• • 0 0 . . . 0 00 ' Oo 298.0 )00.0 302.0 304,0 306.0 308.0 310.0 312.0 314.0 316,0b
~rnp~r:11un.,, Kaligned texture); in M2 mixture, these differences are as 0.6 K (for the tilted aligned texture), 1.1 K (for the homeotropic aligned), and 2.3 K (for the planar aligned texture). Thus, type of liquid crystalline texture has sufficient effect on the temper-ature dependences of the OT, on regions of sharp fluctuations of the OT and also on differences in temperatures of the direct SmA–I and reverse I–SmA phase transition temperatures. This effect is obviously connected with the character of the interaction between liquid crystalline molecules and reference surfaces of the sandwich cell, i.e., is connected with the liquid crystalline molecule–surface anchoring energy. The non-aligned textures of liquid crystalline mesophases are sponta-neously forming in the sandwich cell with non-elaborated ref-erence surfaces. But the aligned textures of these mesophases are formed on the elaborated surfaces. By the way, to obtain various types of aligned textures, different type of the surface elaboration is necessary [22,56–61]. In the case of the elabo-rated surfaces, the anchoring energy between liquid crystalline
that for the non-aligned textures. Besides, as it is presented in references [61–64], the interaction between liquid crystalline molecules and the reference surfaces for different types of the aligned textures is different. Therefore, it is clear that the great-er anchoring engreat-ergy leads to an increase of the thgreat-ermal engreat-ergy, which is necessary for carrying out the mesophase–isotropic liquid phase transition [26,52,60,63,64].
4 Summary
The results, obtained in this work, may be shortly summarized as follows:
– Behavior of temperature dependences of the OT of SmA mesophase in M1 and M2 mixtures depends on type of liquid crystalline texture. This peculiarity of the OT is
Fig. 9 Temperature dependences of the OT for the tilted aligned texture in M1 (a) and M2 (b) mixtures. These dependences were obtained with parallel polarizer and analyzer
040 "' "i: 0.35 ::,
...
. ::: ;; 2 0.30g
'<ii "' .E 0.25 "' C e r-
~
0.20 Q. 0,15 OAO !!J ·c 0.35 =t"
> ";:$ .s e 0.30,
j
·
s
0.25~
~ ':;i"
0.10 •:; C. 0 0.15••
,
....
-• -• . . . . oO OO ' • • • 00 0000 e . . . 0 0 0 • • • " Oo o0Q;>o,s,o•
,,
<»c!'o•t
~ 008
& 299.\) 30J.0 303.0 305.0 307.0 309.0 311.0 313.0 315.0 317.0a
•
,,.
• • • 0 •• oO •• . . oOo!$Jooo . . . oo ~ ~ " 'o !, ood"O o 0 298.0 300.0 302.0 304,0 306J) 301:1,0b
•••
••
Tcmperatun.', K 10.0 31:!..0 314.0 316.0 Temperature, Kbetween liquid crystalline molecules and reference sur-faces of the sandwich cell.
– Temperature behavior of the OT for the homeotropic, planar, and tilted aligned and non-aligned textures of SmA mesophase in M1 and M2 mixtures is in full con-formity with character of the thermo-morphologic prop-erties of these textures.
– In the region of the direct SmA–I and reverse I–SmA phase transition, sufficiently sharp fluctuations and changes of the OT have been observed.
– The temperature shift in the OT dependences to low tem-peratures for the reverse I–SmA phase transition temper-atures, i.e., the thermal hysteresis, takes place in M1 and M2 mixtures. The thermic hysteresis is typical display for the first-order liquid crystalline mesophase–isotropic liquid phase transition. The thermal hysteresis for the first-order phase transitions was also observed for various physical parameters by different researchers [22,29–39].
References
1. P.G. de Gennes, P. Prost, The physics of liquid crystals (Clarendon Press, Oxford, 1993)
2. D.G. Yang, S.T. Wu, Fundamentals of liquid crystal devices (Wiley, New York, 2006)
3. R.G. Chen, Liquid crystal displays: fundamental physics and technology (Wiley, Hoboken, 2011)
4. Q. Li, Liquid crystals beyond displays: chemistry, physics, and applications (Wiley, Hoboken, 2012)
5. E. Lueder, Liquid crystal displays: addressing, schemes and electro-optical effects (Wiley, New York, 2001)
6. W. de Boer, Active matrix liquid crystal displays: fundamentals and applications (Burlington, Elsevier, 2005)
7. S. Singh, Liquid crystals. Fundamentals (World Scientific, Singapore, 2002)
8. P. Yeh, C. Gu, Optics of liquid crystal displays (New York, Wiley, 1999)
9. G. Crawford, Flexible flat panel displays (New York, Wiley, 2005) 10. J. W. Goodby, P. J. Collings, T. Kato, C. Tschierske, H. Gleeson, P. Raynes (eds.), Handbook of liquid crystals (2014) (Wiley, London, 2014)
11. G. Cinacchi, L. Mederos, E. Velasco, J. Chem. Phys. 121, 3854 (2004)
12. E.R. Soule A.D. Rey, Mol. Simul. 38, 735 (2012)
13. B. Rozic, M. Jagodic, S. Gyergyek, G. Lahajnar, V. Popa-Nita, Z. Jarlicic, M. Drofenik, Z. Kutniak and S. Kralj, NATO Science for Peace and Security Series A: Chemistry and Biology (NATO Publ., 2010) pp. 125–139
14. N. Chaturvedi, S. Pandley, S.N. Tiwari, N.B. Singh, Emerg. Mater. Res. 1, 164 (2012)
15. N. Kapernaum, F. Khecht, C. Scott Hartley, J.C. Roberts, R.P. Lemieux, F. Giessetman, K. Beistein, Formation of smectic phases in binary liquid crystal mixtures with a huge length ratio. J. Org. Chem. 8, 1118 (2012)
16. E. Nowinonowski-Kruszelnicki, J. Kedzierski, Z. Raszewski, W. Piecek, P. Perkowski, K. Ogrodnik, P. Morawiak, E. Miszczyk, Opt. Appl. 42, 167 (2012)
17. I. Chirtoc, M. Chirtoc, C. Glorieux, J. Thoen, Determination of the order parameter and its critical exponent for nCB (n=5-8) liquid crystals from refractive index data. Liq. Cryst. 31, 229 (2004) 18. A. Nesrullajev, News. Azerbaijan Academy Sci 41, 86 (1985) 19. A. Nesrullajev, Mesomorphism and Electrophysics of Lyotropic
Liquid Crystalline Systems, DSc Dissertation (Institute of Physics, Azerbaijan Academy of Sciences, Baku, 1992)
20. L.M. Kljukin, A. Nesrullajev, A.S. Sonin, I.N. Shibaev, Patent of the USSR, No.740212, G 01 N 25/30
21. A. Nesrullajev, S. Salihoğlu, H. Yurtseven, Intern. J. Mod. Phys. B 12, 213 (1998)
22. A. Nesrullajev, N. Avci, Mater. Chem. Phys. 131, 455 (2011) 23. B. Bilgin, Eran B, A. Nesrullajev, N. Yilmaz Canli, Mater. Chem.
Phys. 111, 555 (2008)
24. S. Yildiz, A. Nesrullajev, Physica A. 385, 24 (2007) 25. A. Nesrullajev, B. Bilgin Eran, J. Mol. Liq. 209, 25 (2015) 26. A.S. Sonin, Introduction to the physics of liquid crystals (Science
Publ, Moscow, 1983)
27. N. Kazanci, A. Nesrullajev, T. Yildiz, Balkan Phys. Lett. 8, 135 (2000)
28. I. Dierking, Textures of liquid crystals (Wiley, Weinheim, 2003) 29. P. Pardhasaradhi, P.V. Datta Prasad, D. Madhavi Latha, V.G.K.M.
Pisipati, G. Padmaja Rani, Phase Trans. 85, 1031 (2012) 30. M. Sharma, C. Kaur, J. Kumar, K. Chandramani Singh, P.C. Jain, J.
Phys.: Condens. Matter. 13, 7249 (2001)
31. G.A. Oweimreen, M.A. Morsy, Thermochim. Acta 325, 111 (1999) 32. G.A. Oweimreen, M.A. Morsy, Thermochim. Acta 346, 37 (1999) 33. S. Hosaka, K. Tozaki, H. Hayashi, H. Inaba, Physica B 337, 138
(2003)
34. A. Nesrullajev, B. Bilgin Eran, Mater. Chem. Phys. 93, 21 (2005) 35. A. Nesrullajev, Phase Trans. 83, 326 (2010)
36. H.K. Cammenga, K. Gehrich, S.M. Sarge, Thermochim. Acta 446, 36 (2006)
37. M.A. Anisimov, Mol. Cryst. Liq. Cryst. 162, 1 (1988)
38. K.W. Lee, H.C. Lee, S.H. Yang, C.E. Cha, C.E. Lee, J. Kim, Current Appl. Phys. 1, 529 (2001)
39. P.K. Mukherjee, Phys. Rev. E 71, 061704 (2005) 40. W.H. de Jeu, P. Bordewijk, J. Chem. Phys. 68, 109 (1978) 41. G. Chahine, A.N. Kityk, N. Demerest, F. Jean, K. Knorr, P. Huber,
R. Lefort, J.M. Zanotti, D. Morineau, Phys. Rev. E 81, 031703 (2010)
42. A. Nesrullajev, J. Mol. Liq. 215, 503 (2016) 43. A. Nesrullajev, Lithuanian J. Phys. 55, 24 (2015)
44. N. Avcı, A. Nesrullajev, S. Oktik, J. Optoelectr. Adv. Mater. 9, 413 (2007)
45. L. Lysetskiy, V. Panikarskaya, O. Sildetskiy, N. Kasian, S. Kositsyn, P. Shtifanyuk, N. Lebovka, M. Lisunova, O. Melezhuk, Mol. Cryst. Liq. Cryst. 478, 127 (2007)
46. S.K. Sarkar, P.C. Barman, M.K. Das, Physica B 446, 80 (2013) 47. P.G. de Gennes, The physics of liquid crystals (Clarendon Press,
Oxford, 1974)
48. S. Chandrasekhar, Liquid crystals (Cambridge University Press, Cambidge, 1994)
49. M.R. Benson, A.G. Knisely, M.A. Marciniak, M.G. Seal, A.M. Urbas, IEE Photonics J. 7, 2600613 (2015)
50. S. Visnovski, Czech. J. Phys. 36, 1424 (1986)
51. C.U. Keller, Lecture 3: Crystal Optics,home.strw.leidenuniv.nl/ ~keller/Teaching/China_2008/CUK_LO3_handout.pdf
52. M.A. Anisimov, Critical phenomena in liquids and liquid crystals (Gordon and Breach Publ, Amsterdam, 1991)
53. J.C. Toledano, P. Toledano, The landau theory of phase transitions (World Scientific, Singapore, 1987)
54. P.K. Mukherjee, J. Mol. Liq. 190, 99 (2014)
55. J.C. Toledano, P. Toledano, The Landau Theory of Phase Transitions (World Scientific, Singapore, 1987)
56. J.D. Cognard, Alignment of nematic liquid crystals and their mixtures (Gordon and Breach, London, 1982)
57. T.Y.J. Marusij, Y.A. Reznikov, Y.Y. Reshetniak, A.I. Hijniak, Interaction energy between nematic liquid crystals and surfaces (Institute of Physics of Ukrainian Academy of Sciences Publ, Kiev, Preprint No.81988), pp. 1–10
58. B. Jerome, Rep. Progr. 54, 391 (1991)
59. H. Yokoyama, in Handbook of liquid crystal research, ed by P. J. Collings, J. S. Patel. (Oxford University Press, New York, 1997), pp. 179–235
60. M.G. Tomilin, Interaction between liquid crystals with surfaces (Politechnica Publ, St.Petersburg, 2001)
61. L.M. Blinov, E.I. Katz, A.A. Sonin, Usp. Fiz. Nauk (Sov.) 152, 449 (1987)
62. A.A. Sonin, The surface physics of liquid crystals (Gordon and Breach Publ, Amsterdam, 1995)
63. A.I. Alexe-Ionescu, G. Barbero, I. Komitov, Phys. Rev. E 80, 021701 (2009)
64. A.I. Alexe-Ionescu, R. Barberi, G. Barbero, T. Beica, R. Moldovan, Z. Naturforsch. 47A, 1235 (1992)