Quantitative Phase Macroscopic System for Label-Free Imaging
of Tissue Sections
Muhammed Fatih Toy
Department of Biomedical Engineering, School of Engineering and Natural Sciences, İstanbul Medipol University, İstanbul, Turkey
Corresponding Author:
Muhammed Fatih Toy
E-mail:
Received: 25.12.2019 Accepted: 07.06.2020
Available Online Date: 10.09.2020 DOI: 10.5152/electrica.2020.19087
Cite this article as: Toy MF. Quantitative Phase Macroscopic System for Label-Free Imaging of Tissue Sections. Electrica, 2021; 21(1): 10-19. ABSTRACT
Optical microscopes are typically designed as versatile tools that are capable of imaging at various modalities with different resolutions in respective visual fields. A large extend of versatility causes increased complexity, size, and the cost. Imaging of tissue sections is a routine procedure in clinics and research laboratories. Tissue staining consumables, required time for staining along with the cost of the imaging systems are the limiting factors for widespread use. A multimode imaging system with enhanced resolution performance and automation is generally superfluous for the coarse resolution imaging of tissue sections. A dedicated system for label free tissue section imaging is presented. Label free imaging with high contrast is provided in form of quantitative phase. Earlier demonstrations of quantitative phase imaging of tissue sections utilized modified microscopes with different modalities for correlated imaging and motorized stages for field enlargement. Here, the system follows an off-axis digital holographic imaging configuration for the acquisition of quantitative phase at single shot. The system compromises from the resolution and magnification of a traditional microscope for the size of visual field, ease of use, and relative cost due to the exclusion of sample stages. A software level stitching further enlarges the effective field of view.
Keywords: Digital holographic microscopy, optical microscopy, quantitative phase imaging
Introduction
The transparent nature of samples has made microscopic imaging of cell cultures and tissue sections difficult. Traditionally biological samples are stained to enhance the sample contrast. Phase contrast methods have been employed as an alternative to staining. Traditional phase contrast methods such as Zernike phase contrast and differential interference contrast suffer from imaging artefacts and mixing of absorption and phase information. Accordingly, phase contrast methods that can decouple quantifiable phase and amplitude signals have emerged. These techniques are referred to as quantitative phase microscopy (QPM) [1]. Quantitative phase measured on a QPM system reflects the sample morphology or topography without any staining or invasive procedure on the sample [2]. Quantitative phase measurement can be obtained through transport of intensity and digital holography.
Digital holography, an interferometric quantitative phase imaging technique, has rapidly de-veloped during the last few decades [3-7]. This technique is one of the ideal imaging modalities to acquire surface topography or optical path variation. Digital holography enables the acqui-sition of complex wavefield information through the encoding of optical phase information in the intensity [3]. The complex wavefield information is embedded in a single intensity image in off-axis digital holographic approach. A typical digital camera requires an exposure time in the order of few hundred microseconds to record a digital hologram. Hence, real-time imaging becomes possible and mainly limited by the camera acquisition rates. Accordingly, temporally periodic activities can be monitored at kilohertz rate using stroboscopic illumination [8]. Such low exposure time renders off-axis digital holography robust against mechanical vibrations. Eventually, mechanical vibration isolation systems are not required for this technique. This study develops an off-axis digital holographic imaging system to image quantitative phase distribution of centimeter scale tissue sections with cellular scale resolution. Accordingly, a
cus-Content of this journal is licensed under a Creative Commons Attribution-NonCommercial 4.0 International License.
tom designed digital holographic imaging system provides low magnification, and multiple quantitative phase images from different field of views (FOVs) are stitched together. Classically, a motorized cartesian scan with adaptive focusing is utilized in microscopes for tissue section scanning [9]. For high numerical aperture imaging systems, lateral translation of the sample caus-es an axial motion sufficient to bring sample out of focus [10]. The axial motion results from the combination of mechanical tol-erances of stages, variation of the sample, substrate thicknesses, and the micrometer scale shallow depth of field of the imaging objective. A microscopy system typically has all three axes adapt-ed to have multiple FOVs stitchadapt-ed [11-13]. This methodology re-quires expensive mechanical stages and is time consuming due to the time spent in optimizing the focus.
Quantitative phase imaging has been a suitable label-free imag-ing modality for histopathology studies. Previously, digital holo-graphic microscopy (DHM) and spatial light interference micros-copy (SLIM) were considered to be usable for label-free tissue section imaging [14-18]. A group of studies employed an exter-nal DHM module on a commercial microscope, and the sample was imaged through a 10x microscope objective [14-16]. Using the commercial microscope, multimodal microscopy, including quantitative phase, ordinary brightfield, and fluorescence chan-nels became feasible in these studies. Similar to the DHM, SLIM imaging was implemented on commercial microscope systems [17-18]. Hence, benefits from multimodal imaging capability were obtained. Furthermore, quantitative phase imaging on a centimeter scale was demonstrated using motorized stages and image stitching [17]. Here, the use of microscope objectives and motorized stages are not required as the application requires rel-atively low resolution. Thus, the imaging system has lower cost when compared with the motorized microscopes. The proposed imaging system cannot offer the capabilities and the flexibility of a motorized quantitative phase microscopy system. However, it can be a well-suited substitute where subcellular scale resolu-tion is not required. Addiresolu-tionally, the employed image stitching technique exploits the overlaps of the FOVs. In this approach, sample may be randomly positioned. Eventually, the lateral po-sitioning can be achieved through hand precision without any mechanical stage. This situation simplifies the mechanical setup and offloads the complexity to a computational perspective. A commercially available photographic panorama stitching soft-ware is employed for stitching randomly positioned overlapped phase images.
Digital Holography: Recording and Reconstruction In digital holography, an object’s complex wavefield informa-tion is embedded into intensity through interference with a known reference wavefield [4]. A typical reference wavefield carries constant amplitude and phase for simplicity. An inter-ferometer (e.g., Michelson interinter-ferometer, Mach–Zehnder in-terferometer) splits a coherent radiation into two arms [3]. One arm interacts with the object of interest, and the other arm propagates with no alteration. The two arms are recombined to form an interference pattern. This interference pattern is
formed with a slight tilt angle of the reference arm in off-axis holography. The yielding fringe pattern eliminates twin-image problem in single-shot imaging. A digital camera records the interference pattern. Multiple optical elements between the object and the camera may exist for magnification, demagnifi-cation, image relaying or resolution optimization.
The resulting interference pattern recorded on the camera is analytically expressed as given in Equation 1 [2]. In this equa-tion, the interference pattern (hologram intensity on camera), IH, is expressed as the coherent superposition of object wave and reference wave. Amplitude of the object wave, AO and phase of the object wave, φO have independently spatially varying values. Ideally, a reference wave is a tilted plane wave. Hence, the amplitude of the reference wave, AR, is expected to be spatially uniform and the phase of the reference wave, φR, monotonically increases on one axis.
(1) Quantitative phase information of the object is a function of surface topography for reflective samples. Optical density (ax-ial integration of refractive index) of the sample defines phase retardation for transparent samples. The relation among the transparent sample’s refractive index (n1), thickness (h), and phase retardation is expressed in Equation 2 [19].
(2) In the equation, n0 denotes the refractive index of the homog-enous medium in which the sample is present. l denotes the wavelength of the illumination light. Local variation of the re-fractive index due to different subcellular compartments, cell types, or the concentration of protein is directly reflected on the sample’s phase retardation. Hence, the phase reflects quan-tifiable and high contrast information about the sample mor-phology [2].
A Fourier filtering methodology may be employed to extract the complex field information related to the object in an ideal config-uration where the off-axis angle is sufficient to avoid the aliasing of the intensity terms with the cosine term in Equation 1 [20]. The extracted complex field contains the amplitude and phase distri-bution on the camera plane. Existence of the full complex field enables numerous digital operations. If the complex field is out of focus on the camera plane, numerical complex propagation through Fresnel transformation or angular spectrum approach enables digital refocusing [6, 7, 21-24]. Numerical propagation enables the tracking of the objects in 3D [25] or axial focus [26, 27]. In addition, optical aberration of the imaging system can be characterized [28] and compensated [29, 30].
Experimental Setup
Experimental setup is constructed in the form of a Mach– Zehnder interferometer. Figure 1 illustrates a simplified draw-ing of the optical setup. A laser diode with a center wavelength of 637 nm is used as the coherent light source in this
interfer-ometer. This laser diode is represented by a yellow rectangle, abbreviated as “LD” in Figure 1. Solid red shapes in this figure represent the path of the laser light. An aspheric lens collimates the coherent illumination. The collimated light is spatially fil-tered using a focusing lens and a pinhole. The spatially filfil-tered light is recollimated using an aspheric lens. “CoL” element in Figure 1 represents this aspheric lens. The collimated light is di-vided into two arms using a non-polarizing beam splitter. One of the arms that passes through an unknown object is named as the object arm, and the other arm is named as the reference arm. In Figure 1, the square outline with the diagonal line in-dicating the beam splitting orientation represents the beam splitter, indicated as “BS.” The horizontal beam exiting this beam splitter represents the reference arm, and the vertical beam acts as the object arm.
In an interferometer, path lengths of the interferometer arms are required to be balanced when a short temporal coherence light source is employed. Accordingly, an optical delay line is in-tegrated into the object arm of the experimental setup. A knife edge mirror (“KeM”) is paired with a right-angle prism (“RaP”) to adjust the optical path length in the object arm. After the integration of the optical delay line, the object beam passes through the sample to be imaged. The image is formed on a monochrome digital camera using a 4f imaging system. The first lens of the 4f imaging system (“OL” in Figure 1) acts like an objective lens in an infinity conjugate microscope. An achro-matic doublet lens with a focal length of 100 mm and a diam-eter of 25 mm is employed as the objective lens. Between the
lenses of the 4f system, there exists a beam splitter that partial-ly reflects the object arm to the horizontal axis and recombines it with the reference arm. Second lens of the 4f system named as tube lens (“TuL”) following the naming convention in optical microscopy is positioned on the horizontal axis in Figure 1. The tube lens in the optical setup has a focal length of 150 mm and the same diameter as that of the objective lens.
On the reference arm of the interferometer, two separate di-electric mirrors exist to redirect the beam from the horizontal to vertical axis and then to the horizontal axis as in Figure 1. An optional refractive telescope for beam size magnification rests between these two mirrors. After the second mirror, a lens is employed as the reference lens (“RL”) that ensures phase cur-vature matching with the object arm. A plano convex lens with a focal length of 100 mm is employed here. The beam from the object arm impinges on the tube lens with their centers coin-ciding. Meanwhile, the reference beam hits on the tube lens off centered. This situation yields in to off-axis propagation on the other side of the tube lens. The camera registers the in-focus image of the sample that is interfered with the reference beam in the form of an off-axis hologram.
Focal lengths and diameters of the objective lens and tube lens are chosen to maintain a magnification and resolution at cellu-lar scale for tissue section imaging. The employed digital cam-era has a Sony ICX285AL sensor, with a pixel size of 6.45 mm and an array size of 1392 × 1040 pixels. The objective and the tube lens pair provide a theoretical magnification magnitude of 1.5x for a hologram size of 1024 × 1024 pixels. The resulting FOV size of approximately 4.4 mm × 4.4 mm is sufficiently big for a manual positioning of the sample without any mechani-cal stages. Considering the theoretimechani-cal magnification, the sam-pling limited resolution of the system is calculated to be 17.2 mm. The imaging performance of an ideal system can be either limited by the sampling or the diffraction limit. Here, the calcu-lated sampling limit is well above the coherent Rayleigh resolu-tion limit of the objective lens at approximately 4.2 mm. Hence, the theoretical resolution of the system is concluded to be 17.2 mm, with a sufficiently large room for optical aberrations. The mechanical setup of the system is based on the optical elements mentioned previously. The mechanical design of the system is based on the optical layout provided in Figure 1. Initially, the mechanical setup is designed in a computer-aid-ed design software, focusing on the critical parameters of the optical elements. Figure 2.a presents the final design of the experimental setup. The actual experimental setup is realized by following this design. Figure 2.b illustrates a photo of the final experimental setup. The constructed system is transport-able and does not require extra vibration isolation other than the rubber feet visible on the photo. The final system costs ap-proximately €6000. The Appendix section provides a detailed list of all materials with their costs. The total cost of the system is comparable to the cost of motorized microscope stages and objectives combined together. To conclude, the cost is close to that of half of a comparably robust custom built QPM system
Figure 1. Schematic presentation of the optical system in the
form of a Mach–Zehnder interferometer. “LD” denotes the laser di-ode, and laser beam is shown in red color. “PA” represents a pinhole aperture. “CoL” denotes the collimation lens. Beam splitters are in-dicated by “BS.” “M” denotes a mirror. “TL1” and “TL2” are telescope lenses. Knife edge mirror and right-angle prism are labelled as “KeM” and “RaP” in order. “OL”, “RL,” and “TuL” denote objective lens, reference lens, and tube lens in respective order
with motorized stages. The cost advantage is more evident when compared with the commercial DHM systems having prices higher than $15000.
Results
After the alignment of the constructed experimental setup, the imaging performance is experimentally evaluated. A pos-itive 1951 USAF resolution test target (57-896) (Edmund Optics Inc., Barrington, NJ, USA) is used as a sample and imaged in the setup. Figure 3.a presents the acquired digital hologram of this resolution test target. Figure 3.b presents spatial frequen-cy spectrum of this hologram in logarithmic scale. Referring back to Equation 1, intensity terms are populated around the 0th diffraction order at the center. The cross-correlation terms
are located around 1st and −1st diffraction orders diagonally
ori-ented. The tilt angle of the reference arm beam mentioned in the earlier section is adjusted to maintain this orientation to
maximize non-aliasing band size for the diffraction orders. As mentioned earlier, Fourier filtering is utilized at this step to re-cover the sample’s complex field. Outline of the Fourier filter is indicated by a red dashed circle in Figure 3.b. The recovered complex field contains the amplitude and phase distribution associated with the sample. The phase distribution additionally contains a monotonically increasing phase due to the tilt an-gle of the reference arm beam. One may choose to shift the center of the filtered spatial frequency spectrum to the
ze-Figure 2. a, b. (a) Mechanical design of the experimental imaging
system, (b) A photo of the constructed imaging system
a
b
Figure 3. a, b. (a) An off-axis hologram of USAF-1951 resolution
test target acquired by the system, (b) Log scale of the Fourier transform of the hologram indicated in Figure 3.a. Dotted red cir-cle represents the border of the Fourier filter to be used
a
ro-frequency position of the support with subpixel precision to eliminate this monotonically increasing part. Alternatively, recovered complex spectrum is divided into an ideal reference spectrum in spatial domain. The second method is chosen due to the numerical ease of calculation. The recovered amplitude and phase distributions are presented in panels Figure 4.a and Figure 4.b, respectively.
The length of an element (Group 2 element 1) indicated by the red dotted line in Figure 4.a is measured to evaluate the magni-fication of the system. The profile is provided in Figure 4.c. This measurement yields to a magnification of approximately 1.49x. This value is in agreement with the theoretical expectation of 1.5x. Additionally, minimum resolvable features are inspected to evaluate the resolution. Group 5 element 6 in the test target is observable as the narrowest feature. The period of this ele-ment is 17.5 mm. This experiele-mental resolution performance is also in agreement with the theoretical expectation of 17.2 mm. In Figure 5.a, a zoomed in region from Figure 4.a is provided. This region is centered around group 5 element 6. Horizontal and vertical profiles from this element are also provided in pan-els Figure 5.b and Figure 5.c. These profiles clearly indicate that the features of interest are resolvable.
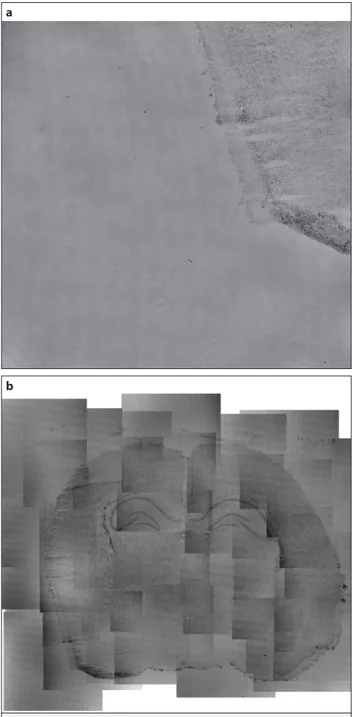
After the performance evaluation, the next sample of inter-est is a thin tissue section. A mouse brain tissue section with a thickness of 18 mm is imaged for the proof of principle. The acquired hologram is processed by following the aforemen-tioned approach, and the resulting quantitative phase image is reconstructed. Phase images are saved without compression, with a pixel depth of 8 bits and a resulting individual file size of 1 MB. A quantitative phase image from the lower left corner of this tissue section is provided in Figure 6.a. Thereafter, the sam-ple is translated by hand without any mechanical stage, and 39 holograms are acquired at a rate of approximately 1 hologram per second. The total time taken to scan the sample is below 40 seconds. With the large depth of field of the imaging sys-tem, sample always stays in focus during this translation. Inde-pendently reconstructed quantitative phase images are man-ually aligned to cover the entire surface of the tissue section. Figure 6.b presents the result of this manual stitching. Despite the ease of use and cost effectiveness of the experimental sys-tem, this manual alignment stage is time consuming and the results indicate artefacts due to the unbalanced background phase levels. Two separate methods are followed to automate this step. In the first method, a stitching algorithm implementa-tion in MATLAB is utilized. This algorithm automatically stitches all the images present in a folder. The algorithm first extracts the features and estimates the transformation parameters be-tween the consecutive images. The transformation estimation is constrained to extract the affine transformation parameters of the consecutive images. Relative to the center image, all the remaining images are stitched together. The stitching result may express abrupt changes at the borders of images. Gra-dient mask blending is employed to suppress these stitching artifacts. Furthermore, 10 holograms from overlapping regions of a positive 1951 USAF resolution test target are acquired and
Figure 4. a-c. (a) Reconstructed amplitude image of the
holo-gram given in Figure 3.a, (b) Reconstructed quantitative image of the hologram given in Figure 3.a (Phase values are in radians), (c) A line profile from the amplitude image on Figure 4.a is indicated by the red dotted line. The profile is taken from the image of group 2 element 1 length, and it shows a length of 144.29 pixels
b
a
stitched using this method. Figure 7 presents the results. In panels Figure 7.a and Figure7.b stitching outputs for amplitude and quantitative phase are presented, with the borders of vidual images accented. Panels Figure 7.c and Figure 7.d indi-cate the final outputs for the amplitude and quantitative phase. In the second method, a commercially available photo editing software (Adobe Photoshop CC) (Adobe Inc, San Jose, CA, USA) with panorama stitching feature is used to stitch the individual quantitative phase images of the mouse brain tissue section. This software applies affine transformation on automatically
Figure 5. a-c. (a) A zoomed-in region from the amplitude image
in Figure 4.a that is centered around group 5 element 6 of USAF-1951 resolution test target, (b) Horizontal profile from Figure 5.a on the red dotted line. The profile shows that horizontal resolution limit is in the order of the element size., (c) Vertical profile from Figure 5.a on the blue dotted line. The profile shows that vertical resolution limit is in the order of the element size
b
a
c
Figure 6. a, b. (a) A quantitative phase image from the lower left
corner of mouse brain tissue section, (b) Manually aligned and stitched quantitative phase images of mouse brain tissue section that covers the entire surface
a
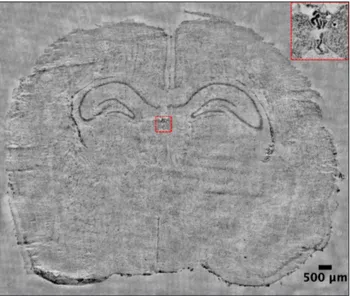
matched features and balances the background values. Figure 8 presents the final stitched quantitative phase image. This re-sulting image represents the stitching of 39 quantitative phase images acquired from randomly overlapping FOVs. The final image spans to an object space FOV of 13.41 mm × 11.28 mm, with a file size of approximately 7.7 MB. This final FOV size is essentially defined by the area of the union of the individual acquisitions. Thus, the final FOV is scalable to a larger size if the sample spans to a wider region.
Conclusion
Quantitative phase imaging enables the morphological imag-ing of samples without labelimag-ing. DHM is one of the
experimen-tal techniques to acquire complex field and quantitative phase images. An off-axis digital holographic macroscopic imaging system is presented for the imaging of biological samples on a centimeter scale with cellular scale resolution. The presented system relies on a relative low-cost configuration without spe-cial microscope objectives or sample positioning stages. The system has an imaging performance with an approximate 1.5x magnification and 17.5 mm resolution in a FOV of 4.4 mm × 4.4 mm. Multiple quantitative phase images acquired from ran-dom overlapping FOVs are acquired by repositioning the sam-ple by crude hand accuracy. A widely used and commercially available panorama image stitching methodology constructs a quantitative phase image of the entire scanned area.
Exper-Figure 7. a-d. (a) MATLAB-based automated stitching output of amplitude images covering the central region of a positive USAF-1951
res-olution test target. Boundaries of the individual images are outlined. (Amplitude values in arbitrary units are mapped to grayscale levels.), (b) MATLAB-based automated stitching output of quantitative phase images covering the central region of a positive USAF-1951 resolution test target. Boundaries of the individual images are outlined. (Phase values in 2π radians are mapped to grayscale levels.), (c) Final stitching output of amplitude images of USAF-1951 resolution test target. (Amplitude values in arbitrary units are mapped to grayscale levels.), (d) Final stitch-ing output of quantitative phase images of USAF-1951 resolution test target. (Phase values in 2π radians are mapped to grayscale levels.)
a
c
b
imental results demonstrate that this stitching methodology enlarges the effective field to 13.41 mm × 11.28 mm for the imaged tissue section.
Peer-review: Externally peer-reviewed.
Conflict of Interest: The author has no conflicts of interest to declare. Financial Disclosure: The author declared that this study was
support-ed by the Scientific and Technological Research Council of Turkey (TU-BITAK) (BIDEB 2232 Scholarship, Project No. 115C067).
References
1. Y. Park, C. Depeursinge, G. Popescu, “Quantitative phase imaging in biomedicine”, Nature Photonics, vol. 12, no. 10, pp. 578-589, September, 2018. [CrossRef]
2. B. Kemper, G. von Bally, “Digital holographic microscopy for live cell applications and technical inspection”, Applied Optics, vol. 47, no. 4, pp. A52-A61, February, 2008. [CrossRef]
3. K. M. Kim, “Principles and techniques of digital holographic microscopy”, SPIE reviews, vol. 1, no. 1, p.018005, April, 2010.
[CrossRef]
4. U. Schnars, W. Jüptner, “Direct recording of holograms by a ccd target and numerical reconstruction”, Applied Optics, vol. 33, no. 2, pp. 179-181, January, 1994. [CrossRef]
5. E. Cuche, F. Bevilacqua, C. Depeursinge, “Digital holography for quantitative phase-contrast imaging”, Optics Letters, vol. 24, no. 5, pp. 291-293, March, 1999. [CrossRef]
6. E. Cuche, P. Marquet, C. Depeursinge, “Simultaneous ampli-tude-contrast and quantitative phase-contrast microscopy by numerical reconstruction of Fresnel off-axis holograms”, Applied Optics vol. 38, no. 34, pp. 6994-7001, December, 1999. [CrossRef]
7. U. Schnars, W. Juptner, “Digital recording and numerical recon-struction of holograms”, Measurement Science and Technology, vol. 13, no. 9, pp. R85-R101, August, 2002. [CrossRef]
8. F. Montfort, Y. Emery, F. Marquet, E. Cuche, N. Aspert, E. Solanas, A. Mehdaoui, A. Ionescu, C. Depeursinge, “Process engineering and failure analysis of MEMS and MOEMS by Digital Holography Mi-croscopy (DHM)”, in Reliability, Packaging, Testing, and Character-ization of MEMS/MOEMS VI, Proceedings of SPIE 6463, San Jose, January, 2007, pp. 64630G-1 - 64630G-7. [CrossRef]
9. D. A. Silage, J. Gil, “Digital image tiles: a method for the processing of large sections”, Journal of Microscopy. vol. 138, no. 2, pp. 221-227, May,1985. [CrossRef]
10. M. C. Montalto, R. R. McKay, R. J. Filkins, “Autofocus methods of whole slide imaging systems and the introduction of a sec-ond-generation independent dual sensor scanning meth-od”, Journal of Pathology Informatics, vol. 2, 2011. [CrossRef]
11. M. G. Rojo, G. B. García, C. P. Mateos, J. G. García, M. C. Vicente, “Crit-ical comparison of 31 commercially available digital slide systems in pathology”, International Journal of Surgical Pathology, vol. 14, no. 4, pp. 285-305, October, 2006. [CrossRef]
12. G. Bueno, O. Déniz, M. D. M. Fernández‐Carrobles, N. Vállez, J. Sa-lido, “An automated system for whole microscopic image acquisi-tion and analysis”, Microscopy Research and Technique, vol. 77, no. 9, pp. 697-713, September, 2014. [CrossRef]
13. J. Liao, Y. Jiang, Z. Bian, B. Mahrou, A. Nambiar, A. W. Magsam, K. Guo, S. Wang, Y. ku Cho, G. Zheng, “Rapid focus map surveying for whole slide imaging with continuous sample motion”, Op-tics Letters, vol. 42, no. 17, pp. 3379-3382, September, 2017.
[CrossRef]
14. P. Lenz, D. Bettenworth, P. Krausewitz, M. Brückner, S. Ketelhut, G. von Bally, D. Domagk, B. Kemper, “Digital holographic micros-copy quantifies the degree of inflammation in experimental coli-tis”, Integrative Biology, vol. 5, no. 3, pp. 624-630, March, 2013.
[CrossRef]
15. D. Bettenworth, A. Bokemeyer, C. Poremba, N. S. Ding, S. Ketelhut, P. Lenz, B. Kemper, “Quantitative phase microscopy for evaluation of intestinal inflammation and wound healing utilizing label-free biophysical markers”, Histol. Histopathol, vol. 33, pp. 417-432, May, 2018.
16. A. Bokemeyer, P. R. Tepasse, L. Quill, P. Lenz, E. Rijcken, M. Vieth, N. Ding, S. Ketelhut, F. Rieder, B. Kemper, D. Bettenworth, “Quantita-tive phase imaging Using Digital Holographic Microscopy Reliably Assesses Morphology and Reflects Elastic Properties of fibrotic in-testinal tissue”, Scientific Reports, vol. 9, no. 1, pp. 1-11, December, 2019. [CrossRef]
17. Z. Wang, G. Popescu, K. V. Tangella, A. Balla, “Tissue refractive index as marker of disease”, Journal of Biomedical Optics, vol. 16, no. 11, p.116017, November, 2011. [CrossRef]
18. M. Takabayashi, H. Majeed, A. Kajdacsy-Balla, G. Popescu, “Disor-der strength measured by quantitative phase imaging as intrin-sic cancer marker in fixed tissue biopsies”, PloS one, vol. 13, no. 3, March, 2018. [CrossRef]
19. P. Marquet, B. Rappaz, P. J. Magistretti, E. Cuche, Y. Emery, T. Co-lomb, C. Depeursinge, “Digital holographic microscopy: a nonin-vasive contrast imaging technique allowing quantitative visual-ization of living cells with subwavelength axial accuracy”, Optics Letters, vol. 30, no. 5, pp.468-470, March, 2005. [CrossRef]
20. E. Cuche, P. Marquet, C. Depeursinge, “Spatial filtering for zero-or-der and twin-image elimination in digital off-axis holography”, Applied Optics, vol. 39, no. 23, pp. 4070-4075, August, 2000.
[CrossRef] Figure 8. Automated stitching output of quantitative phase
im-ages covering the entire mouse brain tissue section. The result-ing image corresponds to a region of 13.41 mm × 11.28 mm on sample. A region with cellular scale details is labelled with the red dashed box at the center. This region is zoomed in and shown on the upper right corner. (Phase values in 2π/3 radians are mapped to grayscale levels, with a black pixel representing relative phase of 0 and white pixel corresponding to the phase of 2π/3.)
21. S. de Nicola, A. Finizio, G. Pierattini, P. Ferraro, D. Alfieri, “Angular spectrum method with correction of anamorphism for numerical reconstruction of digital holograms on tilted planes”, Optics Ex-press, vol. 13, no. 24, pp. 9935-9940, November, 2005. [CrossRef]
22. L. Yu, M. Kim, “Pixel resolution control in numerical reconstruction of digital holography”, Optics Letters, vol. 31, no. 7, pp. 897-899, April, 2006. [CrossRef]
23. T. Colomb, F. Montfort, C. Depeursinge, “Small reconstruction dis-tance in convolution formalism,” in Digital Holography and Three-Di-mensional Imaging, St. Petersburg, FL, March, 2008. [CrossRef]
24. D. Wang, J. Zhao, F. Zhang, G. Pedrini, W. Osten, “High-fidelity nu-merical realization of multiple-step Fresnel propagation for the reconstruction of digital holograms”, Applied Optics, vol. 47, no. 19, pp. D12-D20, July, 2008. [CrossRef]
25. P. Langehanenberg, L. Ivanova, S. Ketelhut, D. Dirksen, G. Geor-giev, G. von Bally, I. Bernhardt, “Automated three-dimensional tracking of living cells by digital holographic microscopy”, Journal of Biomedical Optics, vol. 14, no. 1, pp. 014018-1 – 014018-7, Jan-uary-February, 2009. [CrossRef]
26. P. Langehanenberg, B. Kemper, D. Dirksen, G. von Bally, “Autofo-cusing in digital holographic phase contrast microscopy on pure
phase objects for live cell imaging”, Applied Optics, vol. 47, no. 19, pp. D176-D182, July, 2008. [CrossRef]
27. M. F. Toy, J. Kühn, S. Richard, J. Parent, M. Egli, C. Depeursinge, “Ac-celerated autofocusing of off-axis holograms using critical sam-pling”, Optics Letters, vol. 37, no. 24, pp. 5094-5096, December, 2012. [CrossRef]
28. F. Charrière, J. Kühn, T. Colomb, F. Montfort, E. Cuche, Y. Emery, K. Weible, P. Marquet, C. Depeursinge, “Characterization of micro-lenses by digital holographic microscopy”, Applied Optics, vol. 45, no. 5, pp. 829-835, February, 2006. [CrossRef]
29. P. Ferraro, S. De Nicola, A. Finizio, G. Coppola, S. Grilli, C. Magro, G. Pierattini, “Compensation of the inherent wave front curva-ture in digital holographic coherent microscopy for quantitative phase-contrast imaging”, Applied Optics, vol. 42, no. 11, pp. 1938-1946, April, 2003. [CrossRef]
30. T. Colomb, E. Cuche, F. Charrière, J. Kühn, N. Aspert, F. Montfort, P. Marquet, C. Depeursinge, “Automatic procedure for aberration compensation in digital holographic microscopy and applications to specimen shape compensation”, Applied Optics, vol. 45, no. 5, pp. 851-863, February, 2006. [CrossRef]
M. Fatih Toy is an assistant professor of Biomedical Engineering at İstanbul Medipol University, Turkey. He received his bachelor's and master’s degrees in Electrical and Electronics Engineering from Koç University, Turkey in 2006 and 2008 respectively. He received his PhD in Photonics degree from École Polytechnique Fédérale de Lausanne (EPFL), Switzerland in 2013. Subsequently he took role in the establishment of the start-up company Nanolive SA where he serves as a technical advisor.
His research interests are coherent imaging, digital holography, superresolution microscopy, and near to eye displays.
Appendix
The bill of materials of all elements used to construct the system is provided below. The cost of each element is taken from the manufacturer’s website.
* This camera is an obsolete product. An alternative on the following line is used for the cost calculation.
Product Model Manufacturer Unit Price (€) Count Total Price (€)
MB3060/M Thorlabs 255.56 1 255.56 MB6060/M Thorlabs 475.43 1 475.43 VB01/M Thorlabs 90 2 180 AV2/M Thorlabs 22.13 1 22.13 HL63101MG Oclaro 12.98 1 12.98 LD1255-CAB Thorlabs 17.03 1 17.03 LD1255P Thorlabs 24.3 1 24.3 LD1255R Thorlabs 149.51 1 149.51 PS-12DC-EU Thorlabs 77.46 1 77.46 SR9C Thorlabs 49.19 1 49.19 LDH56-P2/M Thorlabs 109.19 1 109.19 A110TM-A Thorlabs 81.89 1 81.89 A260TM-A Thorlabs 81.89 1 81.89 SM1Z Thorlabs 186.89 1 186.89 P15S Thorlabs 71.85 1 71.85 ST1XY-A/M Thorlabs 330.5 1 330.5 AL2550M-A Thorlabs 250.83 1 250.83 SPT1/M Thorlabs 60.49 1 60.49 CM1-BS013/M Thorlabs 269.52 1 269.52 MRAK25-G01 Thorlabs 120.99 1 120.99 LCPM/M Thorlabs 89.27 1 89.27 PM4/M Thorlabs 22.13 2 44.26 PS911 Thorlabs 53.61 1 53.61 MT1/M Thorlabs 287.23 1 287.23 RC1 Thorlabs 24.49 2 48.98 RLA150/M Thorlabs 41.56 1 41.56 RS38/M Thorlabs 21.15 2 42.3 AC254-100-A-ML Thorlabs 96.4 1 96.4 CP02/M Thorlabs 15.35 5 76.75 BS016 Thorlabs 178.04 1 178.04