DOI: 10.1007/s00339-006-3817-4 Materials Science & Processing
k. aydinu e. ozbay
Left-handed metamaterial based superlens
for subwavelength imaging
of electromagnetic waves
Nanotechnology Research Center, Department of Physics,Department of Electrical and Electronics Engineering, Bilkent, 06800 Ankara, Turkey
Received: 21 August 2006/Accepted: 15 November 2006 Published online: 27 January 2007 • © Springer-Verlag 2007 ABSTRACTLenses made of negative index materials have the ability to focus the propagating and evanescent components of electromagnetic waves. Such a possibility enables super reso-lution, in turn resulting in sharper, subwavelength size images. In this present work, we present subwavelength imaging that was obtained from a one-dimensional left-handed metamaterial (LHM) composed of alternating layers of split-ring resonators and thin wires. We investigated the effect of the thickness of LHM lenses on image size. The left-handed pass band within the negative permittivity and permeability region is shown ex-perimentally and theoretically for different thicknesses of LHM slabs. We also studied the transmission-phase of LHMs with a different number of unit cells along the propagation direc-tion. The phase decreases with the increasing thicknesses of LHM slabs, proving that the phase velocity is negative in the left-handed transmission band.
PACS42.25.-p; 41.20.Jb; 81.05.-t
1 Introduction
In recent years, left-handed metamaterials (LHMs) have become a remarkable research area and have received a considerable amount of interest due to their exotic elec-tromagnetic properties that are not attainable from common materials [1–13]. Approximately four decades ago, Veselago predicted that a medium with simultaneous negative permit-tivity and negative permeability would exhibit unusual physi-cal properties; among them are negative refraction, reversal of Doppler shift, and backward Cerenkov radiation [1]. In such media, the electric, magnetic, and wave vector components form a left-handed (LH) coordinate system, hence the name left-handed material is used for the description. Permittivity (ε) and permeability (µ) are generally positive in ordinary ma-terials. However, negative values ofε and µ can be obtained by artificially constructed composite metamaterials. As an ex-ample, metallic thin wire grids have been shown to exhibit a plasma frequency in the microwave regime, below which the effective permittivity is negative [2]. On the other hand, u Fax: +90-312-290-1015, E-mail: [email protected]
a split-ring resonator (SRR) structure could haveµ(ω) < 0 near the magnetic resonance frequency [3].
The experimental realization of left-handed metamateri-als (LHM) was achieved by arrangingε(ω) < 0 media and µ(ω) < 0 media as periodic arrays [4–6]. The experimen-tal verification of negative refraction was then reported by several researchers with different methods, supporting the existence of neff< 0 medium [7–11]. LHMs not only have negative values of a refractive index for a certain frequency range, but also exhibit negative phase velocity [11, 12]. Be-sides these interesting novel physical phenomena emerging from left-handed metamaterials, one of the most important impacts of these exciting structures are that they can enable imaging structures that have features smaller than a wave-length [14]. Negative refraction and subwavewave-length imaging can also be achieved by photonic crystals (PC) where the band structure led to negative dispersion for EM waves [15, 16]. In such structures the effective parameters are positive; there-fore, an effective index of refraction could not be assigned.
Materials with a positive refractive index always require curved surfaces to focus EM waves. However, a parallel-sided slab lens constructed from a negative index material could bring EM waves into focus [1, 14]. Such lenses are also called flat lenses, since their surfaces are not curved. Negative in-dex materials can restore the amplitude of evanescent waves and therefore enable subwavelength focusing [14]. Subwave-length imaging effect is demonstrated for photonic crystal structures [16] and left-handed transmission-line lenses at the frequency regions where the refractive index is negative [17]. Imaging properties of negative index superlenses have been investigated theoretically by several researchers [18–21]. Re-cently, flat lens behavior in LHM structures employing com-monly used SRR-wire geometry are reported [22]. Most of the experimental studies are performed in the microwave fre-quency regime, but recently subwavelength imaging at optical frequencies have been successfully shown [23].
In this present paper, we present an experimental demon-stration of subwavelength imaging for different thicknesses of LHM superlenses. Experimental and theoretical results are provided for left-handed transmission properties and negative phase velocity within the frequency range where permittivity and permeability of composite metamaterials are simultan-eously negative.
2 Left-handed transmission band
The left-handed material studied in this work con-sists of the periodic arrangement of SRR and thin wire arrays. SRR and wire patterns are fabricated on the front and back sides of FR4 printed circuit boards. An SRR array with five unit cells along the propagation direction is shown in Fig. 1a, in which a five-layer wire array is shown in Fig. 1b. The metal used for deposition is copper with a thickness of 30µm. The geometrical parameters of a single SRR unit cell can be found in our previous work [5]. The length and width of the con-tinuous thin wire structures are l= 19 cm, and w = 0.9 mm, respectively. The LHM sample is composed of Ny= 15, and Nz= 32 unit cells, with lattice spacings ax= ay= 8.8 mm and az= 6.5 mm. We used three different LHM samples where the number of unit cells along the propagation direction are Nx= 5, 7 and 10.
Experimental setup for measuring the transmission-amplitude and transmission-phase spectra consists of a HP 8510C network analyzer, and standard high gain microwave horn antennas. Illustration of the experimental setup is shown in Fig. 2 with solid lines. The LHM structures are inserted be-tween the transmitter and receiver horn antennas. The incident EM wave propagates along the x direction, while E is along the y direction, and H is along the z direction (refer to Fig. 1 for the directions).
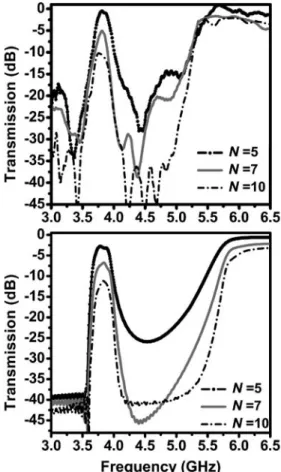
Figure 3a depicts the measured transmission spectra of a 1D LHM structures with Nx= 5, 7, and 10. The effect-ive ε and µ for this composite structure are negative be-tween the frequencies 3.55–4.05 GHz [5]. Figure 3a clearly shows that left-handed transmission bands are observed at
FIGURE 1 Photographs of a single (a) split-ring resonator array, and (b) thin wire array with 5 unit cells along the propagation direction (x-axis)
FIGURE 2 Schematic drawing of a transmission measurement setup indi-cated by solid lines. The dashed lines connecting the monopole antennas to the network analyzer is the schematic of the scanning setup
FIGURE 3 The transmission spectra of the Nx= 5, 7, and 10 layers of
LHM structures: (a) experiments; (b) simulations
this specific frequency range for three LHM samples. The transmission peaks are measured to be−0.8 dB, −5.0 dB, and −10.2 dB for LHMs with 5, 7, and 10 unit cells along the x-direction, respectively. We performed numerical simula-tions to check the validity of the experimental results. Sim-ulations are performed by using a commercial 3D full-wave solver that is capable of calculating transmission-amplitude and transmission-phase spectra. The solver employs the finite integration technique (FIT) to perform the simulations. Nu-merical simulations predict the left-handed transmission band
for 5, 7, and 10 layers of LHMs with peak values−2.7 dB, −6.8 dB, and −11.2 dB, correspondingly (see Fig. 3b). Ex-pectedly, as the number of layers along the propagation direc-tion increased, the transmission within the left-handed trans-mission band decreased.
3 Negative phase shift and negative refractive index
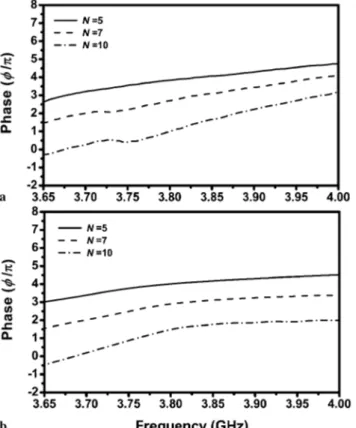
In left-handed metamaterial slabs, the phase vel-ocity points back toward the source, meaning that the phase velocity and energy flow are anti-parallel inside a LHM slab [12]. Negative phase velocity is experimentally veri-fied by measuring EM wave fields inside LHM slabs [12] and by measuring a phase shift from differing number of layers along propagation direction [11]. The latter study is performed for two-dimensional LHM structures. Here, we present the experimental results for a one-dimensional slab together with the numerical simulations. While meas-uring the transmission-amplitude of LHM slabs, a net-work analyzer also measures the transmission-phase. The transmission-phase spectra data are unwrapped and plotted as shown in Fig. 4a. The frequency range is 3.65–4.00 GHz, which is within the LH transmission region. Since the transmission reduces at the band edges, the phase infor-mation throughout the entire LH region is not provided. When the transmission is low, the measured transmission-phase becomes incorrect. However, for the 5, 7, and 10 layers of the LHM slabs, we observed significantly high transmission in order to sufficiently perform reliable phase measurements.
FIGURE 4 The transmission phase of the Nx= 5, 7, and 10 layers of LHM
structures: (a) experiments; (b) simulations
As is clearly seen in Fig. 4a, increasing the number of layers of LHM decreases the phase of the transmitted EM wave. However, if the material possesses a positive refractive index, one would observe an increase in the transmitted phase with the increasing number of unit cells [11]. The simula-tion results are provided in Fig. 4b and are in good agreement with the experimental observations. The phase shift data ob-tained from the experimental results [11] and numerical sim-ulations [24] are employed to calculate refractive indices of negative index metamaterials in the literature. Here, we fol-low the formulation given in [13] to calculate the refractive index of 1D LHM structures. The index of refraction in terms of wavelength, phase shift, and change in the length of LHM is given by:
n= ∆ϕ ∆L
λ
2π. (1)
At f= 3.75 GHz, the wavelength of the EM wave is λ = 8 cm. The average phase shift per unit cell (∆L = 8.8 mm) obtained from the experimental results is∆Φ = −0.64 ± 0.04π. In-serting these values in (1), index of refraction at 3.75 GHz is found to be neff= −2.90 ± 0.18. The average phase shift and calculated refractive index for the numerical simulations at 3.75 GHz are ∆Φ = −0.59 ± 0.04π, and neff= −2.68 ± 0.18. The experimental results and numerical simulations are in good agreement.
4 Subwavelength imaging
Negative index metamaterials (NIM) behave dif-ferently from positive index materials for lensing applica-tions. As was pointed out by Veselago, a rectangular slab lens of NIM could focus light. However, ordinary materi-als that have positive indices of refraction always required a curved surface to bring light into focus [1]. Interestingly, the presence of negative refraction enables the focusing of EM waves by overcoming the diffraction limit. Negative in-dex materials can recover the evanescent modes in an image, which is not possible for a positive index material. These decaying modes carry information about the near-field of the image. Evanescent modes are amplified at the surface of the LHM lens, in which these modes decay in free space. Evidently, the near-field information will be lost. It is well known that losses affect the resolution power of a superlens and impose a significant resolution limitation [18–20]. We have chosen a specific frequency f = 3.75 GHz for imag-ing experiments, where the lowest reflection is observed with a dip value of−40 dB (data not shown here) [25]. Al-though the losses due to absorption are still present, we can at least ensure that the losses due to reflection are kept to a minimum.
In Sects. 2 and 3, we successfully showed the left-handed transmission and negative phase velocity of the 1D LHM slab. Therefore, we can use our LHM slab as a microwave lens to test the subwavelength imaging effect that was predicted for negative index materials. In the imaging experiments, a slab-shaped LHM lens with 5× 15 × 32 layers along the x, y, and z directions is used. The illustration for the scanning measurement setup is shown in Fig. 2 with dashed lines. We used monopole antennas as the point source and receiver. The
FIGURE 5 The measured power distribution at 1 cm away from the LHM-air interface. Full width at half maximum of the measured image is 0.23λ. Spatial power distribution in air (i.e., without LHM) is also shown with a gray
line
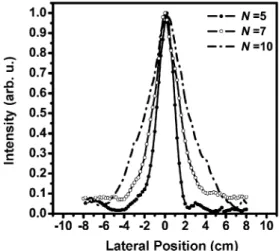
FIGURE 6 The measured power distribution from the Nx= 5, 7, and 10
layers of LHM slab lenses. The beam spot size of the resulting image in-creases with the increasing thicknesses of LHM lenses
monopole antenna was constructed by removing the shield around one end of a microwave coaxial cable. The exposed center conductor, which also acted as the transmitter and re-ceiver, was 4 mm long. This length is approximately λ/2, arranged to work at 3.75 GHz. We placed an omni-directional source 1 cm away from the first LHM surface. The intensity distribution of an EM wave is scanned from 1 cm away from the second surface by another monopole antenna with ∆z= 2 mm(λ/40) steps (Fig. 2).
Figure 5 shows the measured intensity distribution along the image plane for a five-layer LHM lens. The full width at half maximum (FWHM) of the focused beam is 0.23λ, which is well below the diffraction limit. The dashed line in Fig. 5, belongs to the intensity distribution in air that is measured after removing the LHM lens. Keep in mind that the intensity profiles in Fig. 5 are normalized with respect to their max-imum intensity values. FWHM of the EM wave propagating in free space is measured as 1.13λ. Therefore, we have ob-served∼ 5× focusing at the image plane.
Theoretical calculations predict that the lens thickness plays an important role on the superlens resolution [20]. The lenses with greater thicknesses reduce the resolution and
re-sult in wider focused beam sizes. In order to check the effect of lens thickness on subwavelength imaging, we have repeated the imaging experiments with 7- and 10-layer LHM lenses. To compare the resulting intensity distribution of three dif-ferent thicknesses of LHM lens, the beam profiles are plot-ted in Fig. 6. The experimental observations verify the pre-dicted reduction in super-resolution with the increasing thick-ness of LHM superlens. FWHM of the focused EM wave from the N = 7-layer LHM lens is 0.35λ. For a 10-layer LHM lens, the FWHM is measured to be 0.5λ, which is just the diffraction limit. The resolution significantly reduces for thicker LHM superlenses. Therefore, one should use thin-ner LHM lenses to construct images with subwavelength spot sizes.
5 Conclusion
In summary, the LHM slab was shown to exhibit left-handed transmission properties and negative phase vel-ocity within the frequency ranges of negative dielectric per-mittivity and negative magnetic permeability. We demon-strated subwavelength imaging from a left-handed metama-terial superlens. The spot size of the image obtained from a five-layer LHM lens is 0.23λ, which is not achievable with any ubiquitous materials. Experimental observations showed that increasing the thickness of the LHM superlens drasti-cally reduces the resolution of the image. Additionally, the transmission reduces with an increasing number of layers. Therefore, one should use thinner lenses in order to obtain high resolution and high transmission.
ACKNOWLEDGEMENTS This work is supported by the Eu-ropean Union under the projects METAMORPHOSE, EU-NOE-PHOREMOST, and TUBITAK under Projects No. 104E090, 105E066, 105A005, 105A014.
REFERENCES
1 V.G. Veselago, Sov. Phys. Uspekhi 10, 509 (1968)
2 J.B. Pendry, A.J. Holden, D.J. Robbins, W.J. Stewart, J. Phys.: Condens. Matter 10, 4785 (1998)
3 J.B. Pendry, A.J. Holden, D.J. Robbins, W.J. Stewart, IEEE Trans. Mi-crow. Theory Technol. 47, 2075 (1999)
4 D.R. Smith, W.J. Padilla, D.C. Vier, S.C. Nemat-Nasser, S. Schultz, Phys. Rev. Lett. 84, 4184 (2000)
5 K. Aydin, K. Guven, M. Kafesaki, L. Zhang, C.M. Soukoulis, E. Ozbay, Opt. Lett. 29, 2623 (2004)
6 K. Aydin, K. Guven, N. Katsarakis, C.M. Soukoulis, E. Ozbay, Opt. Express 12, 5896 (2004)
7 R.A. Shelby, D.R. Smith, S. Schultz, Science 292, 77 (2001)
8 C.G. Parazzoli, R.B. Greegor, K. Li, B.E. Koltenbah, M. Tanielian, Phys. Rev. Lett. 90, 107 401 (2003)
9 A.A. Houck, J.B. Brock, I.L. Chuang, Phys. Rev. Lett. 90, 137 401 (2003)
10 K. Aydin, E. Ozbay, J. Opt. Soc. Am. B 23, 415 (2006)
11 K. Aydin, K. Guven, C.M. Soukoulis, E. Ozbay, Appl. Phys. Lett. 86, 124 102 (2005)
12 S.A. Cummer, B.I. Popa, Appl. Phys. Lett. 85, 4564 (2004)
13 K. Aydin, I. Bulu, K. Guven, M. Kafesaki, C.M. Soukoulis, E. Ozbay, New J. Phys. 7, 168 (2005)
14 J.B. Pendry, Phys. Rev. Lett. 85, 3966 (2000)
15 E. Cubukcu, K. Aydin, E. Ozbay, S. Foteinopoulou, C.M. Soukoulis, Nature 423, 604 (2003)
16 E. Cubukcu, K. Aydin, S. Foteinopolou, C.M. Soukoulis, E. Ozbay, Phys. Rev. Lett. 91, 207 401 (2003)
18 D.R. Smith, D. Schurig, M. Rosenbluth, S. Schultz, S.A. Ramakrishna, J.B. Pendry, Appl. Phys. Lett. 82, 1506 (2003)
19 N. Fang, X. Zhang, Appl. Phys. Lett. 82, 16 161 (2003) 20 A.N. Lagarkov, V.N. Kissel, Phys. Rev. Lett. 92, 077 401 (2004) 21 X.S. Rao, K.C. Ong, Phys. Rev. E 68, 067 601 (2003)
22 K. Aydin, I. Bulu, E. Ozbay, Opt. Express 13, 8753 (2005) 23 N. Fang, H. Lee, C. Sun, X. Zhang, Science 308, 534 (2005) 24 I. Bulu, H. Caglayan, E. Ozbay, Opt. Lett. 31, 814 (2006)
25 K. Aydin, I. Bulu, E. Ozbay, Microw. Opt. Technol. Lett. 48, 2548 (2006)