B USE S EZER EF F ECTS OF C OL OR TEMP ERATU R E O N PR OJECTED B il ke nt Univer sit y 2020 F R ACTAL LI GH T P AT TERNS : VISUA L I NT ERES T A ND EMOT IO NA L RES P ON S E
EFFECTS OF COLOR TEMPERATURE ON PROJECTED
FRACTAL LIGHT PATTERNS:
VISUAL INTEREST AND EMOTIONAL RESPONSE
A Master’s Thesis
by
BUSE SEZER
Department of
Interior Architecture and Environmental Design İhsan Doğramacı Bilkent University
Ankara July 2020
To my parents, Neziha & Selçuk
EFFECTS OF COLOR TEMPERATURE ON PROJECTED
FRACTAL LIGHT PATTERNS:
VISUAL INTEREST AND EMOTIONAL RESPONSE
The Graduate School of Economics and Social Sciences of
İhsan Doğramacı Bilkent University
by BUSE SEZER
In Partial Fulfillment of the Requirements for the Degree of MASTER OF FINE ARTS
THE DEPARTMENT OF
INTERIOR ARCHITECTURE AND ENVIRONMENTAL DESIGN İHSAN DOĞRAMACI BİLKENT UNIVERSITY
ANKARA
iii
ABSTRACT
EFFECTS OF COLOR TEMPERATURE ON PROJECTED FRACTAL LIGHT PATTERNS:
VISUAL INTEREST AND EMOTIONAL RESPONSE
Sezer, Buse
MFA, Department of Interior Architecture and Environmental Design Supervisor: Assoc. Prof. Dr. Nilgün Olguntürk
July 2020
The aim of the present study is to examine the effects of color temperature of
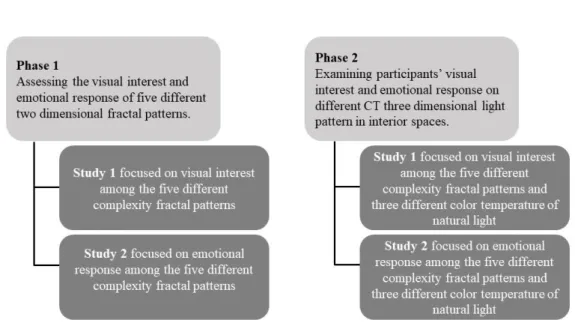
projected fractal patterns on visual interest and emotional response in interior spaces. The experiment consisted of two phases, which were carried out with two
independent participant groups. In the first phase, the effects of five different
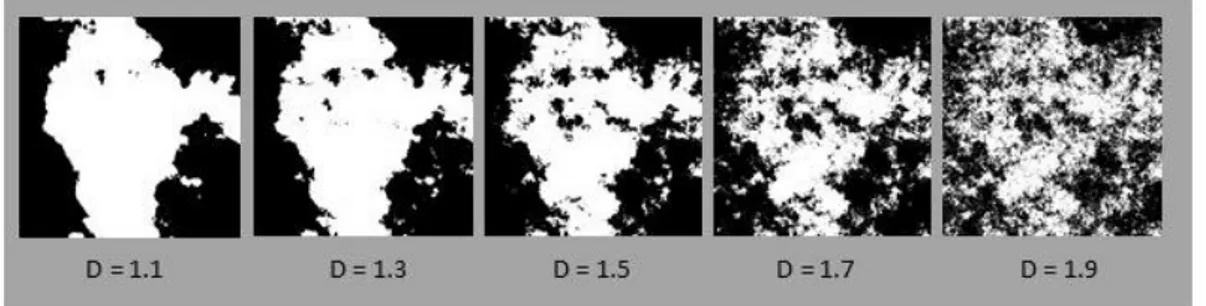
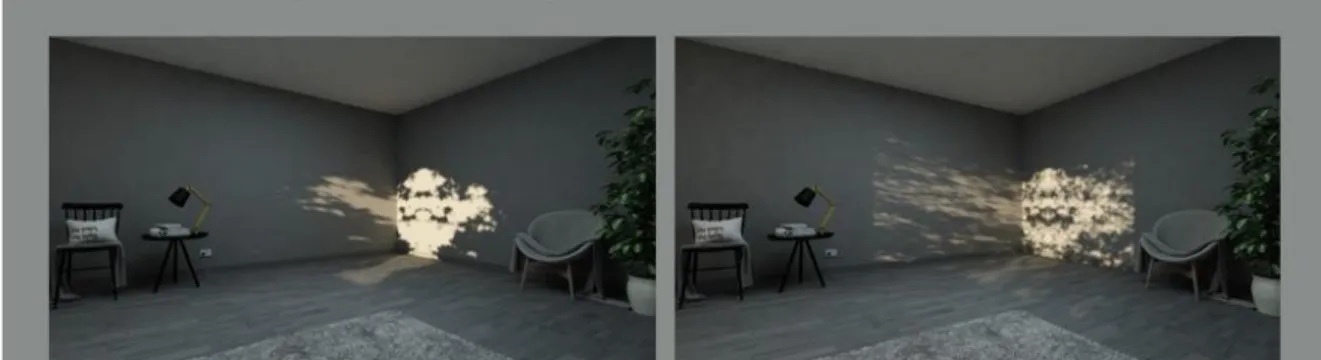
complexity levels of two dimensional fractal patterns (D = 1.1, D = 1.3, D = 1.5, D = 1.7, D = 1.9) on visual interest and emotional response were examined. In the second phase, the effects of three different natural light color temperatures (noon sky – 4000K, overcast sky – 6500K, clear sky – 12000K) of three dimensional projected fractal patterns on visual interest and emotional response in interior spaces were evaluated. The participants consisted of sixty undergraduate and graduate students enrolled in İhsan Doğramacı Bilkent University. Results demonstrated that, in the first phase, the most visually interesting fractal pattern was high-complexity D = 1.7. Moreover, the results indicated that the complexity level of fractal patterns had no
iv
significant influence on participants’ pleasure state, whereas complexity level had positive significant effects on participants’ arousal state. In the second phase, results indicated that the most visually interesting projected fractal pattern was
high-complexity D = 1.7 for all color temperatures (4000K, 6500K, & 12000K). Therefore, color temperature had no significant influence on the choice of fractal pattern complexity level in terms of visual interest. Regarding emotional response, the findings also demonstrated that color temperature had no significant influence on pleasure and arousal state. Consequently, the most influential outcome of the study was that, compared with color temperature, complexity level is a more significant factor related to visual interest and emotional response. The findings of the present study guides designers on the implementation of natural light patterns to for visual interesting interior spaces.
Keywords: Color Temperature, Emotional Response, Fractal Patterns, Natural Light,
v
ÖZET
IŞIĞIN RENK SICAKLIĞININ YANSITILAN FRAKTAL MODELLER ÜZERİNDEKİ ETKİSİ: GÖRSEL İLGİ VE DUYGUSAL TEPKİ
Sezer, Buse
İç Mimarlık ve Çevre Tasarımı Yüksek Lisans Programı Tez Danışmanı: Doç. Dr. Nilgün Olguntürk
Temmuz 2020
Bu çalışmanın amacı, yansıtılan fraktal modellerin renk sıcaklığının iç mekanlarda görsel ilgi ve duygu eğilimi üzerindeki etkilerini incelemektedir. İki aşamadan oluşan deney, iki bağımsız katılımcı grubu ile yürütülmüştür. İlk aşamada, beş farklı iki boyutlu fraktal model karmaşıklığının (D = 1.1, D = 1.3, D = 1.5, D = 1.7, D = 1.9) görsel ilgi ve duygu eğilimi üzerindeki etkileri incelenirken, ikinci aşamada, üç farklı doğal ışık renk sıcaklığıyla (öğlen gökyüzü – 4000K, bulutlu gökyüzü – 6500K, açık gökyüzü – 12000K) yansıtılan üç boyutlu fraktal modellerin iç mekanlarda görsel ilgi ve duygu eğilimi üzerindeki etkilerini incelemektedir. Katılımcılar, İhsan Doğramacı Bilkent Üniversitesi’ne kayıtlı altmış lisans ve lisansüstü öğrenciden oluşmaktadır. Görsel açıdan en ilginç modelin yüksek karmaşıklık düzeyi D = 1.7 olduğu
bulunmuştur. Ayrıca, fraktal modellerin karmaşıklık düzeyinin, katılımcıların memnuniyet durumu üzerinde önemli bir etkisi olmadığı, fakat uyarılma durumu üzerinde önemli olumlu etkileri olduğu bulunmuştur. Çalışmanın ikinci aşamasının sonuçlarına göre, tüm doğal ışık renk sıcaklıkları (4000K, 6500K, 12000K) için
vi
görsel açıdan en ilginç bulunan modelin yüksek karmaşıklık düzeyi D = 1.7 olduğu bulunmuştur. Bu nedenle, ışık renk sıcaklığının görsel ilgi açısından fraktal model karmaşıklık düzeyi üzerinde bir etkisi olmamıştır. Ayrıca, ışık renk sıcaklığının memnuniyet ve uyarılma durumu üzerinde önemli bir etkisinin olmadığı
görülmüştür. Sonuç olarak, bu çalışmadan çıkarılacak en önemli netice, karmaşıklık düzeyinin ışık renk sıcaklığına kıyasla görsel ilgi ve duygusal tepki üzerinde daha önemli bir faktör olduğudur. Bu çalışmadaki bulgular tasarımcılara görsel açıdan ilginç iç mekanlar tasarlamak için doğal ışık modellerinin uygulanması konusunda
rehberlik etmektedir.
Anahtar Kelimeler: Doğal Işık, Duygusal Tepki, Fraktal Modeller, Görsel İlgi,
vii
ACKNOWLEDGEMENT
Firstly, I am grateful for the precious encouragement, supervision, and endless patience my advisor Assoc. Prof. Dr. Nilgün Olguntürk offered me during this period. Secondly, I am also grateful for the critiques and effective reviews of the jury members, Asst. Prof. of Practice Burçak Altay and Assist. Prof. Dr. İpek Memikoğlu.
Furthermore, I wish to thank the İhsan Doğramacı Bilkent University Library’s members and staff for providing us with a multimedia room for the experiment. Moreover, I am grateful to the 60 participants enrolled at İhsan Doğramacı Bilkent University for their important contribution to the study. Furthermore, I would like to thank my dear teacher Burcu Aydınalp Egel for her valuable information and support at the early stages of the research. I am also grateful to Prof. Richard Taylor, head of the Physics faculty at Oregon University, for providing us with the fractal patterns used in this study.
I would like to offer special thanks to my friends, Samah Obeid and Rengin
Kocaoğlu for their valuable help, great encouragement, overwhelming support and patience in this period. I am grateful as well to my sisters and brothers, Seren, Öznur, Aslı, Bengisu, Emre, and Sabri, for their trust and great encouragement throughout this year. Lastly, at most, I would like to thank my family and siblings for always supporting and encouraging me in my life.
viii
TABLE OF CONTENTS
ABSTRACT ... iii
ÖZET ... v
ACKNOWLEDGEMENT ... vii
TABLE OF CONTENTS ... viii
LIST OF TABLES ... xii
LIST OF FIGURES ... xix
LIST OF ABBREVIATIONS ... xx
CHAPTER I: INTRODUCTION ... 1
1.1 Aim of the Study ... 4
1.2 Structure of the Thesis ... 5
CHAPTER II: UNDERSTANDING FRACTAL PATTERNS ... 7
2.1 Attachment to Nature ... 7
2.2 Properties of Fractal Patterns... 10
2.3 Responses to Fractal Patterns ... 16
2.4 Fractal Light Patterns and Visual Interest in Interior Spaces ... 20
CHAPTER III: NATURAL LIGHT AND COLOR TEMPERATURE IN INTERIOR SPACES ... 23
ix
3.2 Natural Light Patterns in Interior Spaces ... 25
3.2.1 Color Temperature ... 27
3.2.2 Correlated Color Temperature ... 32
3.3 Perception of Light in Interior Spaces ... 34
3.3.1 Physiological Effects of Natural Light ... 38
3.3.2 Psychological Effects of Natural Light ... 39
3.4 Perception of Interior Spaces ... 40
3.4.1 Physical Factors ... 41
3.4.2 Psychological Factors ... 43
3.5 Emotional Response in Interior Spaces: Mehrabian and Russell (1974) Model ... 44
CHAPTER IV: METHODOLOGY ... 47
4.1 Aim of the Study ... 47
4.2 Research Questions and Hypotheses ... 48
4.3 Method of the Study – Phase 1 ... 50
4.3.1 Specifying the Fractal Patterns ... 50
4.3.2 Specifying the Emotional Response Dimensions ... 52
4.3.3 Sample Group ... 53
4.3.4 Description of the Setting ... 55
4.3.5 Procedure of the Experiment ... 58
4.4 Method of the Study – Phase 2 ... 61
x
4.4.2 Sample Group ... 62
4.4.3 Description of the Setting ... 64
4.4.4 Procedure of the Experiment ... 65
CHAPTER V: RESULTS ... 68
5.1 Data Analysis ... 68
5.2 Results of the Experiment – Phase 1 ... 69
5.2.1 Results of the Demographic Questionnaire ... 69
5.2.2 Results of the Visual Interest Assessment Questionnaire ... 70
5.2.3 Results of the Emotional Response Assessment Questionnaire ... 72
5.3 Results of the Experiment – Phase 2 ... 90
5.3.1 Results of the Demographic Questionnaire ... 90
5.3.2 Results of the Visual Interest Assessments Questionnaire ... 91
5.3.3 Results of the Emotional Response Assessment Questionnaire ... 96
CHAPTER VI: DISCUSSION ... 105
6.1 Discussion on the Influence of Complexity Level on Visual Interest – Phase 1 ... 105
6.2 Discussion on the Influence of Complexity Level on Emotional Response – Phase 1 ... 108
6.3 Discussion on the Influence of Complexity Level and CT on Visual Interest – Phase 2 ... 110
6.4 Discussion on the Influence of Complexity level and CT on Emotional Response – Phase 2 ... 111
xi
CHAPTER VII: CONCLUSION ... 116 REFERENCES ... 120 APPENDICES ... 136
APPENDIX A1. Sample Items from the Visual Interest Assessment Questionnaire – Phase 1 ... 137
APPENDIX A2. Sample Items from the Emotional Response Assessment
Questionnaire – Phase 1 ... 139
APPENDIX B1. Sample Items from the Visual Interest Assessment Questionnaire (4000K) – Phase 2 ... 141
APPENDIX B2. Sample Items from the Emotional Response Assessment
Questionnaire (4000K) – Phase 2 ... 143
xii
LIST OF TABLES
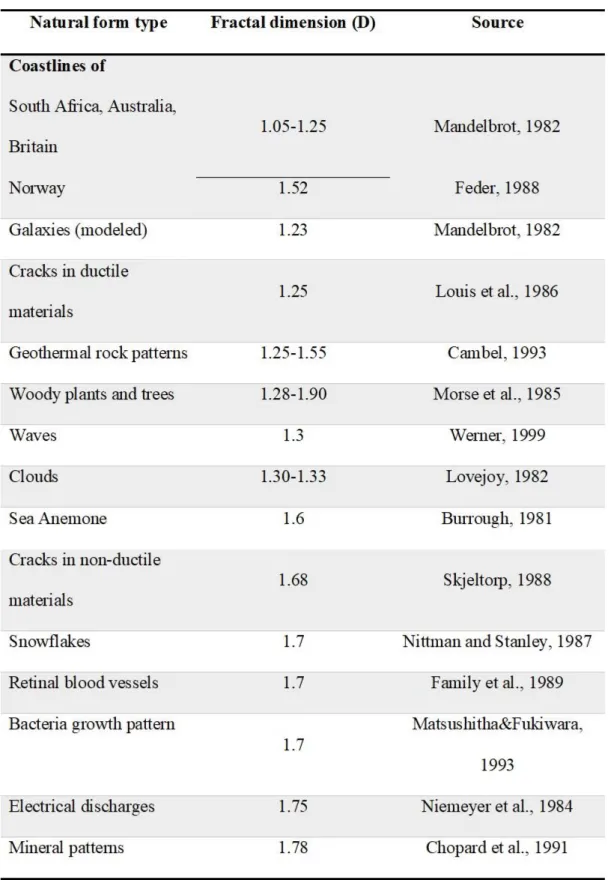
Table 1. D values of several common natural forms ... 15
Table 2. Distribution of the participants’ departments – Phase 1... 54
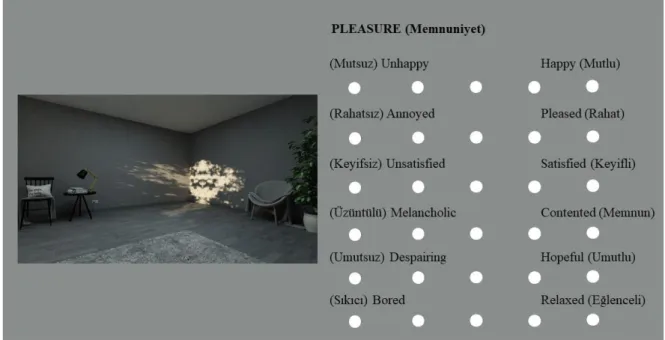
Table 3. Bipolar adjective pairs correspondent to the pleasure and arousal dimensions ... 60
Table 4. Distribution of the participants’ departments – Phase 2... 63
Table 5. Demographic information of the participants – Phase 1 ... 69
Table 6. Frequency table of fractal pattern’s complexity levels – Phase 1 ... 70
Table 7. Wilcoxon Signed-rank test results for visual interest of fractal patterns’ different complexity levels – Phase 1 ... 72
Table 8. Cronbach’s alpha values correspondent to different complexity levels of the pleasure and arousal dimensions – Phase 1... 73
Table 9. Wilcoxon Signed-rank test results for the pleasure and arousal dimensions – Phase 1 ... 75
Table 10. Findings of the itemized analysis for D = 1.1 and D = 1.3 – Phase 1 ... 77
Table 11. Findings of the itemized analysis for D = 1.1 and D = 1.5 – Phase 1 ... 77
Table 12. Findings of the itemized analysis for D = 1.1 and D = 1.7 – Phase 1 ... 77
Table 13. Findings of the itemized analysis for D = 1.1 and D = 1.9 – Phase 1 ... 78
Table 14. Findings of the itemized analysis for D = 1.3 and D = 1.5 – Phase 1 ... 78
Table 15. Findings of the itemized analysis for D = 1.3 and D = 1.7 – Phase 1 ... 78
Table 16. Findings of the itemized analysis for D = 1.3 and D = 1.9 – Phase 1 ... 79
xiii
Table 18. Findings of the itemized analysis for D = 1.5 and D = 1.9 – Phase 1 ... 79 Table 19. Findings of the itemized analysis for D = 1.7 and D = 1.9 – Phase 1 ... 80 Table 20. Findings of the itemized analysis for arousal dimension (D = 1.1 & D =
1.3) – Phase 1 ... 80
Table 21. Findings of the itemized analysis for arousal dimension (D = 1.1 & D =
1.5) – Phase 1 ... 81
Table 22. Findings of the itemized analysis for arousal dimension (D = 1.1 & D =
1.7) – Phase 1 ... 82
Table 23. Findings of the itemized analysis for arousal dimension (D = 1.1 & D =
1.9) – Phase 1 ... 83
Table 24. Findings of the itemized analysis for arousal dimension (D = 1.3 & D =
1.5) – Phase 1 ... 84
Table 25. Findings of the itemized analysis for arousal dimension (D = 1.3 & D =
1.7) – Phase 1 ... 85
Table 26. Findings of the itemized analysis for arousal dimension (D = 1.3 & D =
1.9) – Phase 1 ... 86
Table 27. Findings of the itemized analysis for arousal dimension (D = 1.5 & D =
1.7) – Phase 1 ... 87
Table 28. Findings of the itemized analysis for arousal dimension (D = 1.5 & D =
1.9) – Phase 1 ... 88
Table 29. Findings of the itemized analysis for arousal dimension (D = 1.7 & D =
1.9) – Phase 1 ... 89
Table 30. Demographic information of the participants - Phase 2 ... 90 Table 31. Frequency table of projected fractal patterns’ complexity levels with
xiv
Table 32. Mean scores of projected fractal pattern’s complexity levels with different
CTs – Phase 2 ... 93
Table 33. Wilcoxon Signed-rank test results for visual interest of projected fractal patterns’ complexity levels and CTs – Phase 2 ... 95
Table 34. Cronbach’s alpha values correspondent to different complexity levels projected with different CTs for pleasure and arousal dimensions – Phase 2 ... 96
Table 35. Wilcoxon Signed-rank test results for the pleasure and arousal dimensions correspondent to different complexity levels projected with different CTs – Phase 2 ... 102
Table 36. A summary of the hypotheses, findings, and decisions of the study... 115
Table 37. Tests of normality for visual interest – Phase 1 ... 145
Table 38. Pleasure state’s means for D = 1.1 – Phase 1 ... 146
Table 39. Pleasure state’s means for D = 1.3 – Phase 1 ... 147
Table 40. Pleasure state’s means for D = 1.5 – Phase 1 ... 147
Table 41. Pleasure state’s means for D = 1.7 – Phase 1 ... 147
Table 42. Pleasure state’s means for D = 1.9 – Phase 1 ... 148
Table 43. Arousal state’s means for D = 1.1 – Phase 1 ... 148
Table 44. Arousal state’s means for D = 1.3 – Phase 1 ... 148
Table 45. Arousal state’s means for D = 1.5 – Phase 1 ... 149
Table 46. Arousal state’s means for D = 1.7 – Phase 1 ... 149
Table 47. Arousal state’s means for D = 1.9 – Phase 1 ... 149
Table 48. Test of normality for emotional response – Phase 1 ... 150
Table 49. Test of normality for visual interest – Phase 2 ... 152
Table 50. Pleasure state’s means for D = 1.1 (4000K) – Phase 2 ... 155
xv
Table 52. Pleasure state’s means for D = 1.5 (4000K) – Phase 2 ... 155
Table 53. Pleasure state’s means for D = 1.7 (4000K) – Phase 2 ... 156
Table 54. Pleasure state’s means for D = 1.9 (4000K) – Phase 2 ... 156
Table 55. Arousal state’s means for D = 1.1 (4000K) – Phase 2 ... 156
Table 56. Arousal state’s means for D = 1.3 (4000K) – Phase 2 ... 157
Table 57. Arousal state’s means for D = 1.5 (4000K) – Phase 2 ... 157
Table 58. Arousal state’s means for D = 1.7 (4000K) – Phase 2 ... 157
Table 59. Arousal state’s means for D = 1.9 (4000K) – Phase 2 ... 158
Table 60. Pleasure state’s means for D = 1.1 (6500K) – Phase 2 ... 158
Table 61. Pleasure state’s means for D = 1.3 (6500K) – Phase 2 ... 158
Table 62. Pleasure state’s means for D = 1.5 (6500K) – Phase 2 ... 159
Table 63. Pleasure state’s means for D = 1.7 (6500K) – Phase 2 ... 159
Table 64. Pleasure state’s means for D = 1.9 (6500K) – Phase 2 ... 159
Table 65. Arousal state’s means for D = 1.1 (6500K) – Phase 2 ... 160
Table 66. Arousal state’s means for D = 1.3 (6500K) – Phase 2 ... 160
Table 67. Arousal state’s means for D = 1.5 (6500K) – Phase 2 ... 160
Table 68. Arousal state’s means for D = 1.7 (6500K) – Phase 2 ... 161
Table 69. Arousal state’s means for D = 1.9 (6500K) – Phase 2 ... 161
Table 70. Pleasure state’s means for D = 1.1 (12000K) – Phase 2 ... 161
Table 71. Pleasure state’s means for D = 1.3 (12000K) – Phase 2 ... 162
Table 72. Pleasure state’s means for D = 1.5 (12000K) – Phase 2 ... 162
Table 73. Pleasure state’s means for D = 1.7 (12000K) – Phase 2 ... 162
Table 74. Pleasure state’s means for D = 1.9 (12000K) – Phase 2 ... 163
Table 75. Arousal state’s means for D = 1.1 (12000K) – Phase 2 ... 163
xvi
Table 77. Arousal state’s means for D = 1.5 (12000K) – Phase 2 ... 164 Table 78. Arousal state’s means for D = 1.7 (12000K) – Phase 2 ... 164 Table 79. Arousal state’s means for D = 1.9 (12000K) – Phase 2 ... 164 Table 80. Test of normality for emotional response for all Kelvins (4000K, 6500K,
12000K) – Phase 2 ... 165
Table 81. Findings of the itemized analysis for D = 1.1 between 4000K & 6500K
(pleasure dimension) – Phase 2 ... 172
Table 82. Findings of the itemized analysis for D = 1.1 between 4000K & 12000K
(pleasure dimension) – Phase 2 ... 172
Table 83. Findings of the itemized analysis for D = 1.1 between 6500K & 12000K
(pleasure dimension) – Phase 2 ... 173
Table 84. Findings of the itemized analysis for D = 1.3 between 4000K & 6500K
(pleasure dimension) – Phase 2 ... 173
Table 85. Findings of the itemized analysis for D = 1.3 between 4000K & 12000K
(pleasure dimension) – Phase 2 ... 174
Table 86. Findings of the itemized analysis for D = 1.3 between 6500K & 12000K
(pleasure dimension) – Phase 2 ... 174
Table 87. Findings of the itemized analysis for D = 1.5 between 4000K & 6500K
(pleasure dimension) – Phase 2 ... 175
Table 88. Findings of the itemized analysis for D = 1.5 between 4000K & 12000K
(pleasure dimension) – Phase 2 ... 175
Table 89. Findings of the itemized analysis for D = 1.5 between 6500K & 12000K
(pleasure dimension) – Phase 2 ... 176
Table 90. Findings of the itemized analysis for D = 1.7 between 4000K & 6500K
xvii
Table 91. Findings of the itemized analysis for D = 1.7 between 4000K & 12000K
(pleasure dimension) – Phase 2 ... 177
Table 92. Findings of the itemized analysis for D = 1.7 between 6500K & 12000K
(pleasure dimension) – Phase 2 ... 177
Table 93. Findings of the itemized analysis for D = 1.9 between 4000K & 6500K
(pleasure dimension) – Phase 2 ... 178
Table 94. Findings of the itemized analysis for D = 1.9 between 4000K & 12000K
(pleasure dimension) – Phase 2 ... 178
Table 95. Findings of the itemized analysis for D = 1.9 between 6500K & 12000K
(pleasure dimension) – Phase 2 ... 179
Table 96. Findings of the itemized analysis for D = 1.1 between 4000K & 6500K
(arousal dimension) – Phase 2 ... 179
Table 97. Findings of the itemized analysis for D = 1.1 between 4000K & 12000K
(arousal dimension) – Phase 2 ... 180
Table 98. Findings of the itemized analysis for D = 1.1 between 6500K & 12000K
(arousal dimension) – Phase 2 ... 180
Table 99. Findings of the itemized analysis for D = 1.3 between 4000K & 6500K
(arousal dimension) – Phase 2 ... 181
Table 100. Findings of the itemized analysis for D = 1.3 between 4000K & 12000K
(arousal dimension) – Phase 2 ... 181
Table 101. Findings of the itemized analysis for D = 1.3 between 6500K & 12000K
(arousal dimension) – Phase 2 ... 182
Table 102. Findings of the itemized analysis for D = 1.5 between 4000K & 6500K
xviii
Table 103. Findings of the itemized analysis for D = 1.5 between 4000K & 12000K
(arousal dimension) – Phase 2 ... 183
Table 104. Findings of the itemized analysis for D = 1.5 between 6500K & 12000K
(arousal dimension) – Phase 2 ... 183
Table 105. Findings of the itemized analysis for D = 1.7 between 4000K & 6500K
(arousal dimension) – Phase 2 ... 184
Table 106. Findings of the itemized analysis for D = 1.7 between 4000K & 12000K
(arousal dimension) – Phase 2 ... 184
Table 107. Findings of the itemized analysis for D = 1.7 between 6500K & 12000K
(arousal dimension) – Phase 2 ... 185
Table 108. Findings of the itemized analysis for D = 1.9 between 4000K & 6500K
(arousal dimension) – Phase 2 ... 185
Table 109. Findings of the itemized analysis for D = 1.9 between 4000K & 12000K
(arousal dimension) – Phase 2 ... 186
Table 110. Findings of the itemized analysis for D = 1.9 between 6500K & 12000K
xix
LIST OF FIGURES
Figure 1. Examples of mid-complexity fractal patterns D = 1.1- 1.5 ... 3 Figure 2. An example of natural fractal forms ... 12 Figure 3. Representation of three different fractal pattern generation methods... 13 Figure 4. Use of natural light through patterned opening elements in interior spaces
... 26
Figure 5. Black body locus on CIE chromaticity diagram ... 29 Figure 6. A chart illustrating CTs of artificial light sources and daylight ... 31 Figure 7. The M-R model ... 44 Figure 8. Diagram showing the framework of the experiment process ... 48 Figure 9. The five different complexity levels of fractal pattern used in the present
study ... 51
Figure 10. Multimedia rooms in İhsan Doğramacı Bilkent University... 56 Figure 11. Participants in the experiment... 57 Figure 12. Example stimuli of the visual interest assessment questionnaire ... 58 Figure 13. Example stimuli of the emotional response assessment questionnaire ... 61 Figure 14. Setting of the experiment ... 64 Figure 15. Sample item of the visual interest assessment questionnaire (4000K) –
Phase 2 ... 66
Figure 16. Sample item of the emotional response assessment questionnaire (4000K)
xx
LIST OF ABBREVIATIONS
ART Attention Restoration Theory
CT Color Temperature
CCT Correlated Color Temperature
CRI Color Rendering Index
M-R Mehrabian and Russell
1
CHAPTER I
INTRODUCTION
Today, nature is more significant than before in providing a healthy life to people. The rapid industrial and urban development pushed people away from natural scenes, thus making them stranger to nature (Gifford, 2007). This is why people do not even like imagining a developed world within natural settings. According to Gifford (2007), people may benefit from the nature in various ways. Ulrich (1981) defined two main benefits of nature, which are physiological and psychological that were later studied by many researchers. A previous study demonstrated that natural environments have higher restorative potential and more positive evaluation of recovery than urban environments (Staats, Kieviet, & Hartig, 2003). Another study demonstrated that walking in nature made people feel more positive compared with an urban environment (Hartig et al., 2003). Also, Hartig et al. (2003) demonstrated that sitting in a room with tree views is beneficial for people’s diastolic blood pressure compared with sitting in a viewless room. Moreover, many hypotheses and theories were formulated with the aim to explain people’s connection with nature.
One of these hypotheses was formulated by Kellert (2005). Kellert (2005) suggested that people take advantage of the naturalistic and esthetical characteristics of nature.
2
The naturalistic characteristics refer to the diversity and variety perceived in nature, and the esthetical characteristics refer to the nature’s beauty and attraction (Kellert, 2005). This hypothesis was based on Edward Wilson’s biophilia hypothesis
(Abboushi et al., 2019) where he offers deep understanding about people and their lives and the natural process as a biological need necessary for human developmental process, essentially in physical and mental growth (Kellert & Wilson, 1993). At this point, researchers started investigating the characteristics of natural scenes and mechanisms of visual perception, which provide positive responses to people
(Abboushi et al., 2019). Those responses were related to the fractal characteristics of nature, such as clouds, trees, mountains, and rivers (Hagerhall et al., 2015; Joye & Berg, 2011; Purcell et al., 2001).
Fractal forms, which consist of similar repetitive patterns in finer extensions, are known as ‘‘self-similarity’’ of fractal patterns (Mandelbrot, 1982). Moreover, they are naturally complex that they create visual stimuli (Abboushi et al., 2019). Complexity level varies between different fractal forms in accordance with their repetitive patterns. Nature consists of extensive mid-complexity fractal patterns, which enable people easy adaptation to the environment with regard to visual system (Taylor & Spehar, 2016; Taylor et al., 2018). In the literature, this adaptation is described as the fractal fluency theory. Therefore, previous studies indicated that, for statistical fractals found in nature, mid-complexity fractal patterns D = 1.3 – 1.5 were preferred the most (Abboushi et al., 2019; Spehar et al., 2003; Spehar & Taylor, 2013; Taylor et al., 2005). Figure 1 presents one of the examples of mid-complexity fractal patterns D = 1.3 – D = 1.5.
3
Figure 1. Examples of mid-complexity fractal patterns D = 1.1- 1.5
(fractal patterns adapted with the permission of Prof. Richard Taylor)
Previous studies also demonstrated that fractal patterns provoked stress recovery benefits (Taylor, 2006). Moreover, enhanced pattern identification (Taylor et al., 2017a,b; Taylor et al., 2018), increased navigation skills (Juliani et al., 2016), and aesthetic admiration (Aks & Sprott, 1996; Spehar et al., 2003) were positive
outcomes of aesthetic attractiveness of fractal patterns (Taylor, 2002). Therefore, it is significant to analyze the implementation of fractal patterns in interior spaces where people spend the majority of their times.
Various environmental factors influence people’s response to the simulated fractal patterns in interior spaces. Therefore, the implemented presentation methods of fractal patterns and research experimental settings are important. Previous studies, in environmental psychology, demonstrated four important variables influencing the effects of visual interest on projected fractal patterns in interior spaces, which were pattern type, pattern complexity, spatial variables, and light projections (Abboushi et al., 2019). However, most studies in the literature investigated the effects of fractal
4
patterns on perceptual responses by utilizing two-dimensional visualizations on computer screens (Hagerhall et al., 2008; Spehar et al., 2003; Spehar & Taylor, 2013; Taylor et al., 2011). Abboushi et al. (2019) examined the influence of projected fractal patterns on visual interest and preference. However, the study did not investigate the effects of color temperature (CT) of projected fractal patterns on visual interest and emotional response. Thus, based on the gaps in the previous literature, the present study examined the effects of projected fractal patterns with different CTs of natural light on visual interest and emotional response in interior spaces.
1.1 Aim of the Study
Despite the large amount of studies on physiological and psychological responses to nature and fractal patterns prevalent in natural scenes, there are no previous studies focusing on projected three dimensional fractal patterns with different CTs and complexity in interior spaces. Therefore, this study aimed at transferring the aesthetic values of nature into interior spaces in order to create visually interesting places. By bringing nature’s effects, such as different CTs of natural light and fractal patterns, into interior spaces, this study examined people’s visual interest and emotional response.
5
1.2 Structure of the Thesis
The present thesis is structured as follows: The first chapter presents the introduction, where the research topic, aims, and structure of the thesis are introduced. The second chapter investigates the influence of nature’s effects on people by relating to
biophilia hypothesis and fractal patterns prevalent in nature. Also, it presents a brief literature on the effects of fractal patterns on people’s visual preference, visual interest, and aesthetic response.
The third chapter examines natural light’s physiological and psychological effects on people in interior spaces by introducing previous research on natural light. Moreover, it covers the differences between color temperature and correlated color temperature. Also, the perception of interior spaces and its relation with natural light patterns are investigated. Besides, it covers a brief part on emotional response in interior spaces based on the pleasure and arousal dimensions of the Mehrabian and Russell (M-R) (1974) model.
The fourth chapter introduces the methodology of the study. Based on the previous literature, the aim, research question, hypotheses, sample group, and procedure of the experiment are described. The fifth chapter consists of the results, where the effects of fractal patterns complexity on visual interest and emotional response are
investigated. In addition, the effects of projected fractal patterns created by different natural light CTs on people’s visual interest and emotional response are examined in interior spaces.
6
The sixth chapter discusses the findings of the study by relating to the relevant previous literature. The final chapter concludes the present study and presents its contribution and limitations. Also, it discusses suggestions for future studies. This chapter is followed by the references and appendices covering sample items of the questionnaires used in phases 1 and 2 of the experiment. In adding, the appendices include statistical tables of the data results.
7
CHAPTER II
UNDERSTANDING FRACTAL PATTERNS
This chapter presents a brief literature on the effects of nature on people by
emphasizing the impact of fractal patterns. Also, it describes more about properties of fractal patterns and complexity referred by D, which is the most important
dimension related to fractal patterns. Furthermore, it investigates the effects of fractal patterns on visual interest and preference.
2.1 Attachment to Nature
The physiological and psychological benefits of nature have been examined by many researchers who suggested various hypotheses and theories about this
interrelationship (Abboushi et al., 2019; Hagerhall et al., 2015). Most research in the literature was found in the field of environmental psychology. Environmental
psychologists tried to identify the reason behind people’s great attachment to nature. Kaplan (1995) and Ulrich (1993) stated that environmental psychologists linked people’s attachment to nature to the early human evolution. Elements found in nature
8
allowed people to experience feelings of relaxation and restoration making them develop strong attachment to nature (Berg et al., 2003; Hartig & Staats, 2005; Purcell et al., 2001).
Gifford (2007) stated that many researchers generated a list, including 40 to 50 items, to determine the reasons behind people’s attachment to nature. Furthermore, Gifford (2007) divided these items under ten categories; cognitive freedom, sense of escape, experience nature, growth, challenge, guidance, social dimension, health, self-control, and ecosystem connectedness. However, two of these categories, challenge and guidance, were out of the context of the present study, therefore, they were not explained in detail. Cognitive freedom provides feelings of freedom to whatever people wish in nature; sense of escape provides a chance to being excepted from society rules and everyday life; experience nature enables people to meet their needs for being in nature; growth provides people a chance to improve their self-awareness through natural environments; social dimension provides a feeling different from social life in the city; health improves people both mentally and physically by providing fresh air and exercise that nature offers; self-control is when people feel a therapeutic experience; and ecosystem connectedness provides a feeling that we are part of the nature (Gifford, 2007).
Natural environments are found more restorative than urban environments and have a great positive effect on the attention capacity recovery time (Abboushi et al., 2019). Researchers stated that people who live close to nature have healthier lives, less physical illness, and a better attention capacity recovery. Thus, they experienced and fulfilled needs that may not be easily acquired in urban environments (Gifford,
9
2007). Moreover, Ulrich (1981) investigated the psycho physiological influence of scene types, such as nature vs. urban. Results found that natural environments had a more positive influence. Also, Ulrich (1984) found that viewing natural scenes decreased hospitalization recovery time and demanded fewer pain medications. Another study demonstrated that walking in a natural environment had a higher positive effect when compared to walking in urban environments (Hartig et al., 2003). In addition, the latter study indicated that natural views in a room provided regulations in diastolic blood pressure. On the contrary, sitting in a viewless room caused a lesser decrease in diastolic blood pressure.
Gifford (2007) stated that living in nature or being enclosed by nature has a
restorative effect on people. Research on restorative effect is generally based on the Attention Restoration Theory (ART) (Kaplan, 1995). The theory indicated that natural environments have a variety of characteristics necessary for restorative experiences. Kaplan (1995) answered the question of how nature relates to restoration. An approach was that the natural settings included four necessary restorative components that are being away, fascination, extent, and compatibility. These components were defined by Kaplan (1995) as follows. Natural settings, such as seaside, mountains, lakes, streams, forests, and meadows are often the preferred destinations for being away. Also, nature is enriched with fascinating objects, mostly soft fascinations, such as clouds, sunsets, snow patterns. These fascinations provide an opportunity to feel peaceful. Natural settings with trails and paths also create a sense of extent, which promotes the feeling of being in a larger world. Besides, natural environments are defined as high in compatibility. It makes people feel as if they have special resonance with the natural settings. Considering all of the previous
10
components, which are particularly met by the natural settings, nature plays a significant role on restorative experiences.
Apart from this, Kellert (2005) claimed that nature’s variability and aesthetic values allow people to attach meanings or acquire benefits from nature. This concept is inspired from the biophilia hypothesis (Abboushi et al., 2019). This hypothesis implied that human beings’ connection with nature is essential for their well‐being (Kellert & Wilson, 1993). Inspired by the ART and biophilia hypothesis, many researchers focused on determining the features of nature influencing people’s positive response (Abboushi et al., 2019). Some of these previous studies related people’s positive response to nature’s fractal properties (e.g. clouds, trees,
mountains, rivers) (Hagerhall et al., 2015; Joye & Berg, 2011; Purcell et al., 2001). The present research is based on the ART and biophilia hypothesis, since the aim was to investigate the hypothesized effects of natural elements on people.
2.2 Properties of Fractal Patterns
Natural forms included in science, mathematics and even in arts are formed by Euclidean geometry. People desire to find simplicity and order in nature, hence, Euclidean geometry is observed as illustrations of natural forms, which may be essential and irregular (Hasting & Sugihara, 2011). For instance, shapes of the planets are roughly spheres, honeycombs are hexagons, pine trees are roughly cone-shaped and elm leaves are ellipses. By filtering out the complexity within the nature, we obtain simplicity with the class of geometrical shapes. However, nature has both
11
simple and complex shapes. Simple shapes consist of Euclidean and ordered forms, whereas complex shapes include irregular and random forms. Abstract painter Piet Mondrian’s geometric forms and American abstract painter Jackson Pollock’s
random patterns both involve important elements of nature (Hasting & Sugihara, 2011). Furthermore, it is important to mention that fractals are the greatest
representation for geometry combination of complexity and simplicity (Hastings & Sugihara, 2011). Mandelbrot (1989) defined fractal geometry as the link between the geometric order of Euclid and the geometric chaos of general mathematics.
Fractal patterns, defined as the self-similarities occurring on an extension scale (Abboushi et al., 2019), represent the rough complex elements of the natural world. Also, they are described as the ‘‘fingerprints of nature’’ (Taylor et al., 2007) due to their repeating patterns existing in coastlines, clouds, mountain ranges, rivers, trees, plants (Gouyet, 1996; Mandelbrot, 1982).
In the literature, Mandelbrot is often known as the creator of the fractal geometry (Spehar et al., 2003). However, many of the fractals and their geometry were based on classical mathematics and mathematicians like Helge von Koch, Sierpinski, Waclaw Gaston Julia, Felix Hausdorff, and Georg Cantor (Peitgen et al., 2012). However, these mathematicians were not aware of the new geometry of nature they created. Later on, Mandelbrot (1989) demonstrated that nature included shapes with various features similar to mathematical fractals.
Unlike many geometrical fractals and human-made shapes, natural forms are characterized by their asymmetry and irregularity. The original intricacy of the natural forms is radically different from the traditional Euclidean geometry. Most
12
natural forms have self-similarity that differ by their repetitive scale, while Euclidean shapes are formed by more smooth lines (Spehar et al., 2003). Such natural fractal forms, composed of similar repetitive patterns in finer extensions, are known as ‘‘self-similarity’’ of fractal patterns (Mandelbrot, 1982) (see Figure 2). Researchers demonstrated that repeated patterns have the same statistical qualities even though their repetition is different (Spehar et al., 2003).
Figure 2. An example of natural fractal forms
(Image by author)
Since their discovery by Mandelbrot, fractals have achieved great success in
determining the complex structures found in nature and have received great attention from artists and scientists (Spehar et al., 2003). Fingerprints of nature and the new aesthetics refer them. There are different methods to generate fractal patterns, which
13
may be categorized into three groups; natural fractals, mathematical fractals, and human made fractals (Spehar et al., 2003). Natural fractals are considered as natural scenes, such as clouds, trees, waves. Mathematical fractals are computer simulations of coastlines, mountains, and clouds. Human made fractals are often found in clipped parts of paintings by the American painter Jackson Pollock (Spehar et al., 2003) (see Figure 3). Based on the literature, people have consistent aesthetic preference of fractal patterns, in spite of the generation method (Spehar et al., 2003).
Figure 3. Representation of three different fractal pattern generation methods
(Abboushi et al., 2019, p.59)
The fractal character of a pattern is quantified by the variable fractal dimension (D) (Spehar et al., 2003). This variable determines the complexity level of fractal patterns in different magnifications (Abboushi et al., 2019). Dimension for Euclidean shapes are explained by ordinal integer values of 0, 1, 2, and 3, which correspond to the following forms: points, lines, planes, and solids, respectively (Spehar et al., 2003). For instance, when D has a value of 1, a smooth line is generated, whereas when D has a value of 2, a totally filled area is generated. However, according to Spehar et al. (2003), for both values, D = 1 and D = 2 no fractal pattern is observed. As for fractal
14
patterns, D value varies from 1 to 2. Thus, when D value is closer to 1, the fractal patterns repeat at different magnifications and expand with smooth and rare shapes. However, when D value is closer to 2, the fractal patterns expand with more complex and detailed shapes (Cutting & Garvin, 1987; Geake & Landini, 1997). Research in behavioral studies indicated that D value is highly related to visual complexity. For instance, when D value increases, visual complexity increases (Taylor & Spehar, 2016).
In accordance with D value, fractal patterns can be classified into three groups; low-complexity (D = 1.1 – D = 1.3), mid-low-complexity (D = 1.3 – D = 1.5), and high-complexity (D = 1.5 – D = 1.9) (Abboushi et al., 2019). Table 1 demonstrated fractal dimensions of several common natural forms (Spehar et al., 2003). The
extensiveness of mid-complexity fractal patterns in nature allowed people to easily adapt to the environment with respect to the visual system (Taylor & Spehar, 2016; Taylor et al., 2018). This adaptation is defined in the literature as the fractal fluency theory (Taylor & Spehar, 2016; Taylor et al., 2018). It is worth mentioning that this theory is associated with the previously discussed ART and biophilia hypothesis (Abboushi et al., 2019).
15
Table 1. D values of several common natural forms (Spehar et al., 2003, p. 815),
16
Fractal patterns are also classified as statistical and exact (Abboushi et al., 2019). Statistical fractals are established in nature and characterized by irregularity and diversity in scale at various extensions where the statistical characteristics of the patterns exclusively replicate, whereas exact fractals identically repeat at various extensions (Fairbanks & Taylor, 2011; Hagerhall et al., 2015; Taylor & Spehar, 2016). In fact, both statistical and exact fractal patterns have complex structures in their repeating forms, however, they are not visually identical (Taylor & Spehar, 2016). Research in behavioral studies has mainly focused on people’s assessment of statistical fractals (Spehar et al., 2003), due to their frequency in nature (Mandelbrot, 1982). Thus, in order to understand the effects of nature on people, the present research was mainly based on statistical fractals.
2.3 Responses to Fractal Patterns
Fractal patterns do not demonstrate equal characteristics in terms of people’s response (visual preference, visual interest, emotional response). Previous studies found that, for statistical fractals, fractal dimensions D = 1.3 and D = 1.5 were preferred the most (Taylor et al., 2005; Spehar & Taylor, 2013). Another study demonstrated that people preferred fractal dimension D = 1.3 and D = 1.5 (Spehar et al., 2003). Aks and Sprott (1996) stated that fractal dimensions between D = 1.17 and D = 1.38 were preferred the most and differences in preferences were explained by differences in participants’ personality features. In a later study, high visual
preferences were recorded at fractal dimensions D = 1.25 and D = 1.5 (Spehar & Taylor, 2013). In general, most studies demonstrated that the fractal dimension D =
17
1.3 and D = 1.5 were the most visually preferred (Abboushi et al., 2019). Moreover, it is worth mentioning that most existing studies displayed two dimensional fractal patterns through monitors and evaluated visual preference and interest using a two alternative forced choice (2AFC) paired comparison test (Abboushi et al., 2019; Aks & Sprott, 1996; Spehar et al., 2015). The 2AFC test, which was presented by Cohn (1894) (as cited in Spehar et al., 2015), includes two images side-by-side in each trial. In this test, observers simply demonstrate which of the two images they visually prefer (Spehar et al., 2015). Moreover, Spehar et al. (2015) stated that this procedure is still believed as the best method to measure diverse forms of preference and visual interest.
Fractal patterns influence many of our visual experiences in nature. Researchers examined peoples’ aesthetical responses to fractal patterns (Street et al., 2016).
Moreover, another research stated that mid-complexity fractal patterns had a universal aesthetic appeal (Taylor et al., 2011). Aesthetic responses on the visual complexity of fractal patterns were studied more deeply by Berlyne (1970) and Forsythe et al. (2011). Berlyne (1970) discussed the existence of a curvilinear relationship between visual complexity, visual interest, and preference. Results indicated a positive significant relationship between visual complexity, visual interest, and preference until the feeling of stimulation reached its maximum level. However, excessive further increases in complexity would evoke exact opposite feelings of stimulation, thus, visual interest and preference would decrease.
Therefore, when the complexity of visual stimuli decreased, interest and preference also decreased. Moreover, results indicated that highly aroused people desired certainty, while others who were less aroused wanted more stimulated and less
18
certain visual environments. Forsythe et al. (2011) demonstrated a linear relationship between visual complexity and beauty in the investigated images. Results suggested that visual complexity and fractal dimension made images more interesting and appealing. Therefore, visual complexity and fractal dimension are the factors that specify the visual interest of fractal patterns. For these kinds of studies, external factors, such as individual and cultural differences play a role on the aesthetic preferences. For instance, individual differences influence the aesthetic preferences, whereas cultural differences received slight attention in the research on fractal complexity and visual interest (Street et al., 2016).
Furthermore, apart from the visual preference, aesthetic preference, and visual interest, Taylor (2006) also discovered that the fractal dimensions D = 1.3 and D = 1.5 considerably reduced stress by 60%. Unlike previous studies, Taylor (2006) hanged the fractal patterns’ images on a wall with a dimension of 3.2x6.5 feet (1.0x2.0m) for the participants to observe instead of displaying the images on a computer screen. Researchers also investigated participants’ brain activity while observing displayed fractal patterns with the aim to examine the relation between physical mechanism and visual preference (Abboushi, 2019).
Moreover, Hagerhall et al. (2008) analyzed brain activity utilizing
electroencephalograms and found that statistical fractal patterns caused an alpha response, which implied a wakefully relaxed state. Also, results showed that
statistical fractal patterns received the highest beta response, which was an indicator of the alertness state. However, delta activity, which referred to the states of
19
1.32. Moreover, previous studies stated that fractal patterns provided esthetical admiration (Aks & Sprott, 1996; Spehar et al., 2003; Taylor, 1998), stress recovery benefits (Taylor, 2006), and feelings of relaxation and restorative effects (Hagerhall et al., 2008). These effects were associated with positive visual preferences of aesthetic attractiveness of fractal patterns. Therefore, it is significant to analyze the application of fractal patterns in interior spaces where people spend the majority of their times (Klepeis et al., 2001).
As previously mentioned, most studies investigating the influence of fractal patterns on visual preference and interest were conducted by presenting the two dimensional fractal patterns on computer screens (Spehar et al., 2003; Spehar & Taylor, 2013; Taylor et al., 2011). Abboushi et al. (2019) and Abboushi (2019) are some of the rare studies examining the visual preference and interest of three dimensional projected fractal patterns in interior spaces. People’s response to the simulated fractal patterns may be affected by various environmental factors. Thus, the presentation methods and experimental settings should be taken into consideration in research on fractal patterns.
Research in the field of environmental psychology indicated four main variables affecting the impact of visual interest on projected fractal patterns, penetrating through a window or an opening with natural light and reflecting on a part of a wall or a floor, in interior spaces (Abboushi et al., 2019). These variables were pattern types, pattern complexities, spatial variables, and light projections (Abboushi et al., 2019). Pattern type refers to pattern geometry; Euclidean and fractal patterns. Pattern complexity is defined by the fractal dimension value D. Spatial variables
20
refer to projection surfaces (walls or floors), view direction, viewing angle, the distance between pattern and observer, size of pattern, and material properties. Light projection consists of the light source projecting these patterns defined by
illumination variables, such as luminance variability, glare, contrast, and
psychological effects of light. Therefore, based on the existing literature, these four variables influence the applicability of fractal patterns in interior spaces as these variables affect people’s perceptual and psychological responses (Spehar et al., 2003; Taylor et al., 2005; Taylor & Spehar, 2016). The present study examined deeply the influence of the variables pattern complexity and light projection while keeping pattern type and spatial variables under control.
2.4 Fractal Light Patterns and Visual Interest in Interior Spaces
To avoid stability and boredom in interior spaces, an intermediate level of sensory stimulation is required and the functions of diversity, intensity, and complexity are considered as components that stimulate people in interior spaces (Evans & McCoy, 1998). The ART discussed that characteristics of natural environments provoked insensible attention, which required restoration from mental fatigue (Kaplan, 1995). Moreover, Stress Recovery Theory (SRT) claimed that the interrelation between nature and its elements decreased the psycho physiological stress and stressful stimuli, which may have provoked insensible attention (Ulrich, 1983). Therefore, characteristics of nature are observed as stimuli and perceived as visually interesting and pleasant.
21
Based on the previous literature, a variety of studies emphasized the role of natural light and its interplay with the decorative openings or windows in providing a flow for natural light in interior spaces. Salingaros (1999) stressed that patterns, which schematically imitate the characteristics of nature, were significant design elements when they were apparent in the space. Results indicated that seeing the patterns on the openings or semitransparent surfaces was more easily perceived than placing them on the building plan. Another study emphasized that these patterns were proposed to maintain beneficial visual similarities with nature (Joye, 2007).
In a sequence of related studies on the effect of fractal geometry on visual interest, Abboushi et al. (2018a,b) investigated the effects of façade conditions on visual interest, visual comfort, and satisfaction. The study focused on office spaces and included three different façade conditions, consisting of a clear window, fully
covered by horizontal stripes window, and fully covered by fractal patterns window. Participants were located either parallel or perpendicular to the window and they evaluated the three window conditions in terms of visual interest, visual comfort, and satisfaction. Results showed that there was no significant difference between the visual comfort and façade variations in the existence of direct sunlight. Furthermore, results demonstrated that visual interest for fractal pattern and horizontal stripes façades changed according to participants’ view direction. Therefore, fractal patterns were found more visually interesting than the horizontal stripes for a view direction based on the perpendicular window, whereas horizontal stripes were considered more visually interesting for a view direction based on the parallel window.
22
In a later study, Abboushi et al. (2019) compared the influence of different
complexity levels of two and three dimensional fractal and non-fractal patterns on visual interest and mood response in two phases. In the first phase, they examined the visual interest and mood response by projecting the two dimensional fractal and non-fractal patterns on a wall. In the second phase, they investigated visual interest and mood response by projecting three dimensional fractal and non-fractal patterns with the sunlight in an interior space. Results demonstrated that, in the first phase, visual interest ratings were the highest for mid-complexity fractal patterns of D = 1.5. For mood responses, results indicated that participants reported great feelings of excitement and stimulation for fractal patterns of D = 1.5 and D = 1.7, respectively. However, in the second phase, findings showed that visual interest increased as fractal dimension increased. The most influential outcome of the study demonstrated that D = 1.7 was rated as the most visually interesting and that ratings for excitement and stimulation increased when D value increased.
While previous studies focused on fractal patterns as one of nature’s most influential elements on peoples’ positive responses, other studies focused on natural light as another influential element of nature, affecting peoples’ responses. In the next chapter, the benefits of natural light on people in interior spaces are examined.
23
CHAPTER III
NATURAL LIGHT AND COLOR TEMPERATURE IN INTERIOR SPACES
This chapter discusses natural light’s physiological and psychological benefits on people in interior spaces. Also, it includes a part comparing color temperature (CT) with correlated color temperature (CCT). Moreover, it covers in detail the perception of light in interior spaces and physical and psychological factors related to perception of interior spaces emphasizing the Mehrabian and Russell (M-R) (1974) model.
3.1 Natural Light
Natural light is an inconsistent light stream; rather it is a dynamic light changing according to time and location (Tregenza & Wilson, 2011). Due to its dynamic characteristic, it may either give a smooth effect or a chaotic one. The changes observed in natural light are not only dependent on time; it also relies on the weather condition changing between bright sunny days to cloudy rainy days.
24
Recently, natural light plays a significant role in defining the functional and
aesthetical characteristics of an interior space. Thus, the application of natural light in interior spaces should be carefully planned and designed by architects and lighting designers (Özdamar, 1998).
Before getting more into natural light, it should be mentioned that, in the literature, natural light was referred by three terms that are daylight, sunlight, and skylight (Tregenza & Loe, 2014). Tregenza and Loe (2014) defined these terms as follows. Daylight is a broad term, often referred by as natural light. Sunlight is the light coming straight from the sun. Skylight or diffuse daylight is the light coming from the sky. In this research, daylight is referred by as natural light, which is a combination of sunlight and skylight, and defined as an independent light source with full spectrum and best color rendering index (CRI).
Spectrum is the distribution of the radiant energy transmitted by a light source across the visible spectrum (Fatios, 2011). Moreover, full spectrum light provides seeing details and colors more clearly, and support to concentrate for longer periods by diminishing eye fatigue. Many natural factors influence the illuminance and spectral property of natural light such as weather condition, time of the day, and analyzed sky. Research has demonstrated the occurrence of great changes in the spectral characteristics of natural light generating variation in the color of light during the day.
Natural light color rendering is a significant characteristic influencing the quality of interior spaces that should be taken into consideration. All light sources’ CRI is based on natural light’s standard color rendering (McNicholl, 1995). Color rendering
25
was described, by Rea (2000), as the impact of a light source on an object’s
appearance. The CRI measures to what extent a light source renders color (Egan & Olgyay, 2002). A CRI of 100 is recommended for the best color appearance (Flynn et al., 1988). Even when the spectral composition of light sources is different, they may be perceived the same, however, the color of objects observed under these lights will look different. Jones (1989) stated that the increase in the CRI helped in making the color seem closer to its natural appearance. Natural light is known as the free light source characterized with a full spectrum and excellent CRI (Kumoğlu, 2013).
These unique characteristics of natural light made it a preferred design element in interior spaces. Furthermore, few studies investigated the influence of different natural light effects on people’s perception in interior spaces, such as natural light patterns. The following part highlights the role of natural light patterns in interior spaces.
3.2 Natural Light Patterns in Interior Spaces
A few research focused on peoples’ responses to natural light patterns in interior spaces. Natural light and its interplay with the openings of a space play a significance role in the design of interior spaces. Natural light is the central source in a space that creates visual interest and stimulation for the spatial experience. However, there is little research on the influence of natural light and its interplay with the openings’ geometry on people’s perception of interior spaces. Corrodi and Spechtenhauser (2008) described the identity of interior spaces as openings through the nature and
26
the flow of light, and the rhythm of light and shadow. Therefore, alongside of the existence of natural light, it is important to provide light patterns with the interaction between light and shadow in the design of interior spaces.
In modern architecture, the necessity of the visual diversity was highlighted by Salingaros (1999). Moreover, in contemporary architecture, the importance of visual patterns was emphasized as a new aesthetic of veiling, which includes the use of decorative patterns, multilayered facades, and semitransparent surfaces through the natural light that flow the space (Corrodi & Spechtenhauser, 2008). Figure 4 demonstrates the use of natural light through patterned opening elements in interior spaces.
Figure 4. Use of natural light through patterned opening elements in interior spaces
27
The interaction of natural light with those architectural elements plays an important role in the design of interior spaces. The architectural elements not only emphasized the openings design, but also demonstrated the interaction between natural light and the openings that generated various light patterns in interior spaces. However, it is important to examine how this interaction with the natural light and diversity of these decorative opening elements influence people’s perception of interior spaces. The architectural elements of an opening form the way natural light penetrates an interior space and determine the variety of natural light patterns (Chamilothori et al., 2019).
Until now in the literature, studies on projected fractal patterns used natural light source without considering the role of CT even though it has been proven in the literature to influence people’s perception. According to American National Standards, CT is one of the most important components determining the quality of light about human perception. Therefore, the present study focused on the influence of CT of projected fractal patterns in interior spaces. The following part develops on the characteristics of CT and CCT.
3.2.1 Color Temperature
In the literature, illuminance and luminance are the most common terms related to lighting (Kocaoğlu, 2015) and are used to measure the quality of light. Illuminance and luminance are referred by as the fundamental characteristics of light. Illuminance was defined, by Egan and Olgyay (2002), as the density of luminous flux present on a surface and is measured by the illuminance meter, in lux. Whereas luminance was
28
referred, by Egan and Olgyay (2002), as the degree of apparent brightness of a light source perceived by the eye divided by the area of that source and is measured with a luminance meter, cd/m2. These terminologies facilitate the understanding of light characteristics and CCT effect. Recently, a few amount of research is investigating the influence of CCT on user’s comfort preferences in interior spaces (Wang et al., 2017). The present research is focused on the effect of natural light’s CT in a more detailed matter.
CT is defined as the appearance of light color and is found as one of the most influential factors related to subjective perception (Egan & Olgyay, 2002). CT represents the warmth and coolness of a light source, such as yellowish white, bluish white, or neutral appearance (Egan & Olgyay, 2002). However, Egan and Olgyay (2002) stated that CT doesn’t give an idea on energy distribution or physical temperature. When CT increases, the amount of blue tint increases, whereas when CT decreases the amount of red tint increases (Katsuura, 2000). The American National Standards (1987) stated that the quality of light was one of the most essential characteristics of lighting and that CT was one of the most crucial
components determining the quality of light providing users with a comfortable and effective visual experience (Katsuura, 2000; Samani, 2011; Veitch & Newsham, 1998). Figure 5 presents the CIE Chromaticity chart that illustrates the CT of any light source, where its chromaticity coordinates, fall on the Planckian locus, and is equal to the blackbody temperature of the Planckian radiator (McCamy, 1992). The measurement level of CT is Kelvin (K). Rea (2000) stated that blackbody properties may be determined through the Planck’s radiation law at different CTs. Also, Rea (2000) indicated that the chromaticity points that fall on the Planckian locus were
29
determined by CT, however, for the points that fell near the Planckian locus CCT was used.
Figure 5. Black body locus on CIE chromaticity diagram
(http://en.wikipedia.org/wiki/Planckian_locus)
Indoor lighting is generally fixed, thus the lighting illuminance and CCT are stable, whereas natural light changes during the day due to the changes in weather, sun position. A recent study by Ye et al. (2018) demonstrated that people working in settings providing dynamic lighting, where changing patterns of CT and illuminance occurred, were more involved with their work environment and had better
performance than workers in the static lighting setting. The color and spectral
characteristics of natural light were likely to vary among different weather conditions and time of the day (Peyvandi et al., 2016).
30
In the literature, three kinds of skies were defined for design applications, which were clear sky, cloudy sky, and overcast sky. Egan and Olgyay (2002) briefly defined each as follows. Clear sky is referred by the sky of a clear day where a large part of the illumination comes straight from the sun casting edgy shadows. Air mass is an important factor influencing the intensity of direct sunlight illumination on clear sky. It is lighter at sunrise and sunset for all latitudes. Also, at noon for high
latitudes, where the sun is lower, it is less intense. In contrast with clear and overcast skies, the illumination of cloudy skies varies often from 23,000 to 100,000 lux, where sometimes it provides total sunlight, and sometimes clouds hide the sun. Overcast sky diminishes the sunlight by over 90%. Overcast sky is referred by the sky condition where the cloud layer is too opaque that the sun is hidden. Besides, its luminance distribution is the same for all sun altitudes.
31
Figure 6. A chart illustrating CTs of artificial light sources and daylight
(Egan & Olgyay, 2002, p. 76)
Figure 6 illustrates Egan and Olgyay’s (2002) fundamental scale for artificial light’s CCTs and natural light’s CTs. Egan and Olgyay (2002) defined the Kelvin scale ranging from 1000K to 28000K referred by sunlight (Warm) to Skylight (Cool), respectively. No previous studies examined the effect of sky types on people’s visual interest and emotional response. Thus, the present research investigated the effect of three sky types with three different CTs on people’s visual interest and emotional response. These are noon, overcast sky, and blue sky with thin clouds. The latter is referred by, in this research, as clear sky.
32
3.2.2 Correlated Color Temperature
As mentioned in the previous part, the terminology CCT was used when the chromaticity points of a light source fell near the Planckian locus on CIE
chromaticity diagram (Rea, 2000). Therefore, CCT refers to artificial lights, which mimic the natural light. Artificial light is referred to human-made light sources, which radiate from the electric lamps. Mostly, artificial light does not include the colors of the rainbow and always maintain the same static condition throughout the day, whereas the dynamic structure of natural light radiates all colors of the rainbow. In the literature, various studies examined the effect of CCT of artificial light on people’s perception.
Viénot et al. (2009) examined the relationship between CCT, illuminance, and visual response. In this study, the following Kelvin degrees were observed; 2700K, 4000K, and 6500K with 150lx, 300lx, and 600lx respectively. Results indicated that higher CCTs were associated with feelings of brightness and clearness, while lower CCTs evoked feelings of relaxation, pleasantness, warmth, and comfort. Furthermore, Ju et al. (2011) investigated the influence of CCT on spatial brightness perception. Nine experimental lighting settings with different CCTs (3000K, 5000K, and 8000K) and illuminance levels (1000lx, 300lx, and 100lx) were developed for the experiment. Results indicated a significant relationship between CCT and spatial brightness perception, where high CCTs enabled a better spatial brightness perception. These results consist with Kim et al.’s (2014) study, where results indicated that for the
33
In a later study, Baniya et al. (2015) investigated preferences in terms of illuminance level and CCT in an office room. The study developed random ordered combinations with the following CCTs 3000K, 4000K, and 5000K and illuminance levels 300lx, 500lx, and 750lx. Results indicated that the most preferred combination was for CCT 4000K with illuminance level correspondent to 750lx. Also, results demonstrated that for higher CCTs, participants perceived the room as more bright and felt more stimulated. Another study by Wang et al. (2017) found that CCT had a significant influence on the people’s subjective comfort and preferences, where high CCTs
provoked relaxing activities, whereas lower CCTs provoked tense activities. Huang et al. (2014) examined the influence of CCT on focused and sustained attention, where 3 different CCTs were studied (2700K, 4300K, & 6500K). Findings indicated that CCT had a significant influence on focused and sustained attention and that 4300K provoked better attention.
Rautkyla et al. (2010) examined the influence of CCT on daytime alertness in a lecture setting. Two CCTs were studied (4000K & 17000K); the experiment was conducted on two phases during spring and autumn. Participants reported their alertness level on a 9-point scale at the start and end of each lecture session. The findings indicated that, in spring, CCT had no significant influence on alertness, however, in autumn, CCT demonstrated a significant influence on alertness. Results also demonstrated that, when compared with 4000K setting, the subjects in the 17000K setting reported greater alertness levels.
Therefore, the literature demonstrated that higher CCT induced the perception of brightness and feelings of arousal, whereas lower CCT of light induced the feelings