MULTI-SENSOR BASED AMBIENT
ASSISTED LIVING SYSTEM
a thesis
submitted to the department of electrical and
electronics engineering
and the graduate school of engineering and science
of bilkent university
in partial fulfillment of the requirements
for the degree of
master of science
By
Ahmet Yazar
I certify that I have read this thesis and that in my opinion it is fully adequate, in scope and in quality, as a thesis for the degree of Master of Science.
Prof. Dr. A. Enis C¸ etin (Advisor)
I certify that I have read this thesis and that in my opinion it is fully adequate, in scope and in quality, as a thesis for the degree of Master of Science.
Prof. Dr. Billur Barshan
I certify that I have read this thesis and that in my opinion it is fully adequate, in scope and in quality, as a thesis for the degree of Master of Science.
Assoc. Prof. Dr. ˙Ibrahim K¨orpeo˘glu
ABSTRACT
MULTI-SENSOR BASED AMBIENT ASSISTED LIVING
SYSTEM
Ahmet Yazar
M.S. in Electrical and Electronics Engineering Supervisor: Prof. Dr. A. Enis C¸ etin
July, 2013
An important goal of Ambient Assisted Living (AAL) research is to contribute to the quality of life of the elderly and handicapped people and help them to maintain an independent lifestyle with the use of sensors, signal processing and the available telecommunications infrastructure. From this perspective, detection of unusual human activities such as falling person detection has practical applica-tions. In this thesis, a low-cost AAL system using vibration and passive infrared (PIR) sensors is proposed for falling person detection, human footstep detec-tion, human motion detecdetec-tion, unusual inactivity detecdetec-tion, and indoor flooding detection applications. For the vibration sensor signal processing, various fre-quency analysis methods which consist of the discrete Fourier transform (DFT), mel-frequency cepstral coefficients (MFCC), discrete wavelet transform (DWT) with different filter-banks, dual-tree complex wavelet transform (DT-CWT), and single-tree complex wavelet transform (ST-CWT) are compared to each other to obtain the best possible classification result in our dataset. Adaptive-threshold based Markov model (MM) classifier is preferred for the human footstep detec-tion. Vibration sensor based falling person detection system employs Euclidean distance and support vector machine (SVM) classifiers and these classifiers are compared to each other. PIR sensors are also used for falling person detection and this system employs two PIR sensors. To achieve the most reliable system, a multi-sensor based falling person detection system which employs one vibration and two PIR sensors is developed. PIR sensor based system has also the capabil-ity of detecting uncontrolled flames and this system is integrated to the overall system. The proposed AAL system works in real-time on a standard personal computer or chipKIT Uno32 microprocessors without computers. A network is setup for the communication of the Uno32 boards which are connected to
dif-iv
via telephone lines. The resulting AAL system is a low-cost and privacy-friendly system thanks to the types of sensors used.
Keywords: Ambient assisted living, vibration sensor, passive infrared sensor,
¨
OZET
C
¸ OKLU ALGILAYICI TABANLI C
¸ EVRE DESTEKL˙I
YAS
¸AM S˙ISTEM˙I
Ahmet Yazar
Elektronik ve Elektronik M¨uhendisli˘gi, Y¨uksek Lisans Tez Y¨oneticisi: Prof. Dr. A. Enis C¸ etin
Temmuz, 2013
C¸ evre destekli ya¸sam ara¸stırmalarının amacı, ya¸slı ve bakıma muhta¸c ki¸silerin ya¸sam kalitelerine katkıda bulunabilmektir. Algılayıcıların, i¸saret i¸sleme y¨ontemlerinin ve halihazırdaki ileti¸sim altyapısının kullanılmasıyla bu ki¸siler i¸cin ¨
ozg¨ur bir ya¸sam bi¸cimi sa˘glanabilecektir. Bu bakı¸s a¸cısıyla, d¨u¸sen ki¸si ¨orne˘gi gibi ola˘gandı¸sı insan hareketlerinin tespit edilebilmesinin kullanı¸slı uygulamaları bulunmaktadır. Bu tezde, titre¸sim ve pasif kızılberisi algılayıcıları kullanılarak d¨u¸s¨uk maliyetli bir ¸cevre destekli ya¸sam sistemi ¨onerilmi¸stir. Alt sistemler; d¨u¸sen ki¸si tespiti, insan adımı tespiti, hareket/hareketsizlik tespiti ve bina i¸ci su ta¸skını tespiti uygulamalarından olu¸smaktadır. Titre¸sim algılayıcının frekans i¸ceri˘ginden ¨
oznitelik ¸cıkarımı yapabilmek i¸cin ayrık Fourier d¨on¨u¸s¨um¨u, mel-frekansı kepstral katsayıları, ayrık dalgacık d¨on¨u¸s¨um¨u, ¸cift a˘ga¸c karma¸sık dalgacık d¨on¨u¸s¨um¨u ve tek a˘ga¸c karma¸sık dalgacık d¨on¨u¸s¨um¨u y¨ontemleri veri k¨umemiz ¨uzerinde en iyi sınıflandırma sonucunu sa˘glayabilmek i¸cin birbirleriyle kar¸sıla¸stırılmı¸stır. ˙Insan adımı tespiti i¸cin, uyarlanabilir e¸sik de˘gerli Markov modelleri sınıflandırıcısı tercih edilmi¸stir. Titre¸sim algılayıcı tabanlı d¨u¸sen ki¸si tespiti uygulamasında Euclidean uzaklı˘gı ve destek vekt¨or makineleri sınıflandırıcıları kullanılmı¸stır. Bu sınıflandırıcı y¨ontemlerinin aralarında kar¸sıla¸stırma yapılmı¸stır. ˙Iki tane pasif kızılberisi algılayıcı aynı anda kullanılarak farklı bir d¨u¸sen ki¸si tespiti yakla¸sımı geli¸stirilmi¸stir. Sonrasında, titre¸sim algılayıcı ve iki tane pasif kızılberisi algıyacısının birlikte kullanıldı˘gı daha g¨uvenilir bir d¨u¸sen ki¸si tespiti uygulaması tanıtılmı¸stır. Daha ¨onceki ¸calı¸smalardan olan kontrols¨uz alev tespiti sistemi, ¸cevre destekli akıllı ev tasarımına dahil edilmi¸stir. ¨Onerilen sistem ger¸cek zamanlı olarak standart bir bilgisayarda ya da chipKIT Uno32 mikroi¸slemciler ¨uzerinde ¸calı¸sabilmektedir. Her bir algılayıcıya ba˘glı Uno32 i¸slemciler i¸cin bir a˘g kurularak
vi
dı¸sındaki istenen bir merkeze iletebilmektedir. Bu ama¸cla otomatik aramalı alarm sistemi geli¸stirilmi¸stir.
Anahtar s¨ozc¨ukler : C¸ evre destekli ya¸sam, titre¸sim algılayıcı, pasif kızılberisi algılayıcı, karma¸sık dalgacık d¨on¨u¸s¨um¨u, destek vekt¨or makineleri, d¨u¸sen ki¸si
Acknowledgement
I would like to express my gratitude to my supervisor Prof. Dr. A. Enis C¸ etin for his guidance, encouragement, and useful comments and remarks throughout the development of this thesis.
Furthermore, I would like to offer my special thanks to Prof. Dr. Billur Barshan and Assoc. Prof. Dr. ˙Ibrahim K¨orpeo˘glu for accepting to read and review this thesis.
I wish to thank Osman G¨unay for his great help in solving many problems. Thanks to Furkan Keskin for sharing his ST-CWT works and his friendship.
I would also like to thank Kıvan¸c K¨ose who have willingly shared his precious time whenever I need to consult him. I would also like to thank ˙Ihsan ˙Ina¸c for sharing his knowledge about the hardwares used in this work.
My thanks are extended to Onur Yorulmaz, Serdar C¸ akır, O˘guzcan Dobrucalı, Necip G¨urler, Akın Sevimli, and Alexander Suhre for their collaboration and constructive friendship.
I would like to specially thank Hasan H¨useyin Erkaya who supported me all the way through my undergraduate years at Eski¸sehir. He has become and is more than a teacher for me.
I would like to acknowledge valuable support of my mother whose warm-hearted and encouraging spirit always refreshed me, and my father whose I feel his firm support always with me.
Besides, I am grateful that Information and Communication Technologies Authority has given me opportunity to complete this thesis.
I would also like to express my appreciation to T ¨UB˙ITAK for providing schol-arship (B˙IDEB-2210) throughout my graduate study.
Contents
1 Introduction 1 1.1 Related Work . . . 2 1.2 Contribution . . . 4 1.3 Thesis Outline . . . 5 2 Hardware Implementations 6 2.1 Arduino Prototyping Platform . . . 72.2 The Vibration Sensor . . . 9
2.2.1 Sensor Properties . . . 9
2.2.2 Related Work . . . 10
2.2.3 Sensor Signal Processing . . . 11
2.3 The PIR Sensor . . . 12
2.3.1 Sensor Properties . . . 13
CONTENTS ix
2.4 Auto-Dial Alarm System . . . 17
2.5 Summary . . . 19
3 Feature Extraction from One-Dimensional Signals 20 3.1 Classical Signal Analysis Methods . . . 21
3.1.1 Discrete Fourier Transform . . . 22
3.1.2 Mel-Frequency Cepstral Coefficients . . . 23
3.1.3 Discrete Wavelet Transform . . . 23
3.1.4 Dual-Tree Complex Wavelet Transform . . . 24
3.2 Single-Tree Complex Wavelet Transform . . . 27
3.3 Shift-Invariance Property Based Comparison . . . 31
3.4 Computational Complexity Based Comparison . . . 39
3.5 Summary . . . 40
4 Ambient Assisted Living System Using Different Sensors 41 4.1 Datasets . . . 42
4.2 Human Motion and Unusual Inactivity Detection . . . 44
4.2.1 PIR Sensor Based Detection Algorithms . . . 44
4.2.2 Vibration Sensor Based Human Footstep Detection . . . . 47
4.3 Falling Person Detection . . . 51
CONTENTS x
4.3.3 Multi-Sensor Based Detection Algorithm . . . 64
4.4 Indoor Flooding Detection . . . 66
4.5 Stand-Alone Sensor Fusion Application . . . 67
4.6 Summary . . . 73
5 Conclusion and Future Work 74
List of Figures
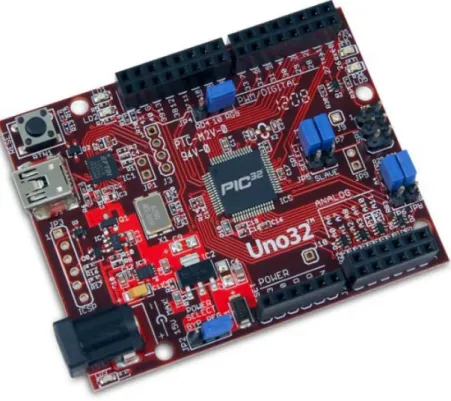
2.1 chipKIT Uno32 board. . . 8
2.2 Schematics presentations of internal structures of different vibra-tion sensors. . . 10
2.3 Stages of the vibration sensor signal processing. . . 11
2.4 10-second-long vibration sensor signal sample corresponding to a walking event. . . 12
2.5 Schematics illustration of internal structure of the PIR sensor which contains two reverse-connected pyroelectric sensing elements. 12
2.6 An example illustration to describe working mechanism of the PIR sensor. . . 13
2.7 Paradox Pro Plus 476+ (a) and schematics illustration of the Fres-nel lens on the detector box (b). . . 14
2.8 Top and side views of the range of PIR sensor, taken from Paradox 476+ datasheet. . . 15
2.9 Stages of the PIR sensor signal processing. . . 16
walk-LIST OF FIGURES xii
2.11 Application circuit for the HT9200A DTMF tone generator (a) and illustration of the auto-dial alarm system (b). . . 18
2.12 Auto-dial alarm system circuit board. . . 19
3.1 DFT of a two-second-long vibration sensor signal record of a falling person and boundary values of the related frequency sub-bands. . 22
3.2 Seven-level wavelet tree. . . 24
3.3 Seven-level complex wavelet tree. . . 25
3.4 Time-varying lifting scheme for the ST-CWT. . . 27 3.5 A unit step signal, and its four-sample and five-sample shifted
versions. . . 32
3.6 Third level wavelet coefficients of a unit step signal and its shifted versions for the Haar wavelet. . . 33
3.7 Third level wavelet coefficients of a unit step signal and its shifted versions for the Daubechies-2 wavelet. . . 34
3.8 Third level wavelet coefficients of a unit step signal and its shifted versions for the Daubechies-4 wavelet. . . 35
3.9 Third level wavelet coefficients of a unit step signal and its shifted versions for the Biorthogonal-3.3 wavelet. . . 36
3.10 Third level wavelet coefficients of a unit step signal and its shifted versions for the DT-CWT wavelet. . . 37 3.11 Third level wavelet coefficients of a unit step signal and its shifted
LIST OF FIGURES xiii
4.2 Flowchart of the PIR sensor based unusual inactivity detection algorithm. . . 46
4.3 Flowchart of the vibration sensor based human footstep detection algorithm. . . 49
4.4 Flowchart of the vibration sensor based falling person detection algorithm. . . 53
4.5 A walking man illustration to describe working mechanism of the two-PIR-sensor based falling person detection system. . . 60
4.6 A falling man illustration to describe working mechanism of the two-PIR-sensor based falling person detection system. . . 60
4.7 Flowchart of the two-PIR-sensor based falling person detection al-gorithm. . . 61
4.8 A sitting man illustration to describe working mechanism of the two-PIR-sensor based falling person detection system. . . 63
4.9 A sleeping man illustration to describe working mechanism of the two-PIR-sensor based falling person detection system. . . 63
4.10 Flowchart of the multi-sensor based falling person detection algo-rithm. . . 65
4.11 Flowchart for the vibration sensor based activity-output relation using three bits of data. . . 68
4.12 Flowchart for the two-PIR-sensor based activity-output relation using three bits of data. . . 69
4.13 Illustration for the dataflow between Uno32 boards using three bits of data. . . 71
LIST OF FIGURES xiv
4.14 An example smart home environment which has two vibration sen-sors, eight pair PIR sensen-sors, and three flooding detector circuits. . 72
List of Tables
3.1 Impulse response of Kingsbury’s eighth order q-shift analysis filters for the DT-CWT. They are normalized so that∑
n
h0[n] = 1. . . . 26
3.2 The exact number of real multiplications in the feature extraction methods we used. N = 1024 is the number of signal samples in each window; M = 8 is the number of the frequency sub-bands; p is the number of nonzero filter coefficients, and r = 7 is the number of the levels in a wavelet-tree. . . 40
4.1 Transition matrix for the human-footstep sourced signals. . . 47
4.2 Transition matrix for the other signal sources. . . 47
4.3 Confusion matrix for the human footstep detection system using testing dataset. . . 50
4.4 Confusion matrix for the human footstep detection system using all dataset. . . 50
4.5 Numbers of “true detection” versus “false alarm” for 1024-sample-long windows, using the Euclidean distance classifier. . . 54
4.6 Numbers of “true detection” versus “false alarm” for 1024-sample-long windows, using the SVM classifier. . . 54
LIST OF TABLES xvi
4.7 Numbers of the different classifications between the original sig-nals and 64-sample shifted version of the original sigsig-nals for 1024-sample-long vibration sensor signal windows, using the Euclidean distance classifier. . . 56
4.8 Numbers of the different classifications between the original sig-nals and 64-sample shifted version of the original sigsig-nals for 1024-sample-long vibration sensor signal windows, using the SVM clas-sifier. . . 56
4.9 Change amounts in the energy of the fourth level wavelet coeffi-cients or the corresponding frequency sub-band while shifting the 1024-sample-long vibration sensor signal windows. Lower num-bers mean that shift-invariance is provided better by the related frequency analysis methods. Experiment is repeated for 1000 dif-ferent signal windows and average values are given. . . 57
4.10 Confusion matrix for the vibration sensor based falling person de-tection system using the second dataset. This dataset is composed of one-minute-long records which correspond to the one sample for every one minute. . . 58
4.11 Confusion matrix for the two-PIR-sensor based falling person de-tection system using the second dataset. This dataset is composed of one-minute-long records which correspond to the one sample for every one minute. . . 62
4.12 Confusion matrix for the multi-sensor based falling person detec-tion system using the second dataset. This dataset is composed of one-minute-long records which correspond to the one sample for every one minute. . . 64
4.13 Confusion matrix for the vibration sensor based indoor flooding detection system. . . 66
Chapter 1
Introduction
Most European countries including Turkey will face a large increase in the number of elderly people in the near future. The development of intelligent homes will improve the quality of life of seniors and the handicapped people. As a result, a lot of studies are introduced to improve intelligent homes in the last ten years. It is possible to use different sensors to improve the quality of the elderly people’s lives.
It is reported that unexpected falling is a major problem and about one-third of people over 65 falls unexpectedly each year [1]. Fall related health and injury costs are on the order of billions of dollars worldwide. Additionally, unusual inactivity detection is also very important because of the sudden diseases like heart attacks. As a result, we focus on the falling person detection systems and decided that an ambient assisted living (AAL) system can be designed using vibration and PIR sensors for this purpose. This thesis presents a multi-sensor based AAL system which has the capability of falling person detection, human footstep detection, human motion detection, unusual inactivity detection, indoor flooding detection and uncontrolled flame detection. Correspondingly, various frequency analysis methods, different classifiers, and novel algorithms related with the subsystems are described. The main aim of the overall system is to transmit
1.1
Related Work
There are several different types of smart home designs in the literature [2]. Computer vision systems can be used to track the person and classify his/her movements in a house [3], [4]. In recent years, the number of the Kinect sensor based systems continue to increase for the smart home implementations [5], [6]. Wearable devices are often used in similar applications [7], [8], [9], [10]. There are also several different types of sensor network based systems in the literature [11], [12], [13], [14].
The available smart home applications can be categorized in two main groups: Ambient assisted systems and wearable systems. Ambient systems include com-puter vision based systems, Kinect sensor based systems, and different types of sensor network based systems [15]. Wearable systems are based on accelerom-eters, miniature inertial and magnet sensors [7], [8], [9], [10]. Computer vision based systems have generally low miss-detection rates and high number of false alarms because of the abundance of information in video processing. However, most people find having a camera in their houses invasion of their privacy, even if the video and sound recordings are not transmitted elsewhere. Also, the com-puter vision based systems need high computational power of processors and large number of cameras to handle blind spots. Additionally, there is a certain installation cost of the computer vision based system so the overall system can be defined as a high-cost system. Kinect sensor based systems have almost the same conditions with the computer vision based systems [4], [6], [15]. They are thought as more privacy friendly systems than the computer vision based systems but they are not completely privacy-friendly systems.
Currently, there are many available commercial products which are based on the wearable devices. The wearable systems have remarkable advantages. For example, these systems do not need any installation cost and there is only one module which is placed on the person. However, the main disadvantage of these systems is that wearing and/or carrying them is not convenient all the time and
Lastly, advantages and disadvantages of the sensor network based systems can vary accordingly to the sensor types and the number of the used sensors. Our vibration sensor and PIR sensor based system’s advantages are privacy-friendly, unnoticeable system to the person, only one-dimensional signal processing, and the system does not have a wearable component. The large number of the sensors and the certain installation cost can be considered as the disadvantages of our sensor network based system.
There are many other studies in the subsystem areas of our AAL system. The related works are examined for each of the detection systems one by one. As a start, a survey paper about principles and approaches for the falling person detection is published last year [15]. It is accepted that fall detection systems help elderly people to maintain an independent way of life [16], [17]. Currently, the commercially available fall detection systems feature body-worn sensors which are connected to a wireless network [18], [9]. There are other recent studies which turn a mobile phone into a fall detector [19]. Computer vision and Kinect sensor based fall detectors are studied in various works [4], [6], [15]. Vibration sensor based fall detection systems are proposed in two studies so far [20], [21]. However, pattern recognition algorithms for fall detection are not described in the mentioned articles. Without a recognition algorithm the resulting system will not be a robust and practical system. There are also multi-PIR-sensor based fall detectors which use generally more than four PIR sensors [22], [23].
Human footstep or walking person detection is another application studied using different hardwares. Computer vision based systems can be used in mobile systems like pedestrian detection by a camera system in the car [24]. Vibra-tion sensor or seismic sensor based systems are used indoor and outdoor widely [25], [26]. Also, human footstep detection systems can be employed in the mili-tary applications [27]. Detection of the daily physical activities using a tri-axial accelerometer is another working area for the similar subjects [28]. Addition-ally, unusual inactivity detection systems are implemented using computer vision based and belt-worn kinematic sensor based systems [29], [30]. As a last
subsys-In the theoretical part of the thesis, various frequency analysis methods in-cluding the discrete wavelet transform (DWT) and the dual-tree complex wavelet transform (DT-CWT) are studied. The DT-CWT has recently emerged as a promising alternative to the classical DWT [32]. The DT-CWT has desirable properties such as shift-invariance and lack of aliasing however it still suffers from increased data rate in the transform domain. Several versions of the DT-CWT are proposed in the literature for reducing the computational complexity of the transform [33]. In [34], rational coefficient filters are designed and employed in lat-tice and lifting structures for efficient implementation of the DT-CWT however, dual-tree structure is retained. In [35], the authors propose a single-tree com-plex wavelet transform utilizing comcom-plex-valued filter-banks in the tree for face recognition, but this approach introduces complex arithmetic and it increases the amount of data as in the DT-CWT.
1.2
Contribution
One of the contributions of this thesis is the design of a real single-tree lifting-based wavelet transform that possesses complex wavelet-like characteristics, such as near shift-invariance and lack of aliasing. Unlike [34] in which dual-tree ap-proach is used, we design a single-tree lifting-based complex wavelet transform. Our filter-bank has time-varying update and prediction filters for lifting structures in the single-tree context. Time-varying nature of the proposed filters enables the implementation of half-sample delayed filters in a single tree in an interchangeable manner.
Our system is different from the currently available AAL systems. We propose to install both vibration and PIR sensors to an intelligent home to realize a robust system. These two different types of sensors complement each other and daily activities of seniors can be monitored without producing false alarms and unusual events like falling can be reliably detected. The resulting AAL system will be a low-cost and privacy-friendly system thanks to the types of sensors used.
Human footstep detection is succeed by using the adaptive-threshold based Markov model (MM) classifier. More importantly, three separate falling person detection algorithms are introduced in this thesis, and all of these falling person detection algorithms are novel. Also, the stand-alone AAL system using the vibration and two PIR sensors is described as an original study.
1.3
Thesis Outline
In Chapter 2, the microprocessor unit for the real-time system, the vibration sensor, the PIR sensor and the auto-dial alarm system via telephone lines are described. Various frequency analysis methods which consist of the DFT, MFCC, DWT, DT-CWT, and ST-CWT are introduced in Chapter 3. In Chapter 4, the subsystems of our AAL system, classification methods and experimental setups are described. Chapter 5 is the last chapter that concludes the thesis by providing an overall summary of the results and gives some ideas for the future works.
Chapter 2
Hardware Implementations
Sensor-based AAL systems can contain different equipments. These equipments may have various advantages and disadvantages. For a multi-sensor based smart home application, the system designer should take into account the characteristics of these individual components meticulously. In this chapter, sensors and other complementary components which we employed in the AAL system are described.
In Section 2.1, the microprocessor unit for the real-time system is intro-duced. Analog-to-digital conversion and other processes are all done on these microprocessor units. Vibration sensor and an analog-front-end circuit are de-scribed in Section 2.2. One-axis vibration sensor is used to sense vibrations on the floor. The PIR sensor and a modified sensor circuit are described in Section 2.3. PIR sensors are generally used in human motion detection based applications. Microcontroller-compatible auto-dial alarm system is presented in Section 2.4. Our auto-dial alarm system transmits the desired emergency alarms to a call center or to an operator via telephone lines.
2.1
Arduino Prototyping Platform
Arduino is a prototyping platform based on easy-to-use hardware and software [36]. All of the hardware and software are open-source for the Arduino protoyping platforms. There are several Arduino boards for different purposes. One of the modest one is Arduino Uno board. This electronics board is modernized by Digilent Inc. and chipKIT Uno32 board is developed as an Arduino-compatible platform. The Uno32 combines Arduino compatibility with the Microchip PIC32 microcontroller. 26.95 USD chipKIT Uno32 board is shown in Figure 2.1. The Uno32 electronics board has the following properties [37]:
• Microchip PIC32MX320F128H microcontroller (80 MHz 32-bit MIPS, 128K
Flash, 16K SRAM),
• Compatible with many existing Arduino code samples and other resources, • Arduino Uno form factor,
• Compatible with many Arduino shields, • 42 available I/O pins,
• Two user LEDs,
• PC connection uses a USB A > mini B cable, • 12 analog inputs (10-bit resolution ADC), • 3.3 V operating voltage,
• 80 MHz operating frequency, • 75 mA typical operating current, • 7 V to 15 V input voltage,
Figure 2.1: chipKIT Uno32 board.
The Arduino programming language is based on C/C++. Arduino IDE or Dig-ilent’s own IDE can be used to program the chipKIT boards. Digilent Inc. de-velopes MPIDE (Multi Platform Integrated Development Environment) which is a modified version of the Arduino IDE. MPIDE is compatible with Digilent’s boards and native Arduino boards. We used MPIDE to program the chipKIT Uno32 board.
The Uno32 board is employed as an analog-to-digital converter while devel-oping algorithms with MATLAB on a personal computer. Analog signals of the vibration and PIR sensors are digitized with 8-bit resolution using the Uno32 board. Next, all algorithms are implemented on the Uno32 board without a per-sonal computer. An auto-dial alarm module also works compatible with the mi-crocontrollers including Arduino boards. The overall AAL system is implemented as a stand-alone project quite easily thanks to the chipKIT Uno32 prototyping
2.2
The Vibration Sensor
Vibration sensors are also called as a seismic sensor, seismometer or geophone. In literature, “seismic” and “geophone” words are generally used in the geophysics-related articles. In this thesis, we prefer “vibration” instead of “seismic” and “geophone” to prevent possible misunderstandings.
We employ the vibration sensor with the aim of sensing the vibrations on the floor. The vibration sensor converts vibrations into electrical signals depending on the intensity of the vibration waves in the axis of the vibration sensor.
Vibration sensors can be categorized into two groups based on the number of their axes: One-axis and three-axis sensor types. We used one-axis vibration sensor in this thesis to analyze vibrations in up-down axis.
2.2.1
Sensor Properties
Schematics presentation of internal structure of the vibration sensor is presented in Figure 2.2. The vibration sensor is basically formed by a sensing coil, springs, and a fixed magnet. The sensing coil moves in up-down axis with the help of springs when there is a vibration. While the coil moves along an axial mag-netic field provided by a fixed magnet, an electrical signal is produced in direct proportion to the intensity of the vibration waves [38]. The bottom of the vibra-tion sensor must be in contact with the floor to convert vibravibra-tions into electrical signals.
In this thesis, we used a GS-20DX vibration sensor which is manufactured by OYO Technologies. This sensor can detect vibration signals from distances up to 25 meters. The height, the diameter, and the weight of the GS-20DX vibration sensor are 3.30 cm, 2.54 cm, and 87.3 g, respectively. Its price is about 25.00 USD.
(a) (b)
Figure 2.2: Schematics presentations of internal structures of different vibration sensors. The left figure (a) is taken from [38], and the right figure (b) is taken from [39].
2.2.2
Related Work
There are several different studies related with vibration sensors. Footstep de-tection applications have an important place in these studies [40], [41], [42]. The aim of the footstep detection is generally related with security applications and military missions. Vibration sensors are suitable for these tasks because they can be hidden easily and they do not need a viewing angle to sense the environment.
Vibration sensors are used in the classification of pistachio nuts and their kernels [43]. In these types of works, sensor model should be selected as more sensitive to impact. Another study is about classification of vehicles [44]. As it is seen from vibration sensor based applications, vibration sensors have a wide range of usage by different industries. Everything generates vibration while moving. Therefore, vibration sensors may be used to classify movement activities.
Figure 2.3: Stages of the vibration sensor signal processing.
2.2.3
Sensor Signal Processing
A GS-20DX vibration sensor does not contain any filtering and amplification circuits. The vibration sensor produces a very small electrical voltage. Therefore, output signal of the vibration sensor needs to be filtered and amplified before further signal processing operations.
An analog-front-end circuit is implemented inspired by the analog circuit ex-ample in [41]. Our circuit contains an RC low-pass filter (fc= 15 kHz) to prevent
RF noise, an active low-pass filter (fc = 200 Hz) to prevent aliasing, and a RC
high-pass filter (fc = 0.98 Hz) to prevent DC signals. At the last stage,
ampli-fication is done with 50 dB of gain in 0-2.5 V voltage range. All filtering and amplification stages are presented in Figure 2.3. The analog-front-end circuit’s energy is derived by Arduino Uno32 board’s 5 V output.
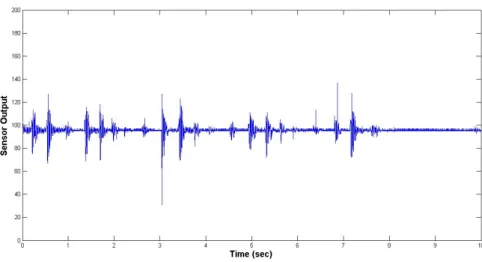
After reaching an appropriate analog signal, analog-to-digital conversion is im-plemented. Analog vibration signals are sampled at a rate of 500 Hz and digitized with 8-bit resolution using Arduino Uno32 board. An example vibration sensor signal is presented in Figure 2.4. This is a raw signal without pre-processing. The y axis is proportional to the voltage value of the analog signal.
Figure 2.4: 10-second-long vibration sensor signal sample corresponding to a walking event.
2.3
The PIR Sensor
Generally, there are two types of infrared sensors: Active and passive. Active in-frared sensors emit inin-frared radiation and monitor changes in the received power [45]. On the contrary, passive infrared (PIR) sensors only measure infrared radia-tion, rather than emitting it. In literature, PIR also refers to pyroelectric infrared because most PIR sensors are basically made of pyroelectric materials. In this thesis, we prefer using “passive infrared” instead of “pyroelectric infrared”.
Figure 2.5: Schematics illustration of internal structure of the PIR sensor which contains two reverse-connected pyroelectric sensing elements, taken from [46].
Figure 2.6: An example illustration to describe working mechanism of the PIR sensor, taken from [46].
Objects that generate heat also generate infrared radiation [46]. Every object emits some low level infrared radiation but hotter ones emit more infrared radi-ation than others. Infrared radiradi-ation cannot be seen by human eye but it can be detected by a PIR sensor. PIR sensors work entirely by sensing the infrared radi-ation emitted by other objects. Generally, PIR sensors are used to sense motion, specially human motion. It should be also pointed out that PID (passive infrared detector) abbreviation is rarely used for the PIR-based motion detectors.
2.3.1
Sensor Properties
Infrared radiation is absorbed by the crystalline material in the PIR sensor and converted to heat [47]. Pyroelectric material in a PIR sensor gives an electrical response to the rate of change in the heat which is related with the rate of change in the infrared radiation.
(a) (b)
Figure 2.7: Paradox Pro Plus 476+ (a) and schematics illustration of the Fresnel lens on the detector box (b). The right figure (b) is taken from [46].
PIR sensors usually contain two reverse-connected pyroelectric sensing ele-ments as shown in Figure 2.5. These two sensing eleele-ments eliminate the noise caused by vibration, temperature changes and sunlight by producing signals in different directions. For example, if the room temperature changes suddenly, two sensing elements neutralize each other and the output of the PIR sensor remains as a flat signal. The heat source must pass across the PIR sensor in a horizontal direction to activate the sensing elements sequentially as presented in Figure 2.6 [46]. In this way, the strength of the PIR sensor signal is increased by a human motion in the viewing range of the PIR sensor.
In this thesis, Paradox Pro Plus (476+) PIR-based motion detector is used with a simple modification. Modification details are presented in Section 2.3.3. On the outside surface of the detector box, a Fresnel lens is placed to condense the light to provide a larger range of infrared sensing capability to the PIR sensor. De-tector box and schematics illustration of the Fresnel lens are shown in Figure 2.7. This Fresnel lens’s infrared transmitting material has an infrared transmission range of 8 to 14 µm which is the most sensitive range to human body infrared radiation [46]. The range of the detector is up to 11 meters with 110◦ viewing angle as presented in Figure 2.8. The price of Paradox 476+ detector is about 5.00 USD.
Figure 2.8: Top and side views of the range of PIR sensor, taken from Paradox 476+ datasheet.
2.3.2
Related Work
There are several different studies related with PIR sensors. These studies are generally based on motion detection. Automatic lighting applications are widely used to turn on the lights when motion is detected and turn off the lights when the motion is not detected. Studies for the low power consumption lighter, automatic dimming level adjuster, and automatic room light intensity detector are made in recent years [48], [49], [50]. PIR sensors can be used in various alarm systems for security purposes [51], [52]. Multi-sensor based human localization and tracking applications are developed in [53], [54]. There are also people counting systems implemented using PIR sensor arrays [55], [56].
Some of the other example works are uncontrolled flame detection, gas leak detection, and vehicle monitoring systems [57], [58], [59], respectively. As it is seen, PIR sensor based applications have a wide range of usage for different purposes. Every objects emit some low level infrared radiation. Therefore, PIR sensors can be used to classify motions of different objects which have different heat levels and/or different amount of movements.
Figure 2.9: Stages of the PIR sensor signal processing.
2.3.3
Sensor Signal Processing
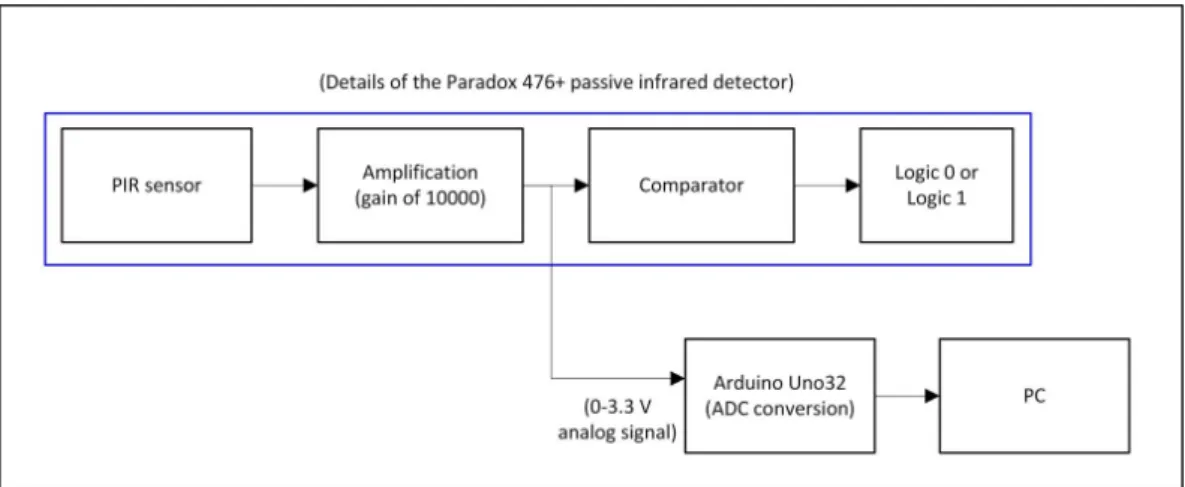
Actually, Paradox 476+ is a PID which gives an output of logical one if there is a human motion activity and an output of logical zero if there is not any motion activity within the viewing range of the PIR sensor. As it can be seen from Figure 2.9, sensor signal is amplified before any operation. After the amplification stage, the signal is converted to pulses and output signal is given as logical zero or logical one. However, using only 1-bit digital signal limits the abilities of the PIR sensor. Therefore, we modified the related circuit and take the output of amplification stage as an analog signal. By this way, we can apply different algorithms to amplified analog PIR sensor signal instead of using 1-bit digital signal.
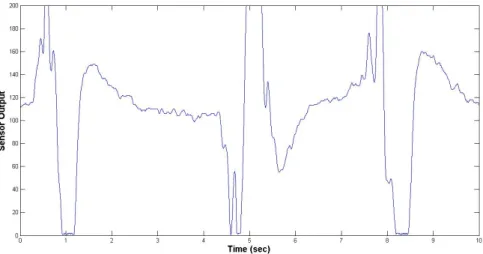
In this thesis, analog PIR sensor signals are sampled at a rate of 100 Hz and digitized with 8-bit resolution using Arduino Uno32 board. An example PIR sensor signal is presented in Figure 2.10. The y axis is proportional to the voltage value of the analog signal. 12 V DC adapter is used to feed Paradox 476+ PIR-based motion detector.
Figure 2.10: 10-second-long PIR sensor signal sample corresponding to a walking event.
2.4
Auto-Dial Alarm System
An auto-dial alarm system is developed to inform emergency units via telephone lines when there is an emergency situation. For example, if there is an uncon-trolled flame in the house, the detection system produces an alarm and firefighters are informed automatically by the auto-dial alarm system. As another example, if a falling person is detected in the house, a call center is informed by the auto-dial alarm system. Then, the call center calls the house to confirm the likelihood so that if the phone call is not answered and judgement is made that there is a falling person. Consequently, if the call remains unanswered then, the call center informs the hospital immediately. As it is seen, the auto-dial alarm system is a connector between the house and emergency units.
In our auto-dial alarm system implementation, chipKIT Uno32 and microcontroller-compatible HT9200A DTMF tone generator integrated circuit are used as shown in Figure 2.11. The HT9200A is designed for microcontroller interfaces and it can be instructed by a microcontroller to generate 16 dual and 8 single tones from the DTMF pin. The HT9200A employ a data input, a 5-bit
(a) (b)
Figure 2.11: Application circuit for the HT9200A DTMF tone generator (a) and illustration of the auto-dial alarm system (b).
data [60]. A constant phone number is stored and used by the Uno32 board in our tests.
The block diagram of the overall auto-dial alarm system is shown in Fig-ure 2.11 (b). The auto-dial alarm system is triggered by the related detection systems. If there is an emergency situation, the telephone line is turned on by Uno32 board and a simple relay circuit. Meanwhile, Uno32 board also sends the telephone number as bits and HT9200A DTMF tone generator starts to send DTMF tones to the telephone line. HT9200A DTMF tone generator converts the bits into DTMF tones and these tones are amplified before sending to the telephone line. Isolation transformer is used between the tone signals and tele-phone line because teletele-phone lines have not any reference grounds. Therefore, we need an isolation transformer to provide a reference ground in the system. After the calling the telephone number in a desired duration, the system closes the telephone line.
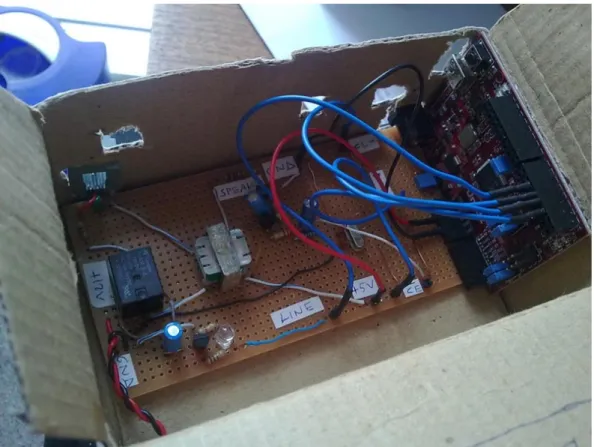
Different applications can be implemented to understand the reason of an alarm. For example, different telephone numbers can be called for the different emergency situations. Or, ringing times can be varied for the different alarms. Our auto-dial alarm system implementation is presented in Figure 2.12.
Figure 2.12: Auto-dial alarm system circuit board.
2.5
Summary
In this chapter, sensors and other complementary hardwares employed in our AAL system are described. Arduino-compatible chipKIT Uno32 boards are used to process sensor signals and implement the other control parts of the system. In-ternal structures and properties of the vibration and PIR sensors are introduced. Microcontroller-compatible auto-dial emergency alarm system is proposed. In the next chapters, theoretical methods and detection algorithms are introduced as a connection between the digitized analog sensor signals and the auto-dial alarm system for land-line telephone systems.
Chapter 3
Feature Extraction from
One-Dimensional Signals
In this chapter, different frequency analysis methods from one-dimensional signals are studied and compared to each other. These frequency analysis methods are employed for the vibration sensor signal processing in the next chapter. Discrete Fourier transform (DFT), mel-frequency cepstral coefficients (MFCC), discrete wavelet transform (DWT), and dual-tree complex wavelet transform (DT-CWT) based feature extraction methods are reviewed in Section 3.1. We use C instead of C for the complex number symbol because C is generally used in the meaning of “continuous” for the CWT abbreviation [61]. In Section 3.2, single-tree com-plex wavelet transform (ST-CWT) method using time-varying lifting structure is described and compared with the classical methods reviewed in Section 3.1. At the same time, two-second-long vibration sensor signal windows are examined to extract features using these signal analysis methods.
For the DT-CWT, two different filter-banks are executed in parallel to ana-lyze a given input signal, which increases the amount of data after analysis. In the proposed ST-CWT structure, filters of the lifting filter-bank switch back and forth between the two analysis filters of the DT-CWT. This approach does not
increase the amount of output data as the time-varying lifting structure is a criti-cally sampled transform and it has the desirable properties of the DT-CWT such as shift-invariance and lack of aliasing. Shift-invariance properties of the signal analysis methods are compared to each other in Section 3.3. In Section 3.4, com-putational complexity based comparison between the frequency analysis methods is presented.
3.1
Classical Signal Analysis Methods
Classical frequency analysis methods; DFT, MFCC, DWT, and DT-CWT are employed to analyze frequency content of the vibration sensor signal.
A sample of two-second-long sensor signal and the frequency sub-bands of this signal are presented in Figure 3.1. In this thesis, eight frequency sub-bands are used for the all frequency analysis methods. Boundary frequencies of these sub-bands are fs/256, fs/128, fs/64, fs/32, fs/16, fs/8, fs/4, and fs/2 which
correspond to 1.95, 3.91, 7.81, 15.63, 31.25, 62.5, 125, and 250 Hz, respectively, with the sampling frequency fs = 500 Hz. Sub-band energies of the eight
fre-quency sub-bands are computed and used as eight feature parameters for the classification purposes.
It is observed that most of the vibration sensor signal energy is concentrated in low-frequency bands. Hence, more emphasis is given to lower frequencies by assigning more sub-bands to them. For the all frequency analysis methods, the same frequency boundaries are used for the sub-bands so that comparison between the frequency analysis methods can be done more appropriately. Shift-invariance property based comparison and computational complexity based comparison are made between the classical frequency analysis methods and the ST-CWT method in Section 3.3 and 3.4, respectively.
Figure 3.1: DFT of a two-second-long vibration sensor signal record of a falling person and boundary values of the related frequency sub-bands.
3.1.1
Discrete Fourier Transform
The DFT divides the input signal into angular frequency sub-bands [0, π/128], [π/128, π/64], [π/64, π/32], [π/32, π/16], [π/16, π/8], [π/8, π/4], [π/4, π/2], and [π/2, π] which correspond to [0, 1.95], [1.95, 3.91], [3.91, 7.81], [7.81, 15.63], [15.63, 31.25], [31.25, 62.5], [62.5, 125], and [125, 250] Hz bands, respectively. As mentioned before, more emphasis is given to lower frequencies by assigning more sub-bands to them. Energy values, G(m), of the eight frequency sub-bands are computed with Eq. 3.1 and used as eight feature parameters:
G(m) = ∑
k∈B(m)
|X(k)|2
(3.1)
where X(k) is the DFT of the input signal and represents the mth frequency band, for m = 1, . . . , 8. For the 1024-point DFT, B(m) represents the indices of sub-band boundaries [1, 4], [5, 8], [9, 16], [17, 32], [33, 64], [65, 128], [129, 256],
3.1.2
Mel-Frequency Cepstral Coefficients
Mel-cepstrum is widely used in speech and image processing [62], [63], [64]. Most of the vibration sensor signal energy is concentrated in low-frequency sub-bands therefore MFCC can be considered as an appropriate candidate for feature ex-traction from vibration sensor signal because the frequency decomposition of the MFCC is logarithmic giving more emphasis to lower frequencies compared to higher frequencies.
As pointed out in Section 3.1.1 after computation of the DFT of the input signal window, energies of the frequency sub-bands are calculated with Eq. 3.1. Eight feature parameters are extracted by finding eight mel-frequency cepstral coefficients, C(u), with the following formula using the discrete cosine transform (DCT):
C(u) = DCT−1{log (G(m))} , u = 1, . . . , 8 (3.2) The eight mel-frequency cepstral coefficients are used as eight feature parameters for the classification purposes.
3.1.3
Discrete Wavelet Transform
Seven-level DWT is applied to the input signal using one of the wavelets: Haar, Daubechies-2, Daubechies-4, or Biorthogonal-3.3. The Daubechies-4 wavelet has low-pass filter coefficients h0[n] = {0.0106, 0.0329, 0.0308, -0.1870, -0.0280,
0.6309, 0.7148, 0.2304}, and high-pass filter coefficients h1[n] = {0.2304, 0.7148,
-0.6309, -0.0280, 0.1870, 0.0308, -0.0329, -0.0106}.
As shown in Figure 3.2, in a seven-level wavelet tree the sub-signal x0[n] comes
from [0, π/128], x1[n] comes from [π/128, π/64], x2[n] comes from [π/64, π/32],
. . . , and x7[n] comes from [π/2, π] frequency sub-bands of the input signal x[n],
respectively. Feature parameters are extracted by finding the energies of resulting frequency sub-bands. The feature vector for the input signal is defined as follows:
Figure 3.2: Seven-level wavelet tree.
3.1.4
Dual-Tree Complex Wavelet Transform
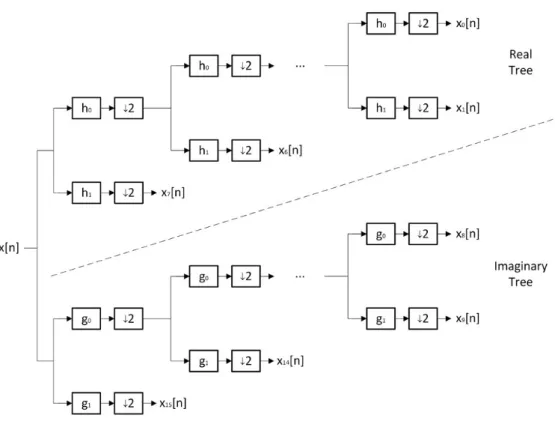
The DT-CWT has recently emerged as a promising alternative to the classical DWT for a variety of signal processing tasks [32]. The classical DWT has sev-eral limitations hampering its effectiveness in signal and image analysis, such as time-variance and lack of directionality [61]. It is well-known that the discrete wavelet coefficients may change significantly when the input is shifted slightly. To overcome such limitations of DWT, the DT-CWT is proposed whereby two filter pairs are used in parallel to decompose a given signal [65]. In contrast to the real DWT, two sets of filters are employed in the two wavelet trees, which are called real and imaginary trees, respectively. The implementation scheme of a seven-level complex wavelet tree is proposed in Figure 3.3. As it can be seen from this figure, two different DWTs are executed in parallel in dual-tree structure where the real part of DT-CWT is provided by the first one and the imaginary part by the second one.
Figure 3.3: Seven-level complex wavelet tree.
Analyticity allows one-dimensional DT-CWT to be approximately shift-invariant and free of aliasing artifacts often encountered in DWT-based process-ing. Hence, the reasoning behind the use of dual-tree is obtaining an analytic complex wavelet ψc(t) through the formula:
ψc(t) = ψh(t) + jψg(t) (3.4)
where ψh(t) and ψg(t) denote wavelet functions of real and imaginary trees,
re-spectively. If ψc(t) is approximately analytic (has support on only one-side of the
frequency axis), the resulting transform can possess shift-invariance and lack of aliasing properties just like the Fourier transform whose complex basis functions are analytic [61]. For ψc(t) to be approximately analytic, it is required that one
Table 3.1: Impulse response of Kingsbury’s eighth order q-shift analysis filters for the DT-CWT. They are normalized so that∑
n h0[n] = 1. Analysis h0 h1 g0 g1 filters Q-shift 0.0248 -0.0808 -0.0808 -0.0248 0 0 0 0 filter -0.0624 0.4155 0.4155 0.0624 coefficients 0.1653 -0.5376 0.5376 0.1653 0.5376 0.1653 0.1653 -0.5376 0.4155 0.0624 -0.0624 0.4155 0 0 0 0 -0.0808 -0.0248 0.0248 -0.0808
In order to satisfy the condition in Eq. 3.5, low-pass analysis filters in real and imaginary trees must be offset approximately by half-sample [66]:
g0[n]≈ h0[n− 0.5] (3.6)
In the literature, two low-pass filters are jointly designed such that half-sample delay, perfect reconstruction and finite support conditions are simultaneously satisfied, using several filter design methods [61]. We focused on the q-shift filter design in this thesis and employ them to obtain time-varying lifting filters. Analysis q-shift filters for real and imaginary trees are shown in Table 3.1 [67].
In feature extraction stage, energies of the eight frequency sub-bands of each wavelet tree are used as totally 16 feature parameters. In other words, eight features are obtained from the real part of the complex wavelet and the other eight features are obtained from the imaginary part. As it can be seen from our example, DT-CWT suffers from increased data rate in the transform domain. The redundancy factor resulting from DT-CWT decomposition of a d-dimensional signal is 2d [68]. In the next section, the ST-CWT method is introduced to
x[n] z-1 2 2 + + L x x [n] ^ H x [n] x ^ L x x [n] H x [n] x 1 U1 U2 P1 P2 - -0.5
Figure 3.4: Time-varying lifting scheme for the ST-CWT.
3.2
Single-Tree Complex Wavelet Transform
We designed real-valued lifting filters to be used in the single-tree context to ob-tain a transform that is approximately complex in the sense of DT-CWT without causing redundancy and a computational burden [69], [70], [71]. The implemen-tation scheme of our real-valued ST-CWT design is shown in Figure 3.4.
In Figure 3.4, U1,2(z) and P1,2(z) denote two different sets of update and
prediction filters, respectively. Since the aim is to construct an approximately complex wavelet transform using only one tree, the first update filter U1(z) must
correspond to the low-pass analysis filter of the real tree h0[n] and the second
update filter U2(z) must correspond to the low-pass analysis filter of the imaginary
tree g0[n], of DT-CWT, respectively.
Even and odd samples of the sub-signal xL[n] are obtained using u1[n] and
u2[n], respectively. Similarly, even and odd samples of xH[n] are obtained using
p1[n] and p2[n], respectively. Using u1 and u2 in a sequentially switched manner
ˆ
xH[n] through a lazy filter-bank. Even-indexed samples of ˆxL[n] are updated by
U1(z) and odd-indexed samples of ˆxL[n] are updated by U2(z). Let ˜h1[n] and
˜
h2[n] denote the effective half-band low-pass filters processing the input signal
x[n] before downsampling. Their z-transforms are given by
˜
H1(z) = 1/2 + z−1U1(z2) (3.7)
˜
H2(z) = 1/2 + z−1U2(z2) (3.8)
We designed filters U1(z) and U2(z), or equivalently ˜H1(z) and ˜H2(z) using the
following constraints so that the resulting transform is approximately complex:
(i) Since ˜hi[n] is a half-band filter, ˜hi[2n] = 0 for n ̸= 0, i = 1, 2, for perfect
reconstruction in a lifting structure.
(ii) Filters ˜h1[n] and ˜h2[n] must have approximate group delays of 1/4 and 3/4,
respectively so that there exist 0.5 delay difference between the two filters [34].
(iii) Filters∑ H˜1(z) and H˜2(z) must have a zero at z = −1, that is,
n
˜
hi[n](−1)n = 0 for i = 1, 2 so that ˜Hi(ejw) = 0 at w = π.
Based on the constraint (i) the 7-th order FIR filter should be in the following form:
˜
h1[n] ={α1, 0, α2, α3, α4, 0, α5} (3.9)
where α3 denotes the coefficient at n = 0. We can use the three dominant center
coefficients of h0 from Table 3.1 to obtain α2, α3 and α4 as follows
α2 = 0.1538, α3 = 0.5, α4 = 0.3864 (3.10)
which are scaled versions of h0[3], h0[4], and h0[5], respectively. Since the filter
To satisfy the constraint (iii), we need
α3−
∑
i̸=3
αi = 0 (3.12)
which is already satisfied by setting α3 = 0.5. The final constraint to satisfy is
the half-sample delay the constraint (ii). The group delay of the filter ˜h1[n] is
given by
τg(w) =−
∂ϕ(w)
∂w (3.13)
where ϕ(w) = arg{ ˜H1(ejw)} is the phase of the DTFT of ˜h1[n]. The frequency
response of ˜h1[n] is given by:
˜ H1(ejw; α1) = α1e3jw + 4 ∑ i=2 αie(3−i)jw+ (−0.0402 − α1)e−3jw (3.14)
where α1 is the only unknown. The filter coefficient α1 can be easily determined
by one-dimensional exhaustive search in the interval of [−1, 1]. First, for each
α∈ [−1, 1] we fitted a linear model to the phase ϕ(w; α) = arg{ ˜H1(ejw; α)}. The
reason is that the q-shift filters are approximately linear phase and have almost constant group delay [67]. Fitting process is performed for the low frequencies (w ∈ [−π2, π2]) because approximately linear behaviour of the phase function disappears as the w approaches to ±π. After fitting the linear model, the nega-tive slope of the resultant line yields the group delay of the filter obtained from Eq. 3.13. To have a group delay of 1/4, it turns out that
α1 =−0.05, α5 = 0.0098 (3.15)
The second filter ˜h2[n] is simply the time reversed version of the filter ˜h1[n].
This is similar to the time reversed design of {h0,g0} filter pair in [67]. Hence,
˜
h2[n] is given by
˜
filters after decimation because they can be expressed in half-band form given in Eq. 3.7 and 3.8 where
U1(z2) = α5z−2+ α4+ α2z2+ α1z4 (3.17)
U2(z2) = α1z−2+ α2+ α4z2+ α5z4 (3.18)
Prediction filters P1(z) and P2(z) are designed by applying the same
de-sign strategy as in update filters. In prediction, P1(z) uses only those
sam-ples of the signal xL[n] which are updated by U1(z) and P2(z) uses only those
samples of the signal xL[n] which are updated by U2(z). From Table 3.1,
h1[n] = (−1)nh0[N − 1 − n] where N is the length of the filter. Thus,
effec-tive prediction filter corresponding to P1(z) is given by
˜
g1[n] ={−α5, 0,−α4, α3,−α2, 0,−α1} (3.19)
Since g1[n] = h1[N−1−n] from Table 3.1, effective prediction filter corresponding
to P2(z) is given by
˜
g2[n] ={−α1, 0,−α2, α3,−α4, 0,−α5} (3.20)
Update and prediction filters designed above are employed at the second decom-position level or higher. For the first level, half-sample delay condition in Eq. 3.6 becomes one-sample delay condition for DT-CWT to be approximately analytic at each level [61]. Hence, simple {1/2, 1/2} filter is used as the effective update filter at the first level, and the coefficient at n = 0 is changed between U1 and
U2. For prediction at the first level, {−1/4, 1, 3/4} effective prediction filter is
employed, which assigns weights to the samples based on their proximity to the predicted sample.
For our ST-CWT application, input signals are again fed to a seven-stage wavelet-tree and feature parameters are extracted by finding the energies of re-sulting eight frequency sub-bands. Frequency boundaries are formed in the same
3.3
Shift-Invariance Property Based
Compari-son
To investigate the shift-invariance property for the aforesaid frequency analysis methods, a unit step signal and its shifted versions are given as input to the wavelet filter-banks, and the wavelet coefficients at the third level are determined. The input signal and, four-sample and five-sample shifted versions are shown in Figure 3.5. The wavelet coefficients of the Haar wavelet, Daubechies-2 wavelet, Daubechies-4 wavelet, Biorthogonal-3.3 wavelet, DT-CWT, and ST-CWT are shown in Figure 3.6, 3.7, 3.8, 3.9, 3.10, and 3.11, respectively. The energies of the wavelet coefficients for the third level decomposition are calculated. Then, change amounts in these energies are observed while shifting the input signal to investigate the shift-invariance properties of the frequency analysis schemes.
Near shift-invariance properties of the DT-CWT and ST-CWT are obvious from the figures. The wavelet coefficients are not much affected by shifts in the input signal for the DT-CWT and ST-CWT whereas DWT-based methods may yield very different output signals as a response to small translations of the input signal. The Haar wavelet is incapable of dealing with one-sample shifted signals and it can be seen from Figure 3.6. The other DWT-based methods also do not provide satisfactory results while shifting the unit step signal four and five samples. For the DT-CWT and ST-CWT methods, input signal and its shifted versions provide very similar results considering the energies of the wavelet coefficients.
Some other experiments are conducted using the vibration sensor signal in Section 4.3.1. In these experiments, the frequency analysis methods are compared to each other in a similar way with the unit step signal example. However, the ST-CWT method should be applied to various applications to see if it really provides near shift-invariance like the DT-CWT.
Figure 3.5: A unit step signal, and its four-sample and five-sample shifted ver-sions.
Figure 3.6: Third level wavelet coefficients of a unit step signal and its shifted versions for the Haar wavelet.
Figure 3.7: Third level wavelet coefficients of a unit step signal and its shifted versions for the Daubechies-2 wavelet.
Figure 3.8: Third level wavelet coefficients of a unit step signal and its shifted versions for the Daubechies-4 wavelet.
Figure 3.9: Third level wavelet coefficients of a unit step signal and its shifted versions for the Biorthogonal-3.3 wavelet.
Figure 3.10: Third level wavelet coefficients of a unit step signal and its shifted versions for the DT-CWT wavelet.
Figure 3.11: Third level wavelet coefficients of a unit step signal and its shifted versions for the ST-CWT wavelet.
3.4
Computational Complexity Based
Compar-ison
The DFT, MFCC, DWT, DT-CWT and ST-CWT are compared to each other in terms of computational complexity. For the numerical examples, number of the signal samples over one signal window, N , is taken 1024, and number of the frequency sub-bands, M , is taken 8.
Fast Fourier transform (FFT) is utilized instead of the DFT in the tests. The
N -point FFT requires N log2N complex multiplications and additions. Besides, N real multiplications are needed to calculate the energies of the frequency
sub-bands. Therefore, computational complexity of the DFT based feature extraction method is on the order of O(N log2N ).
The mel-cepstrum based feature extraction scheme needs an extra M log2M
real multiplications and additions to carry out the inverse discrete cosine trans-form, where M is the number of mel-frequency cepstral coefficients and also the number of frequency sub-bands. Therefore, the computational complexity of the MFCC method is O(N log2N ) + O(M log2M ). If N >> M , it can be used
as O(N log2N ). In addition, M look-up operations are needed because the log
operation is performed by a look-up table.
The computational cost of the DT-CWT is twice that of ordinary DWT which can be implemented in O(N ), where N is the number of samples in the signal [72]. The computational complexity of the ST-CWT is equivalent to the ordi-nary DWT. In each branch of wavelet-tree, the computational cost is equivalent to a discrete convolution operation. If it is a r-level wavelet-tree, 2r convolu-tional operations are needed. Also, if the number of nonzero filter coefficients is p, the number of the real multiplications is also p to get one convolutional output. Totally 2pN (1− 1/2r) real multiplications are required to execute the
ST-CWT. In additionally, the energy values of the frequency sub-bands are com-puted with N (1− 1/2r) + (r + 1) real multiplications. The exact number of all
Table 3.2: The exact number of real multiplications in the feature extraction methods we used. N = 1024 is the number of signal samples in each window;
M = 8 is the number of the frequency sub-bands; p is the number of nonzero
filter coefficients, and r = 7 is the number of the levels in a wavelet-tree.
DFT 2N log2N + N 21504 multiplications
MFCC 2N log2N + N + 2M log2M 21552 multiplications
DWT 2pN (1− 1/2r) + N (1− 1/2r) + (r + 1) p = 5, 11184 multiplications
DT-CWT 2[2pN (1−1/2r) + N (1−1/2r) + (r + 1)] p = 6, 26432 multiplications
ST-CWT 2pN (1− 1/2r) + N (1− 1/2r) + (r + 1) p = 5, 11184 multiplications
The ST-CWT is a computationally efficient method in comparison to the DFT, the MFCC, and the DT-CWT based frequency analysis methods due to the fact that the ST-CWT is designed using lifting structures in a single-tree.
3.5
Summary
Different frequency analysis methods including the DFT, MFCC, DWT, DT-CWT and ST-DT-CWT are studied and compared to each other. It is shown that the ST-CWT is a computationally efficient method in comparison to the other sig-nal asig-nalysis methods including DT-CWT and it also provides the shift-invariance property like the DT-CWT. DWT-based wavelets are also computationally effi-cient but they can not provide the shift-invariance property.
Chapter 4
Ambient Assisted Living System
Using Different Sensors
In this chapter, an AAL system is described using the components introduced in Chapter 2, and the theoretical methods reviewed in Chapter 3. Various detection algorithms and classifiers are employed to implement the AAL system. Human footstep detection, falling person detection, human motion detection, unusual inactivity detection, indoor flooding detection, uncontrolled flame detection, gas leak detection, and pet movement detection are the current capabilities of our systems. It is assumed that only one person lives in a smart home while developing our detection algorithms because the aim of this study is to improve the quality of life of the elderly and handicapped people living alone.
The vibration sensor is employed in human footstep detection, falling person detection, and indoor flooding detection applications. The PIR sensor is employed in human motion detection, unusual inactivity detection, falling person detection, uncontrolled flame detection, gas leak detection, and pet movement detection applications. Uncontrolled flame detection, gas leak detection, and pet movement detection systems were studied before in [57], [58], [73]. Among the previous works, only the uncontrolled flame detection application is integrated to our AAL
In Section 4.1, datasets related with our detection systems are proposed. Hu-man motion and unusual inactivity detection systems are described in Section 4.2. In the same section, walking intensity of the person in a certain time period is calculated through the human footstep detection system. As the most important implementations in this thesis, various falling person detection systems are intro-duced in Section 4.3. One falling person detection system is implemented using a vibration sensor, and the other one is implemented using two PIR sensors. There is also a multi-sensor based falling person detection system which employs one vibration sensor and two PIR sensors. As a final application, the indoor flooding detection methods are discussed in Section 4.4.
Stand-alone sensor fusion application is introduced in Section 4.5 and all de-tection systems are used in this multi-sensor application. chipKIT Uno32 boards are employed for each sensor and the auto-dial alarm system is connected to the main Uno32 board which determines final decisions for the emergency situations. Uno32 boards communicate using Cat 5 cables in our implementation. The other design details are given in Section 4.5.
4.1
Datasets
In the experiments, the GS-20DX vibration sensor signal is sampled at a rate of 500 Hz, and the Paradox 476+ PIR sensor signal is sampled at a rate of 100 Hz. Sensor signal records are taken in different experimental environments to analyze the effects of different environments. Third floor of a new building which has a concrete floor, second floor of a old building which has a hardwood floor, and fourth floor of a new building which has a hardwood floor are used for the experiments while recording the vibration sensor signals.
For the PIR sensor based detection algorithms, 20-hour-long signal record is used to detect the human motion and unusual inactivity situations. This dataset is employed in Section 4.2.1. The vibration sensor based human footstep detection
consisting of walking and no-activity events. Five-minute-long part of this record is used to train a MM classifier, and the other five-minute-long part of the record is used to test the classifier. This dataset is used in Section 4.2.2.
Falling person detection experiments are performed on two different datasets. The first of these datasets contain only vibration sensor signals. To implement a two-PIR-sensor based falling person detection system, a new dataset becomes necessary because there was not any PIR sensor signal records in the first dataset. The second dataset is formed by recording the vibration and the PIR sensor signals synchronously.
A typical falling event lasts about two seconds. Therefore, the first dataset for the falling person detection system contains 1024-sample-long signals corre-sponding to the following number of incident records: 126 falling, 3937 walk-ing/running, 2600 sitting, 117 fallen book, and 32 slammed door. Among these incident records; 53 falling, 1617 walking/running, 1295 sitting, 11 fallen book, and 44 slammed door cases are used for training classifiers. The remaining records are used as the test dataset. Falling, walking, running, and sitting records are ob-tained from 10 different people. These people have different weights and heights.
The second dataset for the falling person detection system is composed of to-tally one-hour-long record containing activities such as falling, walking, running, sitting, and bending. In this dataset, one minute record contains only one falling event because before and after of the event need to be known for the two-PIR-sensor based falling person detection system. That is to say, the two-PIR-two-PIR-sensor based system does not detect the falling person immediately, the system needs to analyze a period of time. Therefore, the second dataset contains 20 falling events (20 minutes) and 40-minute-long no-falling events.
The final dataset is related with the indoor flooding detection. In this dataset, the vibration sensor signals are recorded while water is flowing from the sink to the floor. During this recording, there is not any human-sourced vibrations on the floor. This dataset contains 47 flooding and 76 no-activity records which are

![Figure 2.6: An example illustration to describe working mechanism of the PIR sensor, taken from [46].](https://thumb-eu.123doks.com/thumbv2/9libnet/5891018.121786/29.892.278.681.167.546/figure-example-illustration-working-mechanism-pir-sensor-taken.webp)