PROJECT
А GASE STUDY ТА ^
COfeSrpT^CTIШ liiOUST/
j i H A m ' V u a ' т іК р о ^4 ï fi Λ -‘ -'J·PROJECT MANAGEMENT: A CASE STUDY IN CONSTRUCTION INDUSTRY
A THESIS
SUBMITTED TO THE FACULTY OF MANAGEMENT
AND THE GRADUATE SCHOOL OF BUSINESS ADMINISTRATION OF BILKENT UNIVERSITY
IN PARTIAL FULFILLMENT OF THE REQUIREMENTS FOR THE DEGREE OF
MASTER OF BUSINESS ADMINISTRATION
By
DİDEM KÖLÜKSÜZ JULY 1996
и ь 3 ? ( 5 ·
■ AZ
I certify that I have read this thesis, and in my opinion it is fully adequate, in scope and quality, as a thesis for the degree of the Master of Business Administration.
Assoc. Prof. Erdal Erel
I certify that I have read this thesis, and in my opinion it is fully adequate, in scope and quality, as a thesis for the degree of the Master of Business
Administratiorj,.-Assoc. Prof. Dilek Önkal
I certify that I have read this thesis, and in my opinion it is fully adequate, in scope and quality, as a thesis for the degree of the Master of Business Administration.
Assist. Prof. Neşe Akkaya
Approved for the Graduate School of Business Administration.
J
ABSTRACT PROJECT MANAGEMENT; A CASE STUDY IN CONSTRUCTION INDUSTRY Didem Koluksuz M.B.A.
Supervisor; Assoc. Prof. Erdal Erel July 1996, 80 Pages
One of the application areas that project management can effectively be applied is the construction industry. In this thesis, a case study is carried out in order to point out the importance and essentiality of project management, especially project scheduling and control. For this purpose, Microsoft Project Version 4.0 (a project management software) is used, and the applicability of Project Evaluation and Review Technique (PERT) and Critical Path Method (CPM) are considered.
Key Words: Project management, planning and scheduling, critical path method, project evaluation and review technique.
ÖZET
PROJE YÖNETİMİ İNŞAAT SEKTÖRÜNDE
BİR VAKA ÇALIŞMASI
Didem Kölüksüz
Yüksek Lisans Tezi, İşletme Bilimleri Enstitüsü Tez Yöneticisi: Doç. Dr. Erdal Erel
Temmuz 1996, 80 Sayfa
Proje yönetiminin en etkin şekilde uygulanabildiği alanlardan biri inşaat sektörüdür. Bu tezde, proje yönetiminin, özellikle de çizelgeleme ve kontrolün, önemini ve gerekliliğini belirlemek amacıyla bir vaka çalışması yapılmıştır. Bunun için, Microsoft Project Version 4.0 (bir proje yönetimi programı) kullanılmış; Proje Değerlendirme ve İnceleme Tekniğinin, ve Kritik Yol Metodunun uygulanabilirliği incelenmiştir.
Anahtar Kelimeler: Proje yönetimi, planlama ve çizelgeleme, kritik yol metodu, proje değerlendirme ve inceleme tekniği.
I would like to express my thanks to Assoc. Prof. Erdal Erel for his valuable guidance and supervision throughout the study. I would also like to thank Assoc. Prof. Dilek Önkal and Assist. Prof. Neşe Akkaya for their useful suggestions and comments.
I would also like to express my gratitude to my family for their endless supports and encouragement.
Finally, I would like to thank Ms. Ruhsar Arikan for devoting considerable time to the work.
ACKNOWLEDGEMENTS
TABLE OF CONTENTS ABSTRACT. ÖZET... ACKNOWLEDGEMENTS... ii TABLE OF CONTENTS... iv LIST OF FIGURES... vi LIST OF TABLES...vii 1. INTRODUCTION... 1
1.1. Scope and Purpose of the Thesis... 2
1.2. Outline of the Thesis... 2
2. LITERATURE REVIEW...4
2.1. What is a Project?... 4
2.2. Project Management Concept... 5
2.3. Project Planning and Scheduling...7
2.3.1. Project Scheduling Tools... 8
2.3.1.1. Work Breakdown Structure (WBS)... 9
2.3.1.2. Gantt Chart...10
2.3.1.3. Network Chart (PERT/CPM Chart)... 11
2.3.2. Project Scheduling Techniques...14
2.3.2.1. CPM Features... 15
2.3.2.2. PERT Features... 17
2.3.2.3. PERT/CPM Features...22
2.3.3. Implications of PERT/CPM...24
3. CASE ANALYSIS...26
3.1. General Information About the Firm... 26
3.2. General Information About the Project... 27
3.3. Project Scheduling With PERT/CPM Method...28
3.3.1. Breakdown and Activity List of the Project...28
3.3.2. Precedence Relations...29
3.3.3. Estimations...30
3.3.3.1. Estimation of Task Durations... 30
3.3.3.2. Estimation of C osts...33
3.3.4. Data Entry...34
3.3.5. Determination of the Critical P ath... 35
3.3.6. Crashing the Project... 40
3.4. Results... 46
4. SUMMARY AND RECOMMENDATIONS...48
4.1. Summary and Discussion... 48
4.2. Recommendations... 53
REFERENCES... 55
APPENDICES... 57
APPENDIX A - ORGANIZATIONAL CHART OF ANKARA ALÜMİNYUM INDUSTRY AND TRADE INC...58
APPENDIX B - WORK BREAKDOWN AND LIST OF ACTIVITIES...60
APPENDIX C - PREDECESSORS AND PRECEDENCE RELATIONS... 64
APPENDIX D - TIME AND COST ESTIMATES OF ACTIVITIES (REAL W B S )...69
APPENDIX E - SCHEDULING TABLE FOR THE PROJECT... 72
APPENDIX F - SCHEDULING TABLE FOR THE PROJECT AFTER CRASHING ACTIVITY 5 2 ... 75
APPENDIX G - SCHEDULING TABLE FOR THE PROJECT AFTER CRASHING ACTIVITIES 52 AND 5 3 ... 78
LIST OF FIGURES
Figure 1. A graphical representation of WBS... 10
Figure 2. Precedence relationships...12
Figure 3. Beta probability distribution with three estimates...19
Figure 4. Network diagram and the critical path... 37
LIST OF TABLES
Table 1. Expected time and variance computations for activities with uncertain activity times... 32 Table 2. Durations, start and finish dates of critical activities 36 Table 3. Normal and crash time and cost estimates for activities that can be crashed... 42 Table 4. Finish dates estimated in the project... 47
1. INTRODUCTION
Today, all business entities around the world are in a state of competition and this competition will inevitably increase as a result of globalization. The importance of this fact for Turkey is that Turkish firms have recently been introduced to the concept of a strong competition since Turkey has become a member of Customs Union. In such an unstable and competitive environment, the proper allocation of resources becomes more important than ever. Especially, the most crucial resources, namely time and money, need to be allocated appropriately and used very efficiently to be able to compete with others. In the case of project-oriented firms, these two crucial resources are of vital importance. Such firms can function only when they obtain a project; and any bad images, such as violation of deadlines, conducted to the contractor threaten the survival of the firm as they would disqualify the firms for obtaining new projects.
Firms in construction industry constitute an example to project-oriented firms, and therefore they need to pay special attention to the management of their projects. Most of them use project management techniques; however, these are used only for the initial scheduling and budgeting as the contract requires the submission of an initial work plan and an initial cost estimate. However, project management is more than this. It lasts till the end of the project and helps in
controlling the project. Project-oriented firms need a better understanding and a better application of project management.
1.1. Scope and Purpose of the Thesis
The objective of this thesis is to point out the importance and vitality of project management, and especially project scheduling and control; and to present an application of project scheduling and control to a medium-sized firm in construction industry.
The project scheduling and control is carried out by using the PERT/CPM (Project Evaluation and Review Technique / Critical Path Method) technique. For scheduling by this method, a project management software, Microsoft Project 4.0, is used.
The study is not only on the scheduling of a medium-scale project, but it includes, also, a comparison between the schedule estimated by project scheduling techniques and the one targeted by the firm. It comes up with suggestions of how the gap between the two can be eliminated. In addition, the applicability of PERT/CPM methodology to similar kind of projects is discussed.
1.2. Outline of the Thesis
The thesis proceeds in the following manner. In Chapter 2, the related literature is reviewed. First, project and project management concepts are given.
Then, project planning and scheduling are presented in terms of project scheduling tools and project scheduling techniques. Finally, implications of PERT/CPM technique are reviewed.
The analysis of the case is presented in Chapter 3. First, general information about the firm and the project is given, and then scheduling of the project with PERT/CPM technique is described.
In Chapter 4, a general summary is given and the findings are discussed. Then, some recommendations are provided.
2. LITERATURE REVIEW
2.1. What is a Project?
A project is a sequence of interrelated jobs taken on to achieve a specific goal (Zells, 1990). Archibald (1976) elaborates on this concept; “Projects are intended to produce certain specified results at a particular point in time and within an established budget.” A project may be the entire process required to produce a new product, new plant, new system, or other specified results (Archibald, 1976). Depending on the technical challenge, a project may contain one or several tasks, involve a few or many people, span one or several functions, last for a short or a long period of time, and cost an inconsequential sum or an incredible amount (Roman, 1986).
What makes a project different from the usual, daily jobs is that a project goal is a specific, non-routine event (Schultz, 1993). They are non-cyclic activities. Non-cyclic activities, by definition, are not repetitive. However, being non-repetitive does not mean that there is absolutely no past experience related to the activity. The applicability of past experience to a new undertaking can range from some degree of parallelism to a completely new situation (Roman, 1986).
Projects involve three dimensions: time, cost, and performance. Performance, or accomplishment, within a compromised time frame to a determined objective is usually the principal consideration. Cost is also critical, but, depending on the urgency of the project operations, cost may be subordinated to technical accomplishment within established time constraints (Roman, 1986).
2.2. Project Management Concept
Managing a steady-state organization, which generally deals with cyclic, routine and continuous activities, is quite different from managing a project- oriented organization, which deals with non-routine and goal-oriented projects (Kömürcü, 1993). The most important difference is between the characteristics of the undertaken activities. In cyclic activities, risk and accomplishment can, with some degree of probability, be anticipated. However, this is not the case for projects. There is always some degree of uncertainty as an inherent characteristic of projects, and the existence of such uncertainty necessitates some planning for good management. The extent of planning depends on the complexity of the project: The more complex the project, the more uncertain it is, and therefore, the more planning it requires (Schultz, 1993).
Project management consists of two fundamental tasks: planning, and control. Planning includes spelling out what steps are required to complete a project. These steps are called tasks. Some tasks occur sequentially, one immediately after another, while other tasks occur simultaneously. Planning also
covers the determination of the appropriate sequence of these tasks. Various resources must be consumed in order to meet the project objectives. Basically, these resources fall into the following four categories: time, money, people, materials. Project plans must be concerned with effective utilization of such resources over the life of the project. The time resource is dealt with by creating schedules of activities. Money planning is handled through budgets. Human resource planning entails assigning people to the project. Material resource planning may embrace the procurement of new materials, or it may focus on the allocation of physical resources to different tasks over the life of the project (Roman, 1986).
Control entails seeing that project tasks are carried out according to the plan. The major purpose of control is to avoid large deviations from the plan (Roman, 1986).
The definition of project management by the Project Management Institute sums up the mentioned concepts very well (Hendrickson & Au, 1989):
“Project management is the art of directing and coordinating human and material resources throughout the life of a project by using modern management techniques to achieve predetermined objectives of scope, cost, time, quality, and participation satisfaction.”
In the recent decades, technological developments have enabled project management vie'computers. Project management software is a valuable tool for
establishing an initial project plan. In addition, it quickly recalculates schedules and enables the project managers to see how changes in part of the project affect the overall plan. New tasks, obsolete tasks, delayed dates affecting other tasks, or the irregular availability of a resource might slip by unnoticed, but with a software they all can be kept under control (Schultz, 1993).
In addition, keeping everyone informed by presenting only the information they need could be a lot of work without the aid of a computer. With a software, quick reports can be obtained and quick information can be gathered when needed. Tailored reports and presentations to accommodate special requirements can be prepared (Schultz, 1993).
In sum, project management software can be used to create realistic project plans, respond to changes quickly and realistically, anticipate the unexpected, and assess the consequences.
2.3. Project Planning and Scheduling
Different phases in a project’s life can be identified as follows. The project may be in (1) the conceptual phase, that includes the project’s evolution through the idea, (2) the formative phase, that covers the definition of the project according to the external and internal factors, (3) the operational phase, that covers the processes and functions, and (4) the termination phase, that includes the completion and conclusion of the project. Although project management includes all activities throughout the life cycle of the project, most of the project
management literature concentrates on the techniques applicable to the operational phase of the project life cycle (Roman, 1986).
Scheduling project activities is one of the most critical aspects of the operational phase of project management. As mentioned before, scheduling deals with the allocation of one of the main resources: time. However, evaluation of what has to be done and in what sequence is a prerequisite for the scheduling of the project. Detailed scheduling is logically developed from a project work breakdown analysis including items, phases, and tasks needed to accomplish project objectives. Breaking the work into managerially controllable segments such as items, phases, and tasks facilitates a reasonable estimate of the magnitude of effort and time required to accomplish the various work segments. If the activities and their sequence are not determined properly - that is, if they are poorly evaluated, this fact is usually reflected in schedule breakdowns and higher than anticipated project costs. Higher costs and the inability to meet schedule obligations could affect contractual obligations, profitability, and customer relations (Roman, 1986).
2.3.1. Project Scheduling Tools
In project scheduling, there are basic tools that provide the user with the answers he needs throughout the project. As the information requirements change in the course of a project, the tool to be used to get the required information will also change.
As mentioned in the previous section, determination of activities to be included in the project and their sequences are essential to be able to successfully schedule the project later. Practically, all major project activity flows from a work breakdown plan.
In project management, a list of things to be done is called a work
breakdown structure (WBS), which is a tool for the basic planning stage. It is a
basic management technique which presents systematically subdivided blocks of work (Roman, 1986). Kerzner refers to WBS as a vehicle for breaking the work down into smaller elements, and providing a greater probability that every major and minor activity will be accounted for (Kerzner, 1979). WBS helps to identify the major project jobs and break them into individual work-units, assuring that the work is done and people do not waste their time doing “stuff’ (Zells, 1990). The WBS not only specifies the tasks to be undertaken in the project, but their estimated duration as well. If, in addition, the WBS contains information on the cost of each task, it is called a costed WBS. In addition to enabling an easy tracking of project jobs, WBS provides the basic data needed to construct more sophisticated planning and control tools, such as Gantt Charts and PERT networks (Roman, 1986).
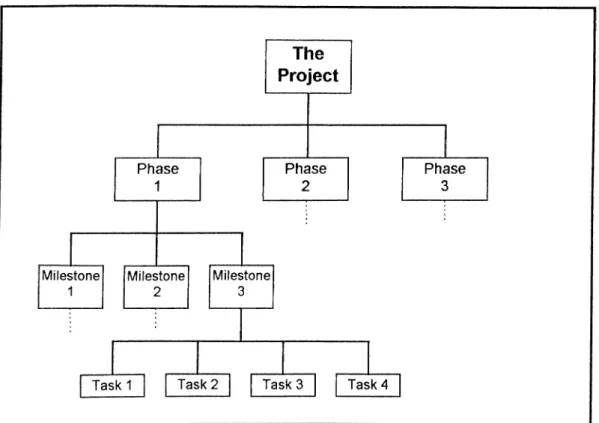
2.3.1.1. Work Breakdown Structure (WBS)
In a WBS, the lowest level constitutes of the tasks to be done in the project. The next level is formed by milestones. A milestone is a goal in the
project. It is different from a task in that the duration of a milestone is accepted to be zero. The third level is the level of phases. These are significant achievements to be met throughout the project. The top level is the major objective of the project (Zells, 1990). A graphical presentation of WBS can be seen in Figure 1.
Figure 1. A graphical representation of WBS (Zells, 1990).
2.3.1.2. Gantt Chart
Gantt charts are simply bar charts that graphically portray the duration of the different tasks specified in the WBS. Gantt charts are probably the most commonly used scheduling tool. Their popularity lies in the fact that they are easy to develop, are easy to use, and provide a quick, comprehensive overview of the
project plan. Gantt chart is an excellent tool for quickly assessing the status of individual tasks over time in a project (Roman, 1986).
Gantt charts are particularly useful in controlling projects. They show at a glance whether the project schedule is being met or whether it is slipping.
2.3.1.3. Network Chart (PERT/CPM Chart)
The network charts are also referred as network dependency diagrams (Zells, 1990). As the name implies, they are very helpful in understanding the relationship between tasks and why they are scheduled the way they are. When it is more important to know the relationships of the tasks in a project to one another, a network chart can be more illustrative than any other tool. The network chart displays the interdependencies among tasks (Schultz, 1993).
Although there are many variations on network types, two or three common approaches seem to prevail. The first type is “activity-on-arrow” networks. These are dependency drawings with the name, duration, and pertinent information written above and below each line that represents a task. At the either end of each line, there are annotations, which are referred to as nodes or events. Another type of networks is “activity-on-node” networks. In such networks, the job is represented by a circular or rectangular node, which includes the name, duration, and other pertinent information in it. The arrows begin at the end of each job and point to the start of each succeeding job, indicating a “finish- to-start relationship.” The third type is “precedence diagrams.” This type of
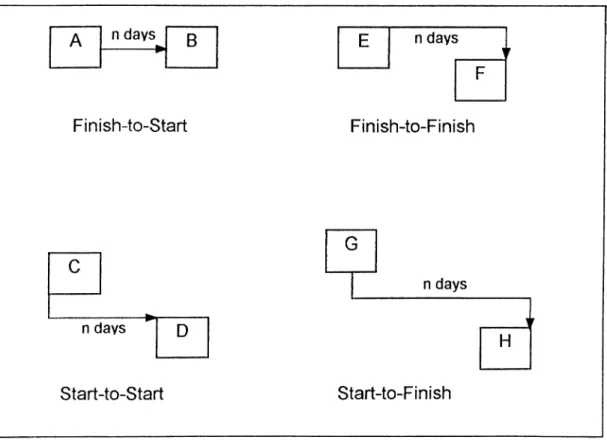
networks enable presentation of relationships other than finish-to-start relationships, also (Zells, 1990). Different relationships are shown in Figure 2.
Figure 2. Precedence Relationships (Zells, 1990).
In Figure 2, A and B have the traditional finish-to-start relationship, indicating that all of A must be completed before B can begin. However, C and D have a start-to-start relationship, and therefore, D may not start until n days after C has started. In the same figure, E and F have a finish-to-finish relationship, that is, F may not finish until n days after E is finished. Lastly, G and H have a start- to-finish relationship, which indicates that H may not finish until n days after G has started (Zells, 1990).
In the mentioned relations, the duration of ‘n days’ is known as either ‘lag time’ or ‘lead time’. Lag time is the delay between tasks that have a dependency.
For example, if a two-day delay is required between the finish of one task and the start of another, a finish-to-start relationship can be established and a two-day lag time can be specified. Similarly, lead time is the overlap between tasks that have a dependency. For example, if a task can start when its predecessor is half finished, a finish-to-start relationship can be specified with a lead time of 50 percent for the successor task (Schultz, 1993).
Over the years, the term PERT/CPM has come to mean any variation on the different types of networks, as well as whatever the user wants it to mean. Any of the drawing methods is used in combination with any of the calculation methods, such as CPM or PERT. Consequently, the best features of each may be selected and used to improve the networking process (Zells, 1990). As this implies, the term “PERT/CPM chart” has been used as a synonym for network charts.
In addition to precedence relations, PERT/CPM charts show the ‘critical path’ in the project. The critical path in a network is the path that takes the longest time to complete (Roman, 1986). It is important to have a clear and quick view of the critical path because this path consists of the tasks that determine the duration of the overall project. In order to shorten the duration of the project, one has to pay close attention to the critical path - to the critical tasks too, and try to shorten the duration of especially these tasks.
Among project scheduling techniques, PERT and CPM are the most commonly used ones. Since these methods are used in this study, the information included under the topic of project scheduling techniques is limited to discussion about only these two techniques.
In 1950s, PERT and CPM were developed independently of each other, each of them to be applied to projects of different nature. Critical Path Method (CPM) was developed to be used in building and maintenance chemical plants at Du Pont Industries. The plant construction and maintenance times were fairly stable; therefore, CPM was oriented towards deterministic activity times and it emphasized time-cost trade offs. On the other hand. Project Evaluation and Review Technique (PERT) was developed for the U.S. Navy to plan and control the Polaris project. This project was an R&D project, aimed at designing and implementing the Polaris system, and it involved a high degree of uncertainty. Therefore, PERT was designed to allow for uncertain activity times, and it did not include cost considerations explicitly. Although their orientations differed originally, the distinction between CPM and PERT has disappeared due to the fact that a project may constitute of tasks, some having deterministic activity times and some uncertain activity times; and that available computer softwares allow for both uncertain activity times and time-cost analysis (Acar, 1993). The characteristics of both techniques are summarized below separately.
CPM is the process for determining which jobs or activities, among the total activities comprising a project, are critical in their effect on total project time. The method also allows for the determination of how best to schedule all jobs in the project in order to meet a target date at minimum cost.
The procedure for applying CPM starts, as expected, with the determination of the tasks to be included in the project. Then, the sequence of these activities is revealed. The third step in CPM is assigning time estimates for each task included in the project. At this stage, cost estimates can also be considered with the time estimates, if a cost analysis is planned in addition to scheduling. The data obtained up to this point enables the user to draw the network diagram for the project. In a network diagram, a series of activities that connect the initial node to the final node is called a path. The next thing to do is to compute the critical path (Acar, 1993).
Critical path is the longest path through the network. This path indicates
the minimum time necessary to complete the entire project. The tasks on the critical path are called critical activities.
2.3.2.1. CPM Features
In order to calculate the minimum completion time for a project, a forward
pass is performed. In this pass, the earliest start time (ES) and earliest finish time (EF) for each task are determined, starting from the first task. The earliest start
activities. For each activity, EF = ES + t where t is the duration of this activity. The earliest time for the starting activity, having no predecessors, is time zero. The earliest finish time for the last activity on the network shows the duration of the entire project (Acar, 1993).
The completion time for the entire project is sensitive to the slightest delays in completion of certain activities. Such activities are critical tasks that lie on the critical path. In order to determine the critical path activities, a backward
pass is performed after the forward pass. Backward pass starts at the final node
and calculates the latest start time (LS) and latest finish time (LF) for each activity. The latest finish time for each task is the minimum of the latest start times of its succeeding activities. For each activity, LS = LF - 1 where t is the duration of this activity. The latest finish time for the final activity is the completion time of the entire project (Acar, 1993).
After the two passes through the network, a comparison of the ES vs LS (or EF vs LF) values provides a very important piece of information: The equality of these compared values for a specific activity indicates that there is no slackness in performing this task, and therefore, the activity under consideration has to be performed without even the slightest delay. That is, these activities offer no total slack, which is defined as the difference between a job’s ES and LS values (or between EF and LF values). Total slack represents the maximum amount of time a job may be delayed beyond its early start without necessarily delaying the project completion time. Another kind of slack is worth mentioning.
any other job. A job with positive total slack may or may not also have free slack, but the latter never exceeds the former. Free slack of a job is defined as the difference between the job’s early finish time and the earliest of the early start times of its all immediate successors (Augustine, 1989).
The tasks with no total slack are critical tasks, and they build up the critical path of the project. These tasks require the closest management because the overall project time can be reduced only by finding ways to shorten jobs along the critical path. The time required to perform non-critical jobs is irrelevant from the viewpoint of total project time (Augustine, 1989).
Today, fortunately, softwares allow determination of the critical path without being involved in tedious hand calculations, such as the ones described above. In large projects especially, dealing with such calculations are very difficult, and possibility of errors increases as the project gets larger. Some of the well known software packages dealing with project management are different versions of Harvard Project Manager, Microsoft Project, Project Workbench, Viewpoint, Primavera Project Planner, Superproject Expert, and Time Line (Zells,
1990).
2.3.2.2. PERT Features
In spite of their similar nature, the significance of PERT arises from the fact that it allows scheduling with uncertain activity times, whereas CPM concentrates on fixed values of duration. PERT enables executives to manage
“one-of-a-kind” programs, as opposed to repetitive and routine situations. They help management to handle the uncertainties of time and cost data involved in programs (Augustine, 1989).
In estimating deterministic activity times, only one estimate is made for each activity depending on past experience. However, the project in question may consist of quite unique activities and in this case, assigning a single time estimate is not appropriate. Whenever a project has activities with considerable variance in activity times, or whenever it is not appropriate to use a single value as the activity time, the duration of this activity should be treated as a random variable. In PERT, the random nature of activity times is traditionally incorporated into the analysis by using three time estimates for each activity (Acar, 1993):
Optimistic (a) An estimate of the minimum time an activity will take, a result that can be obtained only if unusual good luck is experienced (Augustine, 1989).
Most likely (m) An estimate of the normal time an activity will take, a result that would occur most often if the activity could be repeated a number of times under similar circumstances (Augustine, 1989).
Pessimistic (b) An estimate of the maximum time an activity will take, a result that can occur only if unusually bad luck is experienced. This estimate should reflect the possibility of initial failure and late start, but should not be influenced by such factors as “catastrophic events” - strikes, fires, power failures,
and so on - unless these hazards are inherent risks in the activity (Augustine, 1989).
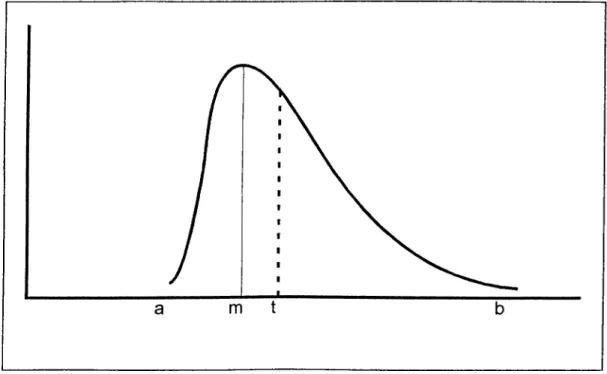
In analyzing the three time estimates, it is clear that the optimistic and the pessimistic time should occur least often, and that the most likely time should occur most often Thus, it is assumed that the most likely time represents the peak or modal value of a probability distribution; however, it can move between the two extremes. These characteristics are best described by the beta distribution, having a finite range and a skewed nature, as presented in Figure 3.
Figure 3. Beta probability distribution with three estimates (Acar, 1993).
The three time estimates are required as a gauge of the measure of uncertainty of the activity, and represent full recognition of the probabilistic nature of many tasks in development-oriented and non-standard programs. It is important to note, however, that, for the purposes of computation and reporting.
the three time estimates are reduced to a single expected time and a statistical variance (Augustine, 1989).
For further analysis, it is possible to use two approaches. In the first one, the person who attempts to estimate ‘a’ and ‘b’ is asked to select ‘a’ such that the actual time required by the activity will be equal to or greater than ‘a’ for about 99% of the time. Similarly, ‘b’ is estimated such that about 99% of the time the activity will have a duration of ‘b’ or less. By using this approach, the expected time for an activity is estimated as (Acar, 1993):
t = a + 4m + b
The equation states that the expected time value is a weighted average of three estimates, with the most likely time assigned four times as much weight as each of the other two. The other parameter, the variance of the beta distribution is given by (Acar, 1993):
s^ =
n b -a
The variance equation is based on the fact that the range of the beta distribution, that is the difference between its two extreme points, is approximately equal to six standard deviations ( 1 3 standard deviations from the mean) (Acar, 1993).
It is clear, however, this is a very high level of precision to be achieved most of the times. So, it is worth mentioning the second approach. Unless the underlying distribution is very asymmetric, no great error is introduced in finding the expected time if the pessimistic and optimistic estimates are made at the 95%, or even at the 90% levels. However, in this case, the formula for calculating the variance of an activity must be modified. The difference between the two extreme points is no longer equal to six standard deviations. Rather, for estimations at the 95% level, the variance calculation formula is given as (Mantel & Meredith, 1995):
, 2 _
n b -a
3.3
For estimations at the 90% level, the variance calculations becomes (Mantel & Meredith, 1995);
s^ =
n b -a
2.6
As a result of a series of trials using Statistical Analysis Systems (SAS) PROC IML for beta distributions of different shapes, it has been verified that this modification of the traditional estimator for the variance of beta distribution gives good estimates of the true variance, the difference being consistently under 5% (Mantel & Meredith, 1995).
The major advantage of PERT, especially when there is a significant amount of uncertainty, is the three-way estimate. While introducing a complicated feature, this characteristic gives recognition to those realities of life that cause
difficulties in most efforts in planning the future. The three-way estimate should result in a greater degree of accuracy in time forecasting. As a minimum, it allows the decision maker a better opportunity to evaluate the degree of uncertainty involved in a schedule - particularly along the critical path (Augustine, 1989).
2.3.2.3. PERT/CPM Features
As mentioned previously, the features of PERT and CPM have been combined, and the two methods have been used as one technique that has wider applications. The advantage of having a wider application area arises from the fact that the new method allows for both scheduling activities with uncertain time estimates and evaluating time-cost trade offs. The allowance for uncertain activity times is described in the previous section, “PERT Features.” In this section, the other favorable characteristic of this technique is described: Allowance for time- cost trade offs.
After the determination of the critical path and the duration for the entire project, the finish time of the project may be found to be unsatisfactory. A shorter completion time may be required. If the completion time for the project is to be shortened, the only way to be followed is determining valid means of shortening the duration of activities along the critical path. This can be achieved by applying new resources or additional funds, which are obtained from those activities that can “afford” it because of their slack condition. Alternatively, re-evaluation of the sequencing of activities along the critical path can be beneficial. If necessary, those activities that were formerly connected in a series can be organized on a
parallel or concurrent basis, with the associated trade-off risks involved (Augustine, 1989).
The reduction of the duration of a set of activities, hence of the project, through the use of additional resources is called crashing or expediting the
project. Crashing the project is a consideration of both engineering problems and
economic questions. Is it physically possible to shorten the time required by critical jobs (by assigning more persons to the job, working overtime, using different equipment, and so on)? If so, would the cost of speedup be less than the savings resulting from the reduction in overall project time? For instance, if jobs are done by crews, and the speed with which the job is done depends on the crew size, then it is possible to shorten or lengthen the project time by adding or removing men from crews. Other means for compressing job times might also be found; but any speedup is likely to carry a price tag (Augustine, 1989).
The procedure for crashing the project starts with assigning each job a ‘crash time’ in addition to the previously assigned ‘normal time’. Likewise, in addition to the normal time costs, each job is assigned the associated costs necessary to carry the job in crash time. In shortening the project, one of the critical jobs is chosen and assigned to its crash time. Then, the new critical path is determined. If the duration of the entire project is still too long, the new activity to be assigned to its crash time is chosen. This procedure follows until a satisfactory completion time is reached. However, besides the completion time, the corresponding changes in cost should be considered throughout the procedure. In this way, the various project completion times can be traded off
against the associated total cost in each case. The change in total cost of project in relation to the change in the completion time of the project is due to the direct costs, which increase as the overall time decreases (Augustine, 1989). Direct costs are described as the costs that can be directly traced into a product.
2.3.3. Implications of PERT/CPM
As described in all above sections, PERT/CPM combines many favorable and advantageous features as a scheduling technique.
First of all, the kind of planning required to create a valid network in PERT/CPM represents a major contribution to the definition and ultimate successful control of a complex program. In addition, network development and critical path analysis do, in fact, reveal interdependencies and problem areas which are either not obvious or not well defined by conventional planning methods. Another advantage of PERT/CPM is the common language feature, by which many individuals in different locations or organizations can easily determine the specific relationships of their efforts to the total task requirements of a large program. Thirdly. PERT/CPM is a useful tool because it provides an easy way to determine the effects of shortening various jobs in the project, and it enables the user to evaluate the costs of a ‘crash’ program (Augustine, 1989).
The determination of the critical activities and the critical path is a very important feature of PERT/CPM. At this point, it is useful to elaborate a little bit on the concept of slack, previously mentioned when CPM is described.
When a job has zero total slack, that is, the activity is a critical one, its scheduled start time is automatically fixed; and to delay the calculated start time is to delay the whole project. Jobs with positive total slack, however, allow for some discretion in their start times. This flexibility can usefully be applied to smoothing work schedules. Peak loads that develop in a particular shop may be relieved by shifting jobs on the peak days to their late starts. Slack allows this kind of juggling without affecting project time (Augustine, 1989).
Free slack can be used effectively at the operating level. For example, if a job has free slack, the foreman may be given some flexibility in deciding when to start the job. Even if he delays the start by the amount equal to or less than the free slack, the delay will not affect the start times or slack of succeeding jobs.
As can be inferred from the discussion, project scheduling is an important part of project management. Moreover, with its many favorable features, PERT/CPM technique is the most significant methodology among scheduling methods. Therefore, any management, being determined to achieve success in scheduling of the activities in the firm, should review its present planning and scheduling methods, and compare their effectiveness with that of the PERT/CPM system.
3. CASE ANALYSIS
3.1. General Information About the Firm
The data for this application of project management is obtained from Ankara Alüminyum Industry and Trade Inc. Ankara Alüminyum Industry and Trade Inc. is a medium-sized firm that makes aluminium appliances in construction industry. Currently, there are sixty-one people working in the firm. Only eleven of them work in the office, and the others work in the plant. The organizational chart of the firm is given in Appendix A.
The company is based in Ankara. It operates both in Turkey and abroad. In the recent years, the main foreign projects have been based in Russia. In 1995, the earnings of the firm added up to $1,500,000.
Major areas of scope are thermally insulated and other kinds of aluminium windows and doors; curtain walls; powder coated aluminium sheet - alucobond and glass panel facades; domes, vaults and prismatic skylights; automatic and manually operated special doors; ventilation grills, louvres and decorative grills; technical consulting; design and planning; project design preparation and details.
Time is a problematic resource for this firm. No scheduling is carried out for the projects, but only rough estimates are made. The nature of the job requires that the raw materials are ordered after the construction of the building under consideration is finished. Taking also the possible delays from the supplier into account, very little time is left for the firm to manufacture the appliances and to fix them onto the building. As a result of this, the firm usually faces problems of violating the deadlines set by the contractor. Therefore, scheduling the projects can be a good solution for Ankara Alüminyum Industry and Trade Inc.
3.2. General Information About the Project
In 1996, one of the projects which was to be undertaken by Ankara Alüminyum Industry and Trade Inc. was production and assembling of aluminium windows, and alucobond and glass panel facades of the additional building of Bayındır Holding Center in Tunus street. The contractor is Bayındır Construction Company.
The selection of this project is important in that it is the firm’s most commonly undertaken type of project, and therefore, it is a good representative of the firm’s other projects. As mentioned previously, the firm is not involved in project management in a scientific way. What is done is determining the duration of the project, depending only on rough duration estimates of some group of tasks. By choosing a recent project such as this one, the planned duration and the one that prevails as a result of scheduling the project can be compared. By this way, the bottlenecks of the process can be determined and solutions can be
discussed. In addition, since the project is a recent one, gathering information would be easier.
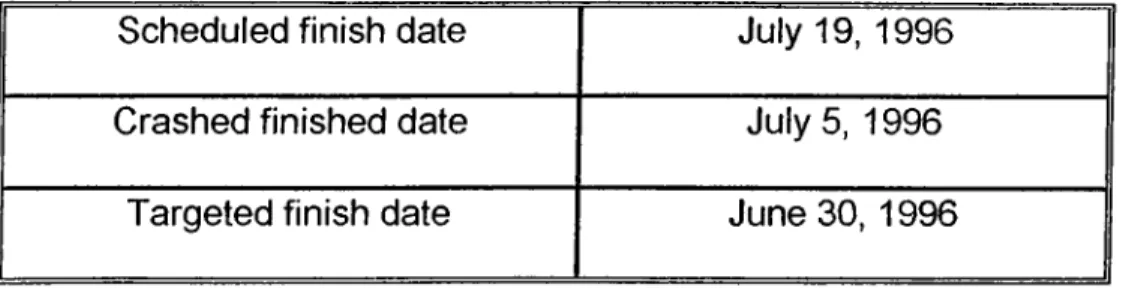
For the project under consideration, the starting date is reported to be February 1, 1996. The ending date of the project is aimed to be June 30, 1996. Therefore, the overall project duration was estimated roughly to be about five months.
3.3. Project Scheduling With PERT/CPM Method
In this study, the project is scheduled by the well-known scheduling technique, PERT/CPM. For this purpose, Microsoft Project Version 4.0 is used as the project management software. Although the project is not a very large one, the use of a software enables the user to work more efficiently and helps viewing the consequences of possible changes.
3.3.1. Breakdown and Activity List of the Project
In order to be able to schedule the project, the first thing to do is determining the activities of the project. Although this sounds simple, it is the most challenging part of scheduling process because the breakdown of tasks should be detailed enough to be controlled, however, at the same time it should not be excessively detailed making the process too complicated. The evaluation of the phases of the project is relatively easy as they are the same for most
projects. Further breakdown to determine tasks is carried out with the help of past experience of project managers.
The descriptive name of the entire project is “Manufacturing and assembling of aluminium windows, and alucobond and glass panel facades of the additional building of Bayındır Holding Center.” The breakdown of the project has revealed 3 phases: Office works, plant works, and field works. There are 24, 20 and 10 tasks in these phases, respectively. The number of tasks adds up to 54. All of the phases, and tasks of the project can be seen in the activity list in Appendix B. This list is not the real WBS of the project as it does not include the duration and costs of the tasks. They are not included in this list because their estimation is described in the following sections. After these estimations are described, the real WBS of the project is presented in the appendices and referred in the text. For a clear presentation in all tables and diagrams, tasks are given identification numbers, as in the case of the list in Appendix B.
3.3.2. Precedence Relations
The precedence relations among the tasks of the project are determined by the help of the past experience of project managers, as in the case of formation of the activity list. As described in the literature survey section, there are four different types of precedence relations, which are finish-to-start, start-to-start, finish-to-finish, and start-to-finish. In this project, all precedence relations, except two of them, are found to be finish-to-start type of relation. This means that each subsequent task can start only when the previous job is finished. The other type
of precedence relation, that takes place in the project twice, is start-to-start relation. This type of relation occurs between tasks 30 and 31, and between tasks 41 and 42. In both start-to-start type relations, the lag time is found to be 1 day. A one-day lag time means that the succeeding task cannot start until one day after the start of the preceding one. The list of precedence relations is found in Table C l in Appendix C.
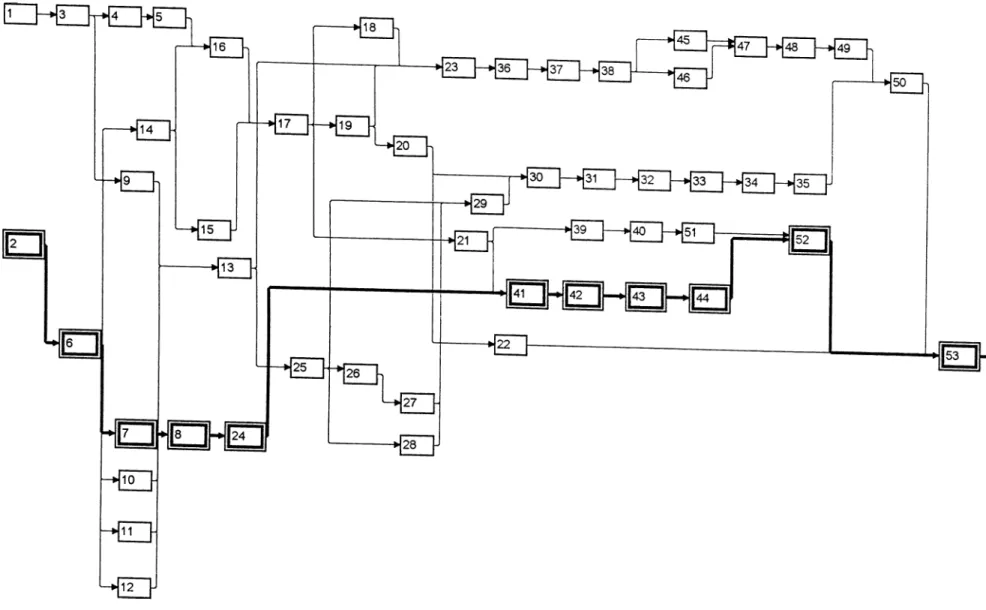
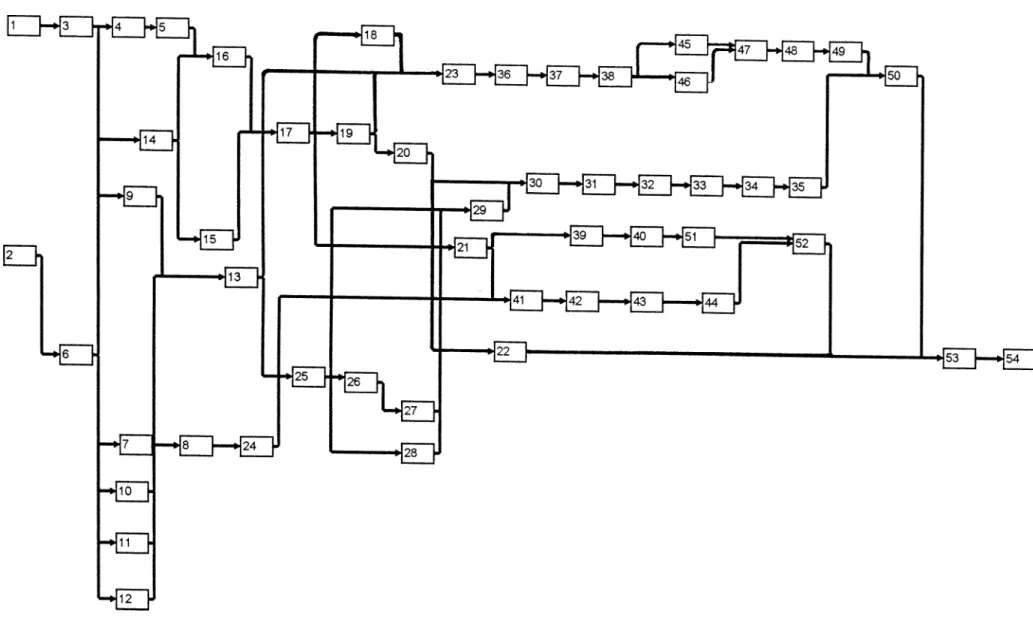
In Appendix C, there is also a network diagram that helps in viewing the relations among the tasks. This diagram is presented in Figure C l. In the diagram, nodes represent the activities and arcs represent the relations among them. In this respect, the diagram is an “activity-on-node” type of network. However, for the sake of simplicity, no information except the ID numbers of the tasks are reported in the diagram. Also, the critical path is not included since this is only a precedence diagram, and since the determination of the critical path is explained in the following sections.
3.3.3. Estimations
The next step to construct the basis of critical path analysis is to estimate the duration and cost of each activity.
3.3.3.1. Estimation of Task Durations
As mentioned previously, there are two possible types of activity times: Deterministic (fixed) activity times and probabilistic (uncertain) activity times.
Determination of both types of estimates require past experience about similar projects. In this project, among 54 tasks, 48 of them are stated to have deterministic duration, and only 6 of them are stated to have uncertain duration. The tasks with uncertain activity times are the ones having identification numbers 15, 47, 50, 51, 52, and 53.
The uncertain activity times are incorporated into the analysis by using the method of PERT. For this purpose, three time estimates - optimistic, most likely, and pessimistic - are estimated by the project managers. They are assumed to be at the 95% level of precision. Then, these estimates are combined into one through the properties of beta distribution. In the determination of the expected time for activities with uncertain activity times, the following equation is used:
t= - a + 4m + b
Similarly, in order to find out the variance of the duration of each activity with uncertain time estimate, the variance equation of the beta distribution is used, with the assumption of 95% precision level in mind:
s^ =
n 2
b -a 3.3
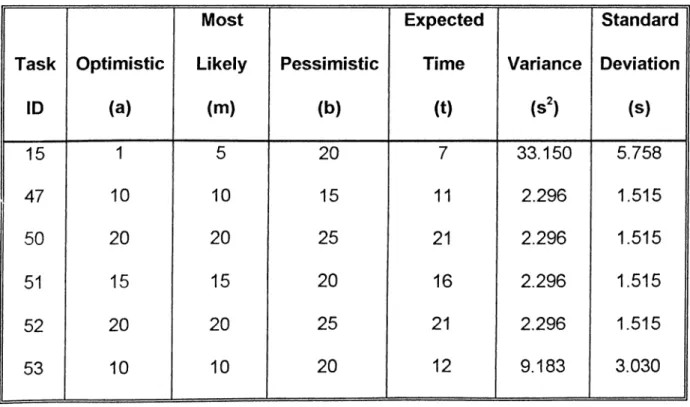
The calculations for combining the three estimates into one time estimate for activities with uncertain duration are summarized in Table 1.
Table 1. Expected time and variance computations for activities with uncertain activity times.
As can be seen in Table 1, the optimistic and the most likely time estimates are the same for all the tasks except the one with the ID number of 15. This fact implies that it is more likely to achieve the shortest possible durations when performing tasks 47, 50, 51, 52, and 53, although their activity times are not known for sure.
The variance of each activity is important in that it shows the variability of the duration of the activity under consideration. In this regard, the variance and standard deviation values show that task 15 is the most variable one. The favorable feature of standard deviation is expressing variability in the same term with the expected time, which is ‘days’ here.
The importance of variance and standard deviation of activity times will be mentioned again later, when the critical path is considered.
The time estimates of all tasks are listed in Appendix D.
3.3.3.2. Estimation of Costs
After estimating the activity times, the next step is to estimate the cost of each activity. The cost of an activity is determined by considering the costs that can be traced directly to the individual task. In this project, the traceable costs consist of the delivery costs and the prime costs. Prime costs include direct materials cost and direct labor cost. Direct materials cost is the cost of materials that can be physically and conveniently traced into a product or an individual task. Direct labor cost is the cost of labor that can be physically traced to the creation of a product or performance of an activity in a ‘hands on’ sense, such as assembly line workers in a plant.
The cost estimations for each task is stated in Appendix D. Here, it is important to note that the costs of activities with uncertain durations are adjusted for the time estimated by PERT analysis. For example, when task 47 is considered, the assigned cost listed in Appendix D - which is 115,500,000 TL - is valid only for the expected time, which is 11 days in this case. This cost does not represent the optimistic, pessimistic, and most likely cases.
In fact, the list in Appendix D is the real work breakdown structure (WBS) of the project. Although the list of activities is formed in the beginning of the analysis, the duration and cost of activities are not included in that list since they are estimated later. In addition to the list of tasks, the list in Appendix D contains the duration and assigned cost of each activity. Another point to be mentioned here is the lack of a Gantt chart in the project. Although Gantt charts are useful in assessing the status of individual tasks over time, they are particularly used in controlling projects. Since this study does not include controlling the project, the Gantt chart is not included.
3.3.4. Data Entry
After determining the required tasks, their sequence, the time and cost estimates for each activity, now, it is time to enter the data to the software.
For the determination of the critical path, the software Microsoft Project Version 4.0 is used. The name of the tasks and their time estimates are entered as the inputs for the determination of the critical path. Since Microsoft Project allows for only one value for the time estimate, the expected times are calculated manually for activities with uncertain times, and only these values are entered to the software. The software automatically assigns identification numbers to the activities. Optionally, the costs assigned for the time estimates are entered to be used in determining the overall cost of the project, and also, in the time-cost trade off.
Another required input is the starting date of the project. The formal starting date, that is the date at which the contract and the first payment were made, is given as March 18, 1996. However, at this date, some of the tasks included in the list of activities had already been carried out. For example, as the delivery of imported materials takes a long time, they were ordered about one and a half month prior to the contract date. Therefore, the actual starting date of the project is taken to be February 1, 1996.
3.3.5. Determination of the Critical Path
Given the starting date of the project, the sequence and the duration of tasks, Microsoft Project immediately carries out the computations required to determine the critical path. The very nice point about this software, just like in many others, is that any change made in the inputs automatically stimulates the computer to recalculate all the outputs. With the inputs collected and entered into the program, Microsoft Project determines the early and late start dates, early and late finish dates for each task, and also the finish date of the overall project. In addition, it calculates the amount of free slack and total slack for each task. As a result of these immediate calculations, it determines the critical path in the project and indicates the critical tasks.
According to the starting date, the sequence and time estimates of the tasks in this project, the project is calculated to be finished on July 19, 1996. The early start, early finish, late start, late finish dates for each activity are listed with
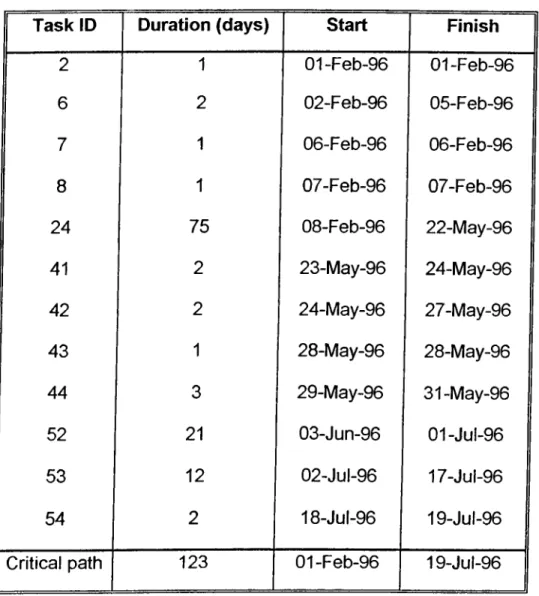
the time estimates in Appendix E. Appendix E also includes the free slack and total slack for each task. As a result of these findings, 12 critical activities are determined, and the critical path is found to be 2-6-7-8-24-41-42-43-44-52-53-54. Any information about the critical activities in Appendix E is typed in bold face and in italics. The time estimates, the start date and the finish date for the critical activities are summarized in Table 2. The network diagram which shows the critical path can be seen in Figure 4.
Table 2. Durations, start and finish dates of critical activities.
Task ID Duration (days) Start Finish
2 1 01-Feb-96 01-Feb-96 6 2 02-Feb-96 05-Feb-96 7 1 06-Feb-96 06-Feb-96 8 1 07-Feb-96 07-Feb-96 24 75 08-Feb-96 22-May-96 41 2 23-May-96 24-May-96 42 2 24-May-96 27-May-96 43 1 28-May-96 28-May-96 44 3 29-May-96 31-May-96 52 21 03-Jun-96 OI-Jul-96 53 12 02-JUI-96 17-Jul-96 54 2 18-JUI-96 19-JUI-96
It is previously mentioned that the importance of variance of time estimates would be discussed when the critical path is determined. The importance of variance of an activity arises from the fact that if this activity is a critical one, then the variability of its duration has effects on the variability of the finish date of the entire project.
By estimating the standard deviation of all activities on the critical path and assuming a normal distribution for the time it takes to complete the critical path activities, one can make probabilistic estimates regarding the likelihood that a project can be completed in a given period of time. However, for such an analysis, the assumption of the normal distribution should be verified. The probability distribution of the time required for accomplishing a job, which consists of a number of activities, may be approximated by the normal distribution on the basis of Central Limit Theorem. According to this theorem, this approximation approaches exactness as the number of activities becomes larger; for example, more than 10 activities along a single path is acceptable (Augustine, 1989).
Unfortunately, there is no way to apply the described analysis in this project. Although there are 12 activities on the critical path, only 2 of them have uncertain time estimates. This number is very insufficient to carry out such an analysis since the normal distribution approximation cannot be assumed according to the Central Limit Theorem. Therefore, the probability of finishing the project in five months is not considered in this study. However, the variability of the overall project completion time can be determined. If it is assumed that the activities are statistically independent of each other, then the variance of a set of
consecutive activities is equal to the sum of the variances of the individual activities comprising the set (Mantel & Meredith, 1995). In this regard, the event variance is obtained by adding the activity’s variance to the variance of the predecessor event. However, if there are more than one predecessors, the total variance of the activity is equal to the sum of its own variance and the variance of its predecessor that lies on the longest path to the activity. In case of ties, the path which has the larger variance is chosen (Moder, Phillips & Davis, 1983). As can be concluded from the above discussion, the variance of the project completion time is the sum of the variances of the critical activities with uncertain activity times. Therefore, only tasks 52 and 53 are to be considered.
Task 52 => s^ = 2.296 s = 1.515 days Task 53 => s^ = 9.183 s = 3.030 days Project => s^ = 11.479 => s = 3.388 days
It is known that the expected completion time of the project is 123 days. When the standard deviation of the project completion time is considered, it is seen that the standard deviation is 2.754% of the expected time. This low percentage implies the favorable fact that the project completion time is not much variable.
When the schedule created by Microsoft Project is compared with the one planned by the firm, the problem about the finish date of the project can easily be recognized. The finish date scheduled by Microsoft Project differs significantly from the targeted finish date. This is interesting because both the rough
6stimat6s and th© durations 0nt©r©d to th© softwar© ar© d©t©rmin©d by proj©ct manag©rs; and th©r©for©, th©y are ©xp©ct©d to b© th© sam©. How©v©r, this is not th© cas©. It is lik©ly that th© r©ason for this inconsistoncy is th© w©akn©ss of th© data about th© work br©akdown and tim© ©stimat©s. This issu© is discuss©d in Chapt©r 4 in mor© d©tail.
L©aving this inconsist©ncy asid©, it is now tim© to turn back to th© analysis. Sine© th© finish dat© d©t©rmin©d by th© softwar© is lat©r than th© on© stat©d in th© contract, further analysis is required in order to reduce th© gap between th© targeted and th© scheduled finish dates.
3.3.6. Crashing the Project
Sine© th© scheduled finish dat© of th© project is later than th© targeted date, th© overall project completion tim© must be shortened so that th© project is finished on June 30, 1996 as targeted. As described earlier, on© way of achieving a shorter project time is to use additional resources. This results in shorter activity times, however, also in higher costs.
In this project, there is a difference of 19 days between the scheduled and the targeted date. In order to eliminate or at least reduce this difference, the activities should be crashed as much as possible, resulting in acceptably higher costs. When the activities in this project are examined, it is seen that only a number of them are subject to crashing. The activities that are subject to crashing are assigned new time estimates that are shorter than the previous ones. These
new time estimates are called ‘crash times’. These activities are also assigned new costs in accordance with the new time estimates. These ‘crash time costs’ are based on the assumption that, for shortening the activity times, the only solution used is working overtime. This assumption is derived from the project managers’ experience that they usually prefer working overtime instead of assigning more people to the job. The reason is that there are rarely any workers who are free to be assigned to other jobs. In addition, especially for medium- scale projects such as this one, it is not very feasible to hire new workers and teach them the job. This method is applied only for projects of very large scale.
The activities that can be crashed are listed in Table 3, with their normal and crash times, and normal time costs and crash time costs. The notations and calculations used in Table 3 is as follows:
Normal time (tn); The initially assigned duration or the expected duration of the activity.
Crash time (tc): The duration of the activity when additional resources are used.
Normal time cost (Cn) : The initially assigned cost or the cost associated with the expected time of the activity.
Crash time cost (Cc) : The cost of the activity when additional resources are used and the activity time is shortened.
Maximum crash time (M) = tn - tc ; The amount of time the activity can be crashed at most.
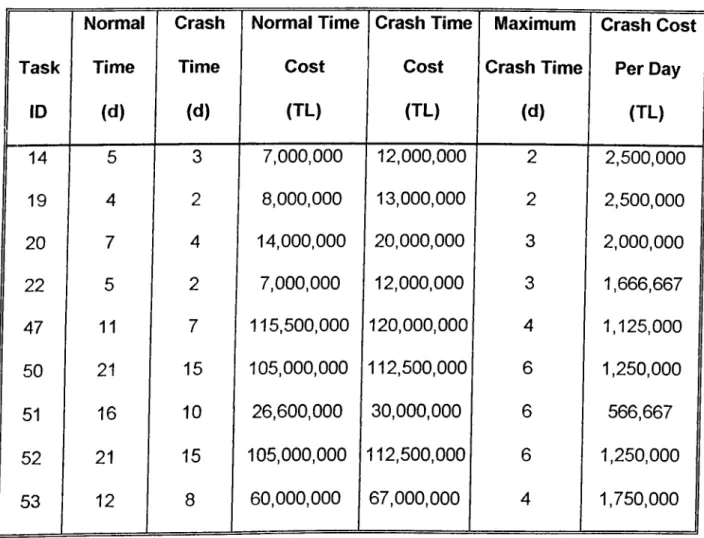
Table 3. Normal and crash time and cost estimates for activities that can be crashed.
Crash cost per unit (C) = (Cc - Cn) / M ; The additional cost required for crashing the project for one unit of time.
Normal Crash Task ID Time (d) Time (d ) Normal Time Cost (TL) Crash Time Cost (TL) Maximum Crash Time (d) Crash Cost Per Day (TL) 14 19 20 22 47 50 51 52 53 5 4 7 5 11 21 16
21
12 3 2 4 2 7 15 10 15 8 7.000. 000 8.
000.
000 14.000. 000 7.000. 000 115.500.000 105.000. 000 26.600.000 105.000. 000 60.000. 00012
,000,000
13.000. 00020
.000
.000
12
,000,000
120
,000,000
112.500.000 30.000. 000 112.500.000 67.000. 000 2 2 3 3 4 6 6 6 4 2.500.000 2.500.000 2,000,000 1.666.667 1.125.000 1.250.000 566.667 1.250.000 1.750.000The calculations summarized in Table 3 are based on a very important, yet, not very realistic, assumption. In calculating the crash cost per day, it is assumed that crashing costs are linear. However, this is rarely the case. In reality, the cost associated with an activity tends to be a decreasing nonlinear function of time, possibly with some discrete changes within its range (Acar, 1993).
In crashing the project, the important thing is to find the least costly way for reducing the entire project duration. In this regard, the logical choice is to start with the activities with lower unit crashing costs. However, there is one more point about the choice of the activity to start crashing. The activity to be crashed should be on the critical path because critical activities are the only ones that affect the project completion time. Other activities already contain slacks, and therefore, crashing them only increases the amount of slack time. Crashing these activities have no effect on the completion time of the project. In addition, the crashing of noncritical activities results in unreasonably increased activity and project costs. Therefore, it would be a waste of money to crash noncritical activities.
In this project, among the activities that can be crashed, only task 52 and task 53 lie on the critical path. Therefore, as the first step, either task 52 or task 53 should be crashed. For this moment, it is useless to consider the other activities since they are not on the critical path. When the unit crashing costs are considered, it is seen that task 52 has a lower unit crashing cost, which is 1,250,000 TL. Since the aim is to reduce the duration of the critical path with the lowest cost, to start crashing with task 52 is the appropriate choice. Now, the question is how much we should crash task 52.
An examination of precedence relations in Appendix C indicates that task 22, task 50 and task 52 precede task 53. From Appendix E, it is known that task 22 has a free slack and a total slack of 75 days. Also, task 50 has a free and tot^l slack of 39 days. That means the start date of task 53 is determined by task 52.