MODELING CELLULAR PROCESSES WITH PATIKA
A THESIS SUBMITTED TO
THE DEPARTMENT OF MOLECULAR BIOLOGY AND GENETICS
AND
INSTITUTE OF ENGINEERING AND SCIENCE
OF BILKENT UNIVERSITY IN PARTIAL FULFILLMENTOF THE REQUIREMENTS FOR THE DEGREE OF
MASTER OF SCIENCE
by Emek DEMİR 19 September 2001
I certify that I have read this thesis and that in my opinion it is fully adequate, in scope and quality, as a thesis for the degree of Master of Science
__________________________________ Assist. Prof. Rengül Çetin Atalay
I certify that I have read this thesis and that in my opinion it is fully adequate, in scope and quality, as a thesis for the degree of Master of Science
__________________________________ Prof. Mehmet Öztürk
I certify that I have read this thesis and that in my opinion it is fully adequate, in scope and quality, as a thesis for the degree of Master of Science
__________________________________ Assoc. Prof. Mustafa Pınar
I certify that I have read this thesis and that in my opinion it is fully adequate, in scope and quality, as a thesis for the degree of Master of Science
__________________________________ Assist. Prof. Attila Gürsoy
Approved for the Institute of Engineering and Science __________________________________
Prof. Mehmet Baray,
ABSTRACT
MODELING CELLULAR PROCESSES WITH PATIKA Emek Demir, B.S., Bilkent University
M.S. In Molecular Biology and Genetics Supervisor: Assistant Professor Rengül Çetin Atalay
19 September 2001, 62 pages
Availability of the sequences of entire genomes shifts the scientific curiosity toward the identification of function of the genomes in large scale as in genome studies. In the near future data produced about cellular processes at molecular level will accumulate with an accelerating rate as a result of proteomics studies. In this regard, it is essential to develop tools for storing, integrating, accessing, and analyzing this data effectively.
We define an ontology for a comprehensive representation of cellular events. The model presented here enables integration of fragmented or incomplete pathway information and supports manipulation and incorporations of the stored data, as well as multiple levels of abstraction. Based on this model, we present an integrated environment named PATIKA (Pathway Analysis Tool for Integration and Knowledge Acquisition). PATIKA is composed of a server-side, scalable, object-oriented database and client-side editors to provide an integrated, multi-user environment for visualizing and manipulating network of cellular events. This tool features automated pathway layout, functional computation support, advanced querying and a user-friendly graphical interface.
We expect that PATIKA will be a valuable tool for rapid knowledge acquisition; micro array generated large-scale data interpretation; disease gene identification and drug development.
Keywords: bioinformatics, cellular pathways, object oriented database, automated
ÖZET
PATIKA İLE HÜCRESEL OLAYLARIN MODELLENMESİ
Emek Demir, B.S., Bilkent Üniversitesi Molekuler Biyoloji ve Genetik Yuksek Lisans Tezi Tez Yoneticisi: Yardimci Docent Dr. Rengül Çetin Atalay
19 Eylül 2001, 60 sayfa
Çeşitli genomların DNA dizilerinin ortaya çıkarılmasıyla, bilimsel ilgi, genomların işlevlerinin büyük ölçekli çalışmalarla çözümlenmesinde yoğunlaşmaktadır. Bu tür proteom çalışmaları sonucu, yakın gelecekte hücresel olaylar hakkındaki bilgimiz artan bir ivmeyle çoğalacaktır. Bu verileri saklayacak, birleştirecek, erişimini ve çözümlenmesini sağlayacak araçların geliştirilmesi öncelikli gerekesinimlerden biridir.
Bu çalışmada, hücresel işlemlerin modellenmesi için yeni bir ontoloji
tanımlanmaktadır. Önerilen ontoloji, yeni bilgilerin eklenmesini ve parçalı ya da eksik verilerin birleştirilmesini sağlamasının yanısıra, varolan modelin değiştirilmesine ve birden çok düzeyde soyutlanabilmesine olanak tanımaktadır. PATİKA bu ontoloji üzerine kurulmuş tümleşik bir hücresel yolak modelleme ortamıdır. PATIKA, sunucu tarafında nesneye-dayalı, ölçeklenebilir bir veri tabanı ve istemci tarafında görsel düzenleyiciler ile çok kullanıcılı bir ortam sunmaktadır. PATIKA ayrıca özdevimli patika yerleşimi, işlevesel hesaplama desteği, ileri sorgulama olanakları ve kullanıcı dostu görsel arabirim gibi özellikleri de içermektedir.
PATIKA`nın gelecekte hızlı bilgi edinimi, geniş ölçekli verilerin yorumlanması, ilaç tasarımı ve hastalık-gen ilişkilerinin belirlenmesi gibi alanlarda onemli bir araç olmasını bekliyoruz.
Anahtar Sözcükler: biyoinformatik, hücresel yolaklar, nesneye dayalı veritabanı,
ACKNOWLEDGMENTS
I wish to express my gratitude to my supervisor, Assist. Prof. Rengül Çetin Atalay, who made this work possible by her guidance, support and understanding. Her experience in biology and acquaintance to the computer jargon made it possible to identify problems and facts, that would be unnoticed otherwise.
I would like to thank Prof. Mehmet Öztürk for providing us with the initial idea, and sharing his expertise with us. His significant remarks and insights on biological phenomena and needs of the scientific community was invaluable to the project.
Assist. Prof. Uğur Doğrusöz was vital to the project as he led most of the design efforts both on model and editor, and I will not attempt to hide the fact that he was an example of determination and dedication for me.
Assist. Prof. Atilla Gürsoy receive my gratefulness for the efforts he put in
development of the server, his excellent ideas, challenging questions and his most pleasant personality.
I just can not thank Özgün Babur enough. He was a valuable team member, putting an incredible amount of time and effort into PATIKA. Moreover he was an infinite source of friendship, support, criticism and patience.
Berkin Özmen, Çağdaş Evren, Suha Onay, Evren Şahin and Engin Şenel receive my thankfulness for their help with the implementation.
I also wish to thank Aslı Ayaz, for her support and patience and for making me smile when I thought it was impossible.
Table of Contents
MODELING CELLULAR PROCESSES WITH PATIKA... I
ABSTRACT...IV
ÖZET... V
ACKNOWLEDGMENTS...VI
TABLE OF CONTENTS... VII
LIST OF FIGURES...IX
LIST OF TABLES...IX
1 INTRODUCTION... 1
2 THEORY AND BACKGROUND... 3
2.1 CELLULAR PATHWAYS... 3
2.1.1 Representing molecules... 6
2.1.2 Representing events... 7
2.1.3 Spatial – non Spatial... 9
2.2 PREVIOUS WORK... 9
2.2.1 Still Image Databases... 9
2.2.2 Interaction and Pathway Databases... 11
2.2.2.1 Interaction databases...11
2.2.2.2 Metabolic Pathway Databases...12
2.2.2.3 Signaling Pathway Databases...14
3 SYSTEMS AND METHODS... 15
3.1 PATIKAONTOLOGY... 15
3.1.1 States, Transitions and Interactions... 15
3.1.2 Summaries, Interpathway and Meta Interactions... 16
3.1.3 Compartments and Cell Models... 18
3.1.4 Bioentities... 19 3.1.5 Pathways... 19 3.2 PATIKA ARCHITECTURE... 20 3.3 SERVER... 22 3.3.1.1 Databases...23 3.3.1.2 User Operations...24 3.3.1.3 Queries...26 3.3.1.4 Submissions...28 3.3.2 Client... 31 4 IMPLEMENTATION... 34 4.1 MODEL... 34 4.2 SERVER... 34 4.3 CLIENT... 36 5 DISCUSSION... 38
5.1 ANALYSIS OF THE ONTOLOGY... 38
5.1.1 Coverage... 38
5.1.2 Data Integration... 39
5.2 COMPARISON OF PATIKA... 40 5.3 DATA ACCUMULATION... 42 5.3.1 User Entries... 42 5.3.2 Importing Data... 42 5.3.3 Data Mining... 43 5.4 APPLICATIONS OF PATIKA... 43
5.4.1 Rapid Knowledge Acquisition... 43
5.4.2 Micro Array Data Analysis... 44
5.4.3 Drug Design... 45 5.5 PERSPECTIVES... 45 5.5.1 Layout... 46 5.5.2 Simulation... 47 5.5.3 Spatial Models... 47 6 CONCLUSION... 48 7 REFERENCES... 49
List of Figures
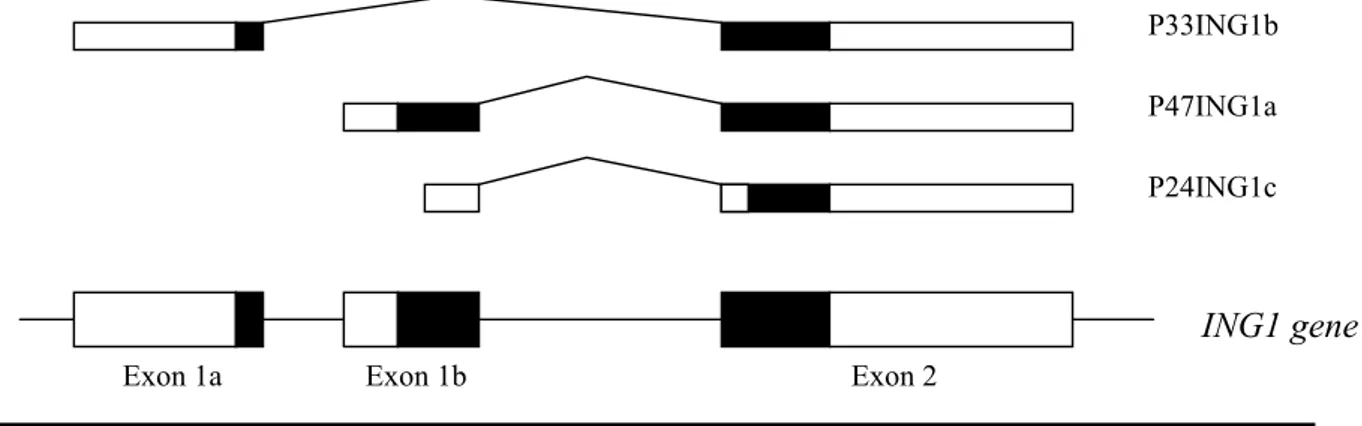
FIGURE 1: MULTIPLE PROTEINS FROM ONE GENE... 4
ING1 GENE ENCODES FOR THREE PROTEIN PRODUCTS VIA DIFFERENT SPLICE FORMS... 4
MODELING CELLULAR PATHWAYS... 5
FIGURE 2: LIFE CYCLE OF A MOLECULE:... 5
FIGURE 3: PATIKA MODEL... 16
FIGURE 4: PATIKA SUMMARY... 17
FIGURE 5 : AN OVERVIEW OF PATIKA ARCHITECTURE... 20
FIGURE 6: PATIKA SERVER ARCHITECTURE... 22
FIGURE 7: ORPHAN INTERACTIONS:... 29
FIGURE 8: PATIKA CLIENT ARCHITECTURE... 31
List of Tables
TABLE 1: A REVIEW OF SOME MODELING STRATEGIES... 8TABLE 2:PATIKA USER TYPES... 26
1 Introduction
Life is a dynamic and highly complex process (Segre and Lancet 2000). An organism competes with other organisms for resources, tries to transmit its information to the next generations and struggles to survive. Problems faced during this struggle are not
straightforward and they often require decision-making mechanisms for a good solution. Even prokaryotic genomes, with a few thousand genes, encode a fascinating array of
regulatory proteins creating a network of information, ultimately dictating the cell what to do under existing conditions (Miklos and Rubin 1996; Arnone and Davidson 1997; Blattner, Plunkett et al. 1997). Human genome, which contain at least 28.000 genes(Jasny and Kennedy 2001; Lander, Linton et al. 2001) , is expected to create an extremely complex network, composed of hundred thousands of different molecules and factors . In this regard a cell can be considered as an inherently complex multi-body system (Hanahan and Weinberg 2000). In order to make useful deductions about such a system, one needs to consider cellular pathways as an interconnected network rather than separate linear signal routes. Knowing the exact map of this network is very important since it potentially explain the mechanisms of life processes as well as disease conditions. Such knowledge will also serve as key tool for further biomedical applications such as new drugs and diagnostic approaches (Vidal 2001).
Although our knowledge about cellular processes is increasing at a rapidly growing pace, it is presently incomplete and fragmented. One of the most important challenges in bioinformatics is development of tools to represent and integrate this knowledge.
Consequently, we are witnessing the emergence of many different approaches to the development of “pathway databases”.
provide the scientific community with an internet-based modeling environment where every member in the community may take part in the construction of such a database. Successful examples like GenBank and PDB support such an approach to the problem of high
complexity. We will also need facilities for retrieving and analyzing the network between entities. It is expected that development of such databases and tools will be one of the major research subjects in bioinformatics for the next few year (Endy and Brent 2001; Vidal 2001).
PATIKA (Pathway Analysis Tool for Integration and Knowledge Acquisition) is an integrated software environment designed to provide researchers a complete solution for modeling and analyzing cellular processes with visualization and querying. The PATIKA project aims to build a public database of all cellular processes using a regular, simple yet comprehensive model. Such a database would benefit the entire scientific community but would be especially invaluable to researchers using high-throughput techniques.
This M.S. Project includes building the underlying model, designing the mentioned software, and implementing some components of the software. PATIKA is an ongoing project as of the date this thesis is written.
First two chapters of this thesis lay out the background information for cellular pathways and describe previous research on modeling them. Chapter 3 describes our model and discusses its suitability to the requirements dictated by the needs of the scientific community. Chapter 4 explains the architecture of the software tool we are currently developing. Finally, the last chapter discusses our current progress, future directions and possible applications of the PATIKA.
2 Theory and Background
2.1 Cellular Pathways
Every second a cell makes hundreds of decisions. This is accomplished by
transmitting signals across chains of interacting molecules. Decisions are made based on the amount of relevant signals where these chains intersect. These intersecting chains form networks often specialized in regulating a certain phenomena. Although blueprints of this network are encoded in the genome, we are still unable to interpret this data as a cell does regularly. What we often need is a human readable abstraction of events that is happening in a cell, describing the information, which are known as cellular pathways.
Traditionally there is a tendency to define a pathway as an isolated chain responsible for transmitting a certain signal. However, as our knowledge about cellular pathways
increases, it is becoming evident that in order to be able to make predictions one needs to consider cellular pathways as an interconnected network rather than separate linear signal routes. Similarly, definition of a signal is becoming less clear as we now have to consider cases where a “signal” splits, merges and creates feedback loops. Although little ambitious, perceiving cellular pathways as sub-graphs of a single global pathway can provide more meaningful models, for purposes of analysis.
System we are dealing with is an inherently complex multi-body system. It is important to asses at least the magnitude of its complexity. If we try to approximate the number of interactions in a human cell, in higher organisms, each gene or protein interacts approximately with seven other proteins on the average. Although there is an ongoing controversy about the issue, we also know that the number of human genes is at least 28.000
are approximately 1.2 proteins per gene (Miklos and Rubin 1996; Arnone and Davidson 1997) (Fig. 1). Using these approximations, we end up with a network of more than one million interactions. If we consider the small molecules and macromolecule complexes as well, this number increases to the order of millions of entities. However, practical complexity can even be higher depending on the representation models.
Figure 1: Multiple proteins from one gene
Ing1 gene encodes for three protein products via different splice forms. Exon 2 Exon 1b Exon 1a P47ING1a P33ING1b P24ING1c ING1 gene
Modeling Cellular Pathways
In a cell, decision mechanisms are governed by molecules. Molecules can be macromolecules (such as DNA, RNA or Protein), small molecules (such as ions or small organic compounds) or complexes of those. Additionally physical factors like radiation or heat also takes role in these decision-making processes. Molecules have the ability to interact with each other in an information dependant manner and respond to changes in the
environment accordingly.
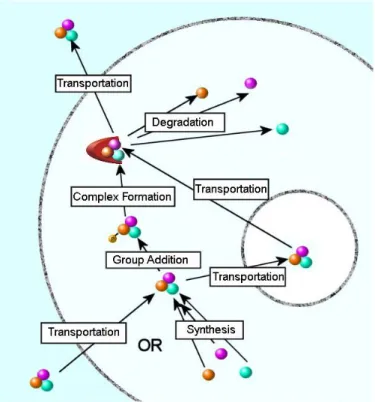
Figure 2: Life cycle of a molecule:
Life cycle of a molecule starts with a synthesis or transportation. Its information context is modified by a series of transitions. Finally, it is either degraded or transported out of the cell.
A molecule starts its life cycle by either being synthesized from its precursors or transported into the cell, then it goes through a series of transitions. Examples of transitions are group addition and removals, isomerisations, complex formations and transportations. Each transition changes the information carried by the molecule, transforming it into a new state. Examples of states are phosphorylated state of a protein or a certain splice form of
physiological condition and a very different one under another condition. In fact, this is the very mechanism of cellular regulation.
First step towards modeling cellular pathways is to define ontology of the model. An ontology is a formal specification of one’s conceptualization of the phenomena of interest. It is a scheme-linking model to real life events.
Effectiveness of the ontology is strictly related to the goal we are aiming.
Requirements of an information system, simply outlining the phenomena is much different from a stochastic simulation. There are a few important parameters defining the effectiveness of an ontology
2.1.1 Representing molecules
In a cell, most of the information processing occurs via state switches in
macromolecules (i.e. phosphorylated state of certain protein vs. its non-phosphorylated state). A shorthand representation commonly used in biological literature denotes molecules as small automatons, and opt not to represent each state of the molecule explicitly for the sake of brevity. Sometimes so-called “active” and “inactive” states are represented separately. Obviously, this is an incomplete solution since a molecule has often more than two states and its active form may change depending on one’s point of view. Consequently, some prior knowledge is often required to interpret these graphs.
These representations also use hyperedges, the edges that has more than one source or target points, extensively, in order to represent interactions involving more than two
molecules. This poses another restrain for visualization and analysis. Although these problems may not have been significant so far due to relatively less complexity of the data, they will surely cause problems as the average number of molecules per pathway increases.
An alternative is to denote each state explicitly. This bestows clarity to the model however, resulting in an increase in modeling and analysis times. Moreover, for the cases where the mechanistic details are not known (i.e. which state of a molecule actually participates in a reaction) such a model must provide additional solutions to model incomplete but important information.
2.1.2 Representing events
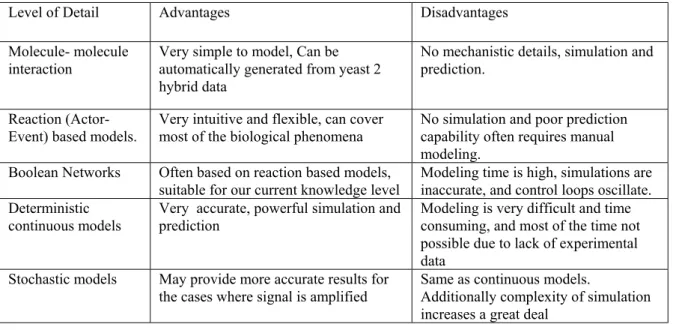
Representation of events that changes the information content of a cell is a crucial part of ontology. There are multiple levels of detail ranging from outright qualitative models in which we only state the nature of the transition, to the complete quantitative model in which we define the transition complete with reaction orders and constants (Table 1). The former is suitable for modeling large-scale networks where the detailed biochemical data is not available. The latter is suitable for smaller networks in which simulation and prediction capabilities are critical.
Level of Detail Advantages Disadvantages Molecule- molecule
interaction Very simple to model, Can beautomatically generated from yeast 2 hybrid data
No mechanistic details, simulation and prediction.
Reaction (Actor-Event) based models.
Very intuitive and flexible, can cover most of the biological phenomena
No simulation and poor prediction capability often requires manual modeling.
Boolean Networks Often based on reaction based models, suitable for our current knowledge level
Modeling time is high, simulations are inaccurate, and control loops oscillate. Deterministic
continuous models
Very accurate, powerful simulation and prediction
Modeling is very difficult and time consuming, and most of the time not possible due to lack of experimental data
Stochastic models May provide more accurate results for the cases where signal is amplified
Same as continuous models.
Additionally complexity of simulation increases a great deal
Table 1: A review of some modeling strategies
Each molecule in the cell has a concentration, representing the amount of this molecule in the cell. Most of the time, the concentration of the molecules is critical for the decision-making process. One can either assume sharp thresholds and changes in these values or try to consider the concentrations. Most of our current knowledge lacks the specific
concentration data for each molecule. Similar to chemical information detail, boolean systems, in which a state is either present (above threshold) or not (below threshold) is
suitable for large-scale modeling with weaker predictive value. On the other hand, continuous models can provide results that are more accurate but are only suitable for smaller systems in which modeling time is manageable and data is available.
In lower organisms like prokaryotes or viruses, there are processes in which a single molecule can change the behavior of the organism. Lambda phage, for example uses this to switch between lytic and lysogenic cycles unpredictably, weakening its hosts defenses. Such cases are extremely difficult to model by deterministic systems. Instead, it is possible to use stochastic methods that are able to handle such small changes. Stochastic methods are typically based on continuous systems where deterministic equations are replaced by their
stochastic counterparts. They share the same weaknesses with the continuous models and additionally their simulation and modeling complexities are even higher.
2.1.3 Spatial – non Spatial
Multicellular organisms highly depend on cell-cell interactions for many processes like development, immune response and cognition. Therefore, it is crucial to model
intercellular interactions as well as intracellular ones. However, this poses a completely new set of concepts to model like cell-types and states, cellular neighborhood concept, tissues and ultimately an organism. Simulation of such a system is also a much more difficult one.
It seems that other than few specific applications like modeling tumor growth, our current understanding of living organisms are not sufficient for a complete spatial model.
2.2 Previous Work
There is a long tradition of representing cellular pathways as a graph in biological literature. Although there have been a few efforts to provide the scientific community with a regular representation system, none of them has been widely accepted. Today researchers are looking for new options to provide the community with regular models to manage ever-increasing cellular pathways data.
2.2.1 Still Image Databases
Still image databases aim to build a database of still images to represent cellular mechanisms. Still images have the advantage of being built most easily, since one does not need to spend time to learn a biological ontology (which often has steep learning curves) and have the freedom of modeling the phenomena as he/she thinks.
One of the most famous of these attempts is the Boehringer Mannheim Biochemical Pathways Chart.1 These wall charts, are edited by retired Boehringer Mannheim researcher Dr. Gerhard Michal, and covers a quite large amount of metabolic pathways as well as regulatory pathways. It is also possible to access a digitized version of these charts on the ExPASy Proteomics Server of the Swiss Institute of Bioinformatics.2 Digitized version also features an index of metabolites and enzymes as well as links to the ENZYME database.
Biological Biochemical Image Database (BBID) 3 provides researchers with a set of images from published articles along with an index to locate the images of interest. BBID also accepts images from other researchers.
BioCarta4 also provides still images of biological pathways. However, it is different from other still image databases in a number of ways. In an attempt to create a standard, BioCarta provides researchers with a set of image templates for creating pathway models. Additionally submitted images are edited further to create clickable maps linking other databases of interest to the model. Finally, BioCarta uses a guru-researcher system in order to create a self-curating/self-administrating environment.
Signaling pathways database (SPAD)5 provides clickable still image maps along with data files for each molecule. It focuses on extra cellular signaling pathways and provides data for each molecule. SPAD does not have a regular ontology and does not support
computations. 1 http://biochem.boehringer-mannheim.com/prodinfo_fst.htm?/techserv/metmap.htm 2 http:/ www.expasy.ch/cgi-bin/search-biochem-index 3 http://bbid.grc.nia.nih.gov 4 http://www.biocarta.com
However still images are inherently handicapped since they are not reusable and they cannot be integrated automatically. Although image databases are very valuable and provide a backbone for further research, we ultimately need more reusable, merge capable models for putting together our knowledge about cellular pathways.
2.2.2 Interaction and Pathway Databases
It is possible to classify the databases that model cellular processes using a regular model into three: interactions databases, metabolic pathway databases and signaling pathway databases.
2.2.2.1 Interaction databases
Widespread use of yeast two hybrid and similar “fishing” methods generated many protein interaction data in the recent years. Similarly better understanding of DNA-Protein binding enabled us to detect proteins that bind to DNA. In an attempt to cope with these data, interaction databases have been developed. Rather than modeling cellular processes as a whole, these databases take the approach of identifying one to one interactions between molecules. Some of them also create pathways (or similar graphs) from this data on the fly.
One of the most significant interaction databases is Database of Interacting Proteins 6 (DIP). It currently contains 9746 interactions among 5703 proteins. It is possible to query these interactions and visualize it using an applet (JDip). DIP is tightly linked to PIR and SwissProt and it accepts submissions from users.
Biomolecular Relations in Information Transmission and Expression (BRITE)7 is another database of binary relations for computation and comparison of graphs. It contains
diverse sets including i)the generalized protein-protein interactions from metabolic databases, ii) systematic experimental data on protein-protein interactions by yeast two-hybrid systems, iii) sequence similarity relations by SSEARCH, iv)co-expression patterns by micro array gene expression profiles.
Major disadvantage of these databases is they often miss other important interactions with small molecules and physical factors. Additionally lacking a meta-structure, they are poor on representing cellular process on multiple levels. However, their unit-based approach makes them the most suitable structure for integrations. For example, such databases can be constructed automatically from yeast two hybrid data.
2.2.2.2 Metabolic Pathway Databases
Although there is no distinct line between metabolic and signaling pathways, it
appears that our knowledge about metabolic pathways are much more detailed and structured. As a result, databases mainly focusing on the metabolic parts of an organism are more
extensive compared to their signaling counterparts. In all of these databases, the enzymes are classified according to the Enzyme Commission list of enzymes (EC numbers).
One of the well-known metabolic databases is Kyoto Encyclopedia for Genes and Genomes (KEGG)(Ogata, Goto et al. 1999)8 . KEGG is composed of a set of still images defining metabolic pathways, a set of tables defining relationships and orthologous entries, and hierarchal texts defining these entries. These components are backed up with a querying system that allows users to extract pathways. Although KEGG started as a metabolic
pathways database, it recently started an initiative for modeling cellular signaling processes as well. However signaling part lacks the ontology of the metabolic part and is not a truly pathways database.
A similar database is What Is There?(WIT) (Selkov, Grechkin et al. 1998) 9. WIT Project attempts to produce metabolic reconstructions for sequenced (or partially sequenced) genomes. It currently has a set of over 25 such reconstructions and 2900 diagrams defining metabolic pathways. It is strictly metabolic and focuses on the lower organisms. WIT also features basic querying.
Another important database is BRENDA10, which is a collection of enzyme functional data. Some 3500 "different" enzymes are covered. The data collection is being developed into a metabolic network information system with links to Enzyme expression and regulation information. Brenda lacks any computational tools other than basic queries and has no visualization support.
Metabolic pathways are more manageable compared to signaling pathways in both terms of complexity and numbers. Therefore, efforts for drawing every interaction in those pathways as a still image have proved to be successful. These databases have a rigid definition of a pathway and they never create a pathway on the fly. Unfortunately, these features are essential for regulatory pathways.
EcoCyc(Karp, Riley et al. 1999; Karp 2000) 11 is one of the most serious attempts towards building an ontology for metabolic pathways. EcoCyc features the entire small molecule metabolism in E.Coli and provides support for querying and computation. EcoCyc is also the first true attempt to an integrated environment since it also provides visual tools for analyzing and displaying cellular environments.
8
http://www.genome.ad.jp/kegg/
2.2.2.3 Signaling Pathway Databases
Signaling pathway databases take the challenge of modeling signaling networks that are more complex. As the complexity of the phenomena increases efforts focuses on
decreasing modeling time and increasing regularity of the model. This is not a trivial task and led to different approaches.
Cell Signaling Networks Data base (CSNDB) is a data- and knowledge- base for signaling pathways of human cells. It compiles the information on biological molecules, sequences, structures, functions, and biological reactions that transfer the cellular signals. Signaling pathways are compiled as binary relationships of biomolecules and represented by graphs drawn automatically. CSNDB’s pathfinder querying mechanism is probably one of the pioneering works in the field. Unfortunately, CSNDB suffers from a naive data model in which you may get multiple instances of the same molecule or their orthologous and generic variants in the same graph.
TRANSPATH(Wingender, Chen et al. 2000; Wingender, Chen et al. 2001) 12employs a powerful hybrid ontology of both mechanistic (actor-event based) and semantic for
describing cellular events. It has a well-defined structure and an extensive content. It focuses on pathways involved in the regulation of transcription factors. All data is extracted by experts from the scientific literature. TRANSPATH features a basic querying system that allows searching for molecules. TRANSPATH currently does not support computations but has a very suitable structure as long as all data entries are made in mechanistic model.
12
3 Systems and Methods
3.1 PATIKA Ontology
PATIKA ontology is developed for providing the scientific community a regular, comprehensible yet expandable model. The model should facilitate easy integration of new type of data and functionality to the model.
3.1.1 States, Transitions and Interactions
We propose to represent each state as a separate node in the graph. A molecule may have any number of states to depict changes in its information context. A state can be a macromolecule, a small molecule, a complex or even physical phenomena like light. In addition, each transition is represented as a distinct type of node, making it possible to use normal edges instead of hyperedges. Although, one may claim that considering membrane transportation of a large molecule and phosphorylation of glucose similar is a rather rough approximation, we believe that concepts in both events are the same and the difference is in the complexity. Transitions provide a convenient mean for representing event-specific information like reaction constants or the complex regulatory behavior. Each transition has a number of associated states. States may be substrates, products, or effectors of the transitions (Fig 3). These relations are represented by different edge types.
This model is very similar to the chemical equations of the form:
B A→C
where A is a substrate, B is a product, and C is an effector. This analogy is very useful since most of the biological reactions are essentially chemical reactions. Other non-chemical phenomena like transportation can be described with the above model as well.
These definitions automatically impose some invariance to the model. Each interaction of type product must have a transition as its source and a state for its target. Similarly, each interaction of type substrate, activator or inhibitor has a state as its source and a transition for its target. As a result, the PATIKA model forms a bipartite graph, where each transition is connected to a set of states, and each state is connected to a set of transitions. No state or transition can be connected to itself or any other node of the same type (Fig 3).
Figure 3: PATIKA model
Representation of a basic cellular interaction using PATIKA model. Edges represent “is a” relation. (e.g green is an activator of t).
3.1.2 Summaries, Interpathway and Meta Interactions
A summary is a set of states and transitions with some specific restrictions.
Summaries let us condense trivial interactions and model incomplete information. They also introduce two new types of interactions, into pathway interactions and meta interactions. An interpathway interaction is an interaction that defines a relation between a node inside the summary and a node outside. A meta interaction is an interaction between an outside node and the summary itself. It represents a relation with incomplete information (i.e. the exact mechanism is not known).
Summaries also carry an identity; they are either states (summary states) or transitions (summary transitions) (Fig.4). They have the same restrictions as plain states and transitions respectively.
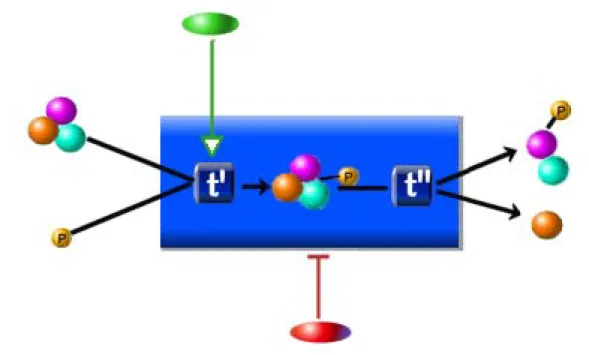
Figure 4: PATIKA summary.
Representation of a summary state. Substrates and activator to t' and products of t" are interpathway interactions where inhibitor interaction is an example of a meta edge indicating that the red node somehow inhibits the summary transition (represented with the large blue box). Also, note that this summary details the transition represented in Figure 2.
There are cases where an abstraction for a certain series of events is necessary, as in the case of apoptosis or glucose metabolism. Details of these processes are rarely of interest to a common user, and it is meaningful to represent these nodes as abstract states or
transitions, with the details hidden. However, it is also important to be able to model details in the case where mechanism becomes important to the user. The PATIKA model uses summaries for encapsulating these details, which can be inspected further upon the request of the user. It is also possible to nest summaries inside summaries, allowing user to model and
For most of the cellular processes, our knowledge is far from complete. Although the nature of the event is known, it is very probable that the details are still unclear. The
PATIKA model allows representation of incomplete information by defining meta edges representing incomplete information. Consider the case where we want to detail the
mechanism we represented in Figure 2; however, we have details only for the activation of the mechanism. In that case, we represent the inhibition with a meta edge (Figure 3) indicating that our knowledge is inadequate to assess how exactly the inhibition occurs.
3.1.3 Compartments and Cell Models
A cell has a structure and compartments, like organelles, membranes, and regions. A change in the compartment of a state is considered as a change in its information content since it restricts the molecules it may interact. For example, normal cyctochrome C in
mitochondria having a role in metabolism induces apoptosis if it is released to the cytoplasm. Similarly most transcription factors, when activated, translocates to nucleus to induce gene expression.
Each state in the PATIKA model has a compartment. A compartment has a set of neighboring compartments (e.g. cytoplasm and cytoplasm membrane) where interactions are possible. States pass through transportation transitions to create new states in a different compartment.
Structure of cells may differ even between tissues in an organism largely. Neurons for example differ considerably from lymphocytes. Difference between different organisms, as in the case of eukaryotes and prokaryotes are even more drastic. A cell model is a definition of the structure of the cell. It defines compartments and their definitions. Each PATIKA pathway has a cell model, and each of its states is assigned their compartments according to
3.1.4 Bioentities
It is critical to assess as much information as possible to the states in order to be able to encompass most of the biological information that is already available. In order to achieve this goal one needs to have additional attributes on the states other than graph topology. It is also important to have cross-links to other biological databases. One observation is that PATIKA ontology defines multiple states for a single entry in most of the biological
databases (i.e. RNA, DNA and multiple forms of the protein product of a gene is represented as a single entry in Swiss-Prot). In order to model this conventional grouping, PATIKA uses bioentities, set of states that are traditionally grouped under a single title. Bioentities are most useful and populated for macromolecules where a single information base (genetic code) leads to multiple states.
3.1.5 Pathways
A pathway is a bipartite graph of states and transitions. It defines a certain abstraction of a biological phenomenon. Each element of the model is defined in the context of a
pathway. In that sense, pathway is the central element of our ontology.
Each pathway has a list of states, transitions, interactions as well as bioentities. It has a cell model defining the structure of the cell for which this pathway is defined.
Pathways can be nested through summaries and they can be merged to each other, ultimately forming a “big picture” that defines all the interactions in a cell.
We believe that the resulting model is flexible enough to encompass most of the biological phenomena while maintaining a well-defined and comprehensible structure.
3.2 PATIKA Architecture
We define an Integrated Pathway Editing Environment (IPEE) as a tool, which aims for a complete solution for editing, analyzing and accumulating cellular process data. It features tools for visualization, query and simulation of pathways. Increasing complexity of our current knowledge on cellular processes creates an important demand for such tools.
PATIKA is an integrated pathway-editing environment developed for modeling and integrating our current knowledge on cellular pathways and facilitating analysis of this data. PATIKA uses client-server architecture for achieving this task. The server acts as a common database and manages queries and submissions as well as users. The PATIKA client, on the other hand, provides a user-friendly interface for querying, retrieving, visualizing and manipulating pathway information from the database.
Figure 5 : An overview of PATIKA architecture.
Server side communication is done via RMI while client-server communication is done via HTTP.
PATIKA has three levels of classes, model, database and editor levels. Model level describes PATIKA model in an abstract manner. Database and editor level objects inherit from their corresponding model level object. Database level objects are persistent capable
Client Side
Client Side Server SideServer Side
PATIKA Editor PATIKA Editor Proxy Proxy Servlet Manager Servlet Manager PATIKA Database PATIKA Database HTTP RMI PATIKA Managers PATIKA Managers RMI
and keep minimal information to increase database performance. On the other hand, editor level objects have extra functionality required for editor operation like drawing.
PATIKA is designed as an internet based application. It uses Java’s Servlet
Technology for client-server communications. Additionally PATIKA server is designed to run on multiple machines, and be scalable. PATIKA server uses JAVA’s Remote Method Invocation (RMI) technology for server side communications.
The reason behind using two different communication systems is the nature of the communication. RMI presents a programmatic interface for networking rather than relying on the sockets and streams approach. The method's major advantage is that it offers you a
higher-level, method-based interface in which a remote object is treated as though it was local. Although RMI has HTTP tunneling, allowing users to connect over the internet, several bugs and limitations make RMI impractical for an HTTP based connection. It appears that HTTP is too unstable for RMI and overriding default port behavior disables HTTP tunneling. Servlets are a well-established technology and they prove to be very successful even over most unstable connections, making them our choice for server-client communications.
A PATIKA session is started when a user executes the client application. Once logged in, the user can connect to the server and query the database to construct the desired pathway. Pathways are created on the fly, and drawn automatically. A user can analyze and manipulate the data or may add new information. Finally, the resulting pathway may be stored locally or submitted to the database.
-Server Side-Detailed
Server Side-Detailed
Servlet Manager
Manages incoming requests
Servlet Manager Manages incoming requests
PATIKADatabase
Main Database that stores users, pathways and submissions.
PATIKADatabase Main Database that stores users, pathways and submissions.
Submission Manager Manages submission merges. Submission Manager Manages submission merges. Query Manager Performs queries Query Manager Performs queries Database Manager Performs database system specific tasks Database Manager Performs database system specific tasks User Manager Manages users and user profiles
User Manager Manages users and user profiles
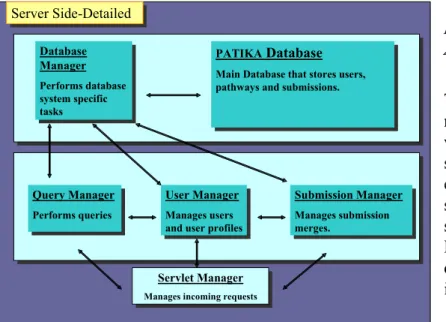
3.3 Server
The PATIKA server houses the PATIKA database and provides mechanisms for retrieving and submitting information.
Figure 6: PATIKA Server Architecture.
Three manager classes are responsible for most of the working logic of PATIKA server. Database Manager encapsulates database system specific tasks (e.g. indexing, session maintainance). Servlet Manager is responsible for creating new threads for incoming requests.
PATIKA server is designed so that it can run on multiple machines and is scalable. This is achieved by performing method calls between components by Java’s Remote Method Invocation. In the server side, the communication protocol between managers is RMI. In the system, all manager classes are designed to be executed at different machines. By separating manager classes and enabling them run at different machines independent of each other, we aimed to eliminate the load-balancing problems that may occur if all manager classes were executed at the same machine. Since all manager classes will be in the same local area, (Managers will run in one local area, Bilkent University, and clients can connect from anywhere on earth) we will not have any communication problem like the ones between PATIKA Editor and Server side.
A servlet is a Java class and therefore needs to be executed in a Java VM by a service called a servlet engine. The servlet engine loads the servlet class the first time the servlet is
loaded to handle multiple requests until it is explicitly unloaded or the servlet engine is shut down. The Servlet (Advanced Programming Interface) API was developed to leverage the advantages of the Java platform to solve the issues of CGI (Common Gateway Interface) and proprietary APIs. It's a simple API supported by virtually all Web servers and even load-balancing, fault-tolerant Application Servers. It solves the performance problem by executing all requests as threads in one process, or in a load-balanced system, in one process per server in the cluster. Servlet Manager class, which is a Servlet, is used to pass the requests from PATIKA Editor to the proper manager class and then to pass the replies of manager classes to PATIKA Editor.
Servlet Manager directs requests and submissions from user applications to three managers. User Manager controls user traffic and manages user specific tasks like logging in, alerting interested users for a certain update or keeping user customized options. Submission Manager accepts and checks incoming submissions, stores them to the temporary
submissions database (see database structure) and alerts related experts of the new submission. Query manager interprets user queries and performs them on the database. It finally sends them back to the user. All of these three managers access database via a fourth manager, Database Manager. Database Manager encapsulates database specific tasks and acts as an interface between the database and the other managers.
3.3.1.1 Databases
PATIKA uses an object-oriented database system, so it stores the data exactly as it is described in the model. It ultimately represents a complete picture of all the interactions in a particular organism's cell as a graph (interconnected network) of pathways. Specifically, it stores the following information:
• Each state and pathway in the database has a name. • Every state, transition and interaction has an author.
• Each state and transition keeps information regarding its type.
• Every state and transition in this graph knows the states or transitions it is related.
• Every state (transition) in this graph knows under which conditions it is present (active) or not. This is calculated by evaluating whether the neighbors of the state (transition) are active (present) or not.
• Each state is associated with a bioentity that keeps a set of links to the data that is accumulated about this molecule as publications, sequences, physical information, origin and associated phenotypes. Bioentities provide a gateway for other public sources of information related to this molecule. PATIKA links its model to other major databases such as GenBank or SWISS-PROT.
Although PATIKA currently aims for building a model for humans, it is possible to use PATIKA for other organisms as well. Each organism would obviously need to be stored in a separate database.
3.3.1.2 User Operations
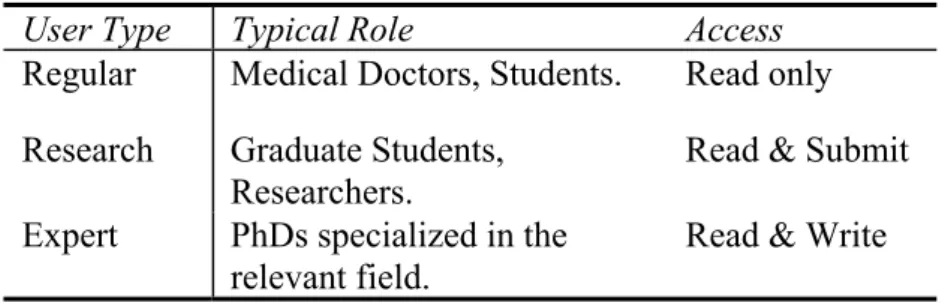
PATIKA is designed as a multi-user environment. Although access to the database is to be hopefully unlimited, the ability to change its contents requires some restrictions. PATIKA has three different types of users with different levels of access (Table 3):
Regular Users are the users that are using PATIKA for knowledge acquisition. They are not actively involved in research, and they do not plan to contribute to the database in the
near future. Any person can be a Regular User. Regular Users have read-only access to the database.
Research Users are scientists that produce relevant information. They are the key users of the database since they provide most of the data and updates. Although they cannot directly change the main database, they can submit their propositions, which are reviewed by and made public by experts. Any proposition that is found to be valid is integrated into the main database. Researchers are required to go through a registration process, where they are assigned an author ID. This ID is used for referencing entries made by the user. Each user has interest fields, which maps to a certain subset of the cellular events. These interest fields are used to notify users of the changes, which may be interest to them.
Expert Users are researchers who have expertise in a particular cellular
pathway/network. They have expertise fields defining the subset of graph in which they have extensive knowledge, as well as interest fields. They have all the privileges of a research user, plus the ability to modify the pathway information in the main database. In that sense, they act as arbiters, deciding whether a proposed model is rational or not. Experts are chosen by the PATIKA staff.
User Manager is responsible for checking and updating user authentication
information. It communicates with the client via the Servlet Manager and performs all of its database accession via methods provided by the database manager. Any database session has the user information, which is used to determine the access type of that session and user specific customizations. User Manager also provides means for changing user’s name, personal and contact information and password.
User Type Typical Role Access
Regular Medical Doctors, Students. Read only Research Graduate Students,
Researchers.
Read & Submit Expert PhDs specialized in the
relevant field.
Read & Write
Table 2:PATIKA user types
PATIKA user notification system notifies users of the changes in their expertise and interest fields as well as other general changes (e.g. new submission, new version or patch of software…) via a notification system. Notifier class, communicating with a SMTP server and sending mail to a list of users handles this operation.
3.3.1.3 Queries
Searching this graph is essential for making a meaning out of it. It not only provides a mean for accessing entries but also discovering relations that were not noticed before.
PATIKA provides users extensive facilities for querying the database. Users may • Search for states, transitions, bioentities by ID, keyword, date, type and
author.
• Lookup transitions that a certain state goes into/comes out of/affects. • Lookup states that a certain transition takes/produces/is affected. • Search for paths between two bionodes that
o Is the shortest path
o Is shorter than a certain size
o Involves a certain set of transitions o Involves a certain set of states User can also:
• Perform an operation on a query result (parenthesis)
• Perform basic Boolean operations on queries (AND, OR, NOT). • Restrict the search space (e.g. do not evaluate meta-interactions)
It is possible to extend this list. It is easy to see that most of those queries may lead to complex searches on the all-pathways database. This requires efficient search algorithms.
Note that this simple model may effectively predict most of the yes/no type questions we ask in biology. It may also be very useful correlating large amounts of data created by novel systems.
A QueryProcessor allows encapsulating query logic. For each new type of query, a new query processor class evaluating the query must be implemented by extending the QueryProcessor class. This kind of structure makes easy adding of new type of queries and forms the conventions that must be followed by programmers during the implementation of processor classes.
Probably, each algorithm will use a separate data structure and will keep different information about each element of the graph being traversed. This kind of algorithm specific information is kept in the Wrapper classes. Therefore, every new type of processor must also have its own Wrapper class.
temporary. To open the database for most of the queries in the update mode might create some efficiency problems, especially in a multi-user environment. Moreover adding new data structures to the graph elements would have been a difficult process, since it would require rebuilding the database each time such a change is made.
Query Manager class is responsible for processing incoming queries from the users. The ServletManager redirects query requests to the QueryManager by calling the
requestQuery method and passing a query string. The QueryManager parses the given query string and for every query, the QueryManager instantiates a QueryProcessor specific to the query type which runs in a separate thread.
Every query result is a pathway object, even if it only contains a single state. When the query is complete, QueryManager is notified by the processor and resulting pathway is then passed to the servlet manager, which is then sent back to the user.
3.3.1.4 Submissions
A user may submit any pathway he/she working on to the database, whether it is created from the scratch or modified form a query. Since PATIKA’s major goal is to integrate our knowledge on cellular events automatically, it allows any researcher to submit new data or corrections to the database. However since the data is highly interrelated, integrating these submissions and resolving conflicts requires a control mechanism.
PATIKA uses a three level check mechanism ensuring that the new submission can be integrated into the pathway.
First level checks are needs to assess that the incoming pathway is consistent in itself that is they comply with the invariance of the PATIKA model. Inconsistent submissions can be created by network errors of non-PATIKA editors.
Second level checks evaluates whether it is possible to merge the submissions without disturbing database integrity. Second level checks for database objects that are not present in the submission but is in the immediate neighborhood of the changed objects.
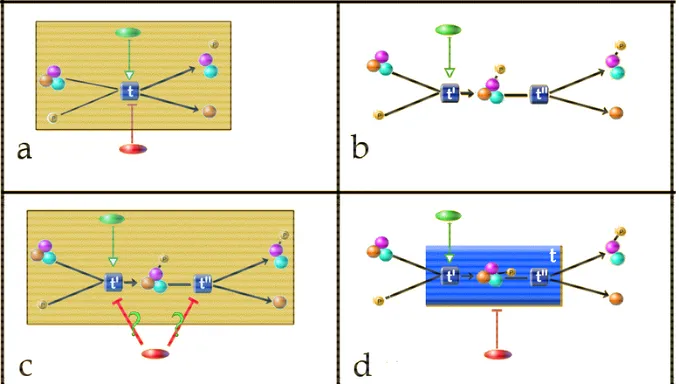
Important inconsistencies that may arise during merging submissions are orphans. Orphans arise when a submission removes an object from the database that is required for a consistency of another object missing in the submission.
Figure 7: Orphan Interactions:
(a) A very simple pathway resides in the database and user makes a query and retrieves the shaded region. Note that user is not aware of inhibitor (red) at all.
(b)User then changes the query result, replacing t with two new transitions (t’ and t”) and assigning interactions accordingly.
(c)When the modified pathway is submitted to the database, an orphan interaction is generated (Labeled with ‘?’). Assigning this edge is not a simple problem because even the user may not know the exact mechanism.
(d) A solution to the problem is to convert t to a summary transition (big blue rectangle) and define inhibitor edge as a meta-edge indicating that our knowledge is incomplete.
Some PATIKA elements that can become orphans are:
Interactions: An interaction becomes an orphan whenever one of its targets or
sources is removed permanently from the big picture.
States: Practically most biological molecules are constantly degraded and require
consistent synthesis, but it is not possible to form this fact into a rule. Many states (i.e. water) are virtually self-sustaining. Thus, states never become orphans because of a removal of a graph object. Nevertheless, states may become orphans when their related Bioentity is removed.
Transitions: Transitions become orphans whenever they lack at least one substrate
edge and at least one product edge. Effector edges are optional.
Summaries: Summary states and transitions can also become orphans as normal
states and transitions do. Moreover, summaries become orphans when one of their members is removed such that their internal consistency is lost.
More than often, orphan objects can be restored trivially by the author of the
submission, if he/she is aware of the fact. Thus, it is important to warn an author about such orphans and ask him/her to fix them if possible.
Orphans can be dealt in three ways:
Remove the orphan: This is the easy way; however, in most cases, removing
previously available information is not very logical, since we aim to build this database incrementally. Removing should be reserved to the cases of wrong and outdated entries.
Fix the orphan: Fixing refers to assigning a new graph object to the element orphan
is lacking. This is the way whenever author has complete information about the case and how to fix it. This is the preferred way but may not be possible in each case.
Summarizing: Summarizing refers to replacing removed element that leads to
orphans with a summary level object. Incomplete information in that case is represented by meta interactions. This is the case when an author has partial information about the
phenomena she is editing.
First two level checks are made automatically and a feedback is sent to the user for correcting inconsistencies. Once these inconsistencies are fixed, server stores the submission in a separate database and alerts the related experts. When at least one expert validates the pathway, submission is merged to the PATIKA database.
These operations are performed by the SubmissionManager object. Like other managers, it performs its database accesses via methods provided by DatabaseManager. It can only be used after the opened session is activated by the User Manager. Whenever SubmissionManager needs to update the database, it notifies other managers and when all existing transactions are closed, it performs its update. Since we expect the rate of updates to be low, it probably would not be a problem.
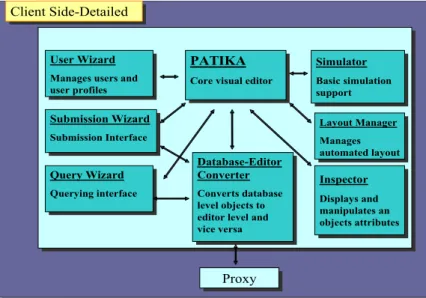
3.3.2 Client
PATIKA client consists of a graph editor for editing pathways and a proxy object for managing database connections.
Figure 8: PATIKA Client Architecture
Client Side-Detailed Client Side-Detailed
PATIKA
Core visual editor PATIKA Core visual editor
Inspector Displays and Inspector Displays and Database-Editor Converter Converts database Database-Editor Converter Converts database Layout Manager Manages automated layout Layout Manager Manages automated layout Simulator Basic simulation support Simulator Basic simulation support Query Wizard Querying interface Query Wizard Querying interface Submission Wizard Submission Interface Submission Wizard Submission Interface User Wizard
Manages users and user profiles
User Wizard Manages users and user profiles
The client side editor provides means for analyzing and manipulating pathways visually. It is particularly designed for minimizing modeling time for the users, and for allowing them to effectively construct and analyze pathways. It provides unlimited undo/redo capability, copy-paste support, zooming, scrolling, importing the graph into various image formats, saving a local copy of the graph with the visual information and layout and a visual interface for graph editing. PATIKA client also allows users to work on multiple documents at the same time, and perform cross-document operations like copy-paste.
Each editor level pathway has a cell model, dictating how the cellular compartments will be drawn on the screen. By this way, PATIKA editor can model multiple organisms even in the same editor session.
PATIKA client is composed of several components. Layout Wizard is responsible for automated layout related tasks. Simulator provides basic simulation support as well as ability to plug-in more sophisticates simulation tools. Submission Wizard facilitates submission related tasks using a wizard-type user interface. Query Wizard is the querying interface and it allows users to navigate over the database and analyze connections and possibilities. Node Creation Wizard provides a wizard for creating nodes. Inspector display the attributes of any selected inspect able object and allows users to change them. Database-Editor Converter changes database level objects to editor level objects and vice-versa. Finally, Proxy performs servlet related tasks and provides database connection to the rest of the editor.
Since the final graph is expected to be very large, it will probably be impossible for a user to analyze the whole graph at once. Thus, it is critical to allow user to analyze a given sub-graph separately. This requires creating pathways on the fly and drawing them
automatically on the screen. PATIKA uses automated layout for creating comprehensible pathway drawings on the fly. Drawing products and substrates at the opposite sides of a
transition appears to be resulting in clearer layouts. PATIKA uses a modified spring
embedder layout algorithm to separate substrates and products. Layout wizard allows user to modify the parameters and other options easily.
Query wizard provides a friendly yet powerful interface for performing pathway queries on the database. All of the queries mentioned can be performed over the query wizard. Results may be created as a new pathway or can be merged to the current pathway.
Submission wizard facilitates submission process. Once logged in submission wizard sends the submission to the database. Additional entries that need to be modified are
automatically merged to the current submission and error log is displayed for user to correct these errors.
Inspector provides an easy tool for modifying graph object properties. Every object implementing inspect able interface, provides the inspector with its inspect able context, that is the fields that are visible to the user and also editing methods for the fields that can also be modified by the user. Fields are displayed in a tabular format in a toolbar and user can easily modify the fields with a few operations.
Database-Editor converter is a bi-directional converter converting editor level objects to database level objects and vice-versa. Converting editor level objects to database level is rather simple since editor level objects has all the data that is present in a database level object. However reverse is not correct, one needs to create drawing information of editor objects that is missing in database level objects. PATIKA achieves this task by creating UI’s according to objects properties and some additional definitions like info box definitions. Then coordinates are assigned by using automated layout.
4 Implementation
PATIKA is implemented in JAVA using a full object oriented approach. Other than standard JAVA libraries, PATIKA uses TomSawyer Software’s Graph Editor
Toolkit(TSS(1997-2001) 2001) for JAVA for the basic graph modeling and editing and ObjectStore(Lamb, Landis et al. 1991) for database management.
Following is the general implementation method we used for PATIKA and the status as of the date this thesis is presented. For a detailed and up-to-date description of the
implementation, please refer to PATIKA API.
4.1 Model
PATIKA ontology is defined according the specifications described, at package org.patika.model as interfaces. Any implementation of the PATIKA model is done by implementing these interfaces. Additionally common fields of the model objects (i.e. name, ID etc.), and their accessor functions are grouped in classes donated with a suffix info to the name of the corresponding class (e.g. StateInfo for State) in order to reduce code duplication.
4.2 Server
Server and related classes are implemented at package org.patika.server. Currently server has the following functionality:
• Database level implementation of the model is completed.
• Database management system and facilities for storage and retrieval are implemented. It is possible to retrieve, modify and remove objects of the database, add a new pathway or clone a certain sub graph of a stored pathway.
All of these functions are encapsulated by DatabaseManager and all other server components access database through DatabaseManager.
• RMI is implemented. Managers communicate between them using RMI. Only exception is that currently database and managers need to run in the same machine. This is due to the current version of the database system we are using and this limitation will be removed as soon as we pass to the new database system.
• Servlet is implemented. For the purposes of the server, we have installed an APACHE web server and TomCat servlet engine and tested our servlet communications.
• General query mechanism and related objects are implemented. Two specific queries, which are k-neighborhood of a node and shortest path between two nodes, are implemented. Queries are performed in parallel as separate threads over the database. Management of these threads is done by the QueryManager. • Integrity and orphan checks for submissions are implemented. Submission
manager receives the submission, makes the necessary checks, creates a log and either sends it back to the user with the error log, or stores it to the temporary submissions database and notifies related experts for validation. If at least one expert validates the submission, submission is merged to the database.
• Database level merging is implemented. Merge first removes the removed objects, inserts new objects and assigns them a new PATIKA ID (PID), and
submission (i.e. one that did not pass the integrity checks) may damage the database integrity.
• A user system for tracking users and their interest fields are implemented. Furthermore, a user notification system, using electronic mail, is implemented. • Additional tools for directly analyzing the database and modifying (mostly
user information) data has been implemented. These will form an administration tool in the future.
4.3 Client
Client and related packages are implemented under org.patika.client. Editor is a fully functional graph-editing tool and supports standard features like zooming, cut/copy/paste, and undo-redo. Additionally client has the following functionality:
• Editor level implementation of the model is completed.
• Server communications are implemented. PATIKA editor can send queries, encrypted login information and session data, receive query-results, and login affirmation.
• Converter for converting database and editor levels are implemented. • Various facilities for modification and analysis are implemented including
node creation wizard and inspector.
• Local persistent storage based on object serialization is also implemented. It saves the graph complete with its geometric information allowing users to keep their mental picture.
• A basic layout is provided based on spring embedder layout. • Submission and query wizards are implemented fully.
5 Discussion
5.1 Analysis of the Ontology
While designing such an ontology, one need to make trade offs between detail, coverage and intuition. It is easy to crowd the model with sets of rules to cover all the exceptions but then there will be much trouble when you want to add new functionality, as one need to consider each rule and its compatibility. Moreover, analysis and modeling time increases significantly when you have many rules to handle exceptions. Instead, we tried to keep number of rules to a minimum, yet providing facilities for extending the ontology. In general, PATIKA ontology sacrifices modeling ease, avoiding short cut and implicit representations. This is essential since a major goal is to automate the data integration process.
5.1.1 Coverage
How much of the biological phenomena we can model with this ontology, is an important point. Since our approach uses a biochemical relation as its basis, biochemical reactions can be represented in a straightforward manner. Other events like transportations also have similar properties. Physical factors tend to break these rules since they have infinitely many different states and they rarely have compartments at all. However, these problem can be avoided by duplicating physical factors since they are ubiquitous elements by their nature.
There may be problems in representing some cellular locations like membrane docked proteins since current PATIKA default cell model does not define such a compartment.
However, cell models are designed so that they can be replaced and extended allowing addition of new locations as required.
5.1.2 Data Integration
An important consideration while designing such a model is ease of integration of new data. Since the model graph is considerably large, a user will probably work on a sub graph. Once the changes are made, we need to integrate it to the database such that integrity of the database remains intact.
Our model uses an atomic approach of defining integrity. Every object’s consistency is validated over its immediate neighborhood. For example, you only need to consider associated interactions (edges) of a state or a transition to decide whether it is valid or not. Therefore, while merging pathways you only need to check objects that are changed and their immediate neighborhood, facilitating integration of the new data.
5.1.3 Intuition and Modeling Ease
Intuition is the time and effort a user needs to spend in order to analyze and model cellular pathways using PATIKA model. The PATIKA model employs a mechanistic, explicit method for representing pathways making it more crowded compared to a conventional images with implicit shortcut representations. However, we believe that the tools we have provided can compensate this disadvantage and the explicit representation will become a clear advantage, as the model gets more and more complex.
Summaries are also very new to the biologists and the meanings of meta and
interpathway interactions may lead to some confusion. However, this representation allows modeling at multiple levels of detail and completeness, again a very important advantage in the long run.
5.1.4 Simulation and Predictions
Although one of the major aim of the PATIKA project is to build models capable of predictive computation, simulation and prediction systems are yet to be designed. However, PATIKA model is designed to support such features.
Explicit states and transitions are clearly useful for continuous transitions since they treat each event as a chemical reaction. Additionally PATIKA models can easily be
converted to Petri-nets, which are reported to be used for successful metabolic predictions. Other non-continuous approaches published in the literature like gene-nets or pi-calculus seems to fit perfectly to the PATIKA model.
5.2 Comparison of PATIKA
PATIKA is designed to respond scientific community’s newly emerging needs. Therefore, it is meaningful to analyze what PATIKA provides compared to the other software tools and databases (Table 3).