İSTANBUL BİLGİ UNIVERSITY INSTITUTE OF GRADUATE PROGRAMS
FINANCIAL ECONOMICS MASTER’S DEGREE PROGRAM
INVESTIGATION OF THE RELATIONSHIP BETWEEN PROFITABILITY AND FINANCIAL RATIOS ACCORDING TO SELECTED SECTORS: AN
APPLICATION IN BORSA ISTANBUL
Seçil Özden AYAR 116620004
Dr. Öğr. Üyesi Haluk YENER
İSTANBUL 2020
iii
TABLE OF CONTENTS
ABBREVIATIONS ...v
LIST OF FIGURES ... vi
LIST OF TABLES ... vii
ABSTRACT ... viii
ÖZET... ix
INTRODUCTION ...1
CHAPTER 1 PROFITABILITY AND FINANCIAL STATEMENT ANALYSIS 1.1. PROFITABILITY ... 3
1.2. FINANCIAL STATEMENT ANALYSIS ... 4
1.2.1. Horizontal Analysis ... 5
1.2.2. Vertical Analysis... 6
1.2.3. Trend Analysis ... 6
1.2.4. Ratio Analysis ... 6
1.2.4.1. Liquidity Ratio Analysis ... 8
1.2.4.2. Solvency Ratio Analysis ... 11
1.2.4.3. Activity Ratio Analysis ... 14
1.2.4.4. Profitability Ratio ... 18
CHAPTER 2 DATA AND METHODOLOGY 2.1. DATA ... 22
iv
2.1.1. Descriptive Statistics of Financial Ratio ... 25
2.2. METHODOLOGY ... 29 CHAPTER 3 RESULTS ...33 CONCLUSION...44 REFERENCES ...49 APPENDIX ...52
v
ABBREVIATIONS
PDP: Public Disclosure Platform BIST: Borsa İstanbul
Current: Current Ratio Acidtest: Acid-test Ratio Cash: Cash Ratio
Shtliab: Short Term Liabilities/Total Liabilities Lngliab: Long Term Liabilities/Total Liabilities Equrat: Equity Ratio
Leverage: Leverage Ratio Debtequrat: Debt Equity Ratio İnvturn: Inventory Turnover Ratio Recturn: Receivable Turnover Ratio
Workcapturn: Working Capital Turnover Ratios Fixasturn: Fixed Asset Turnover Ratio
Equturn: Equity Turnover Ratio Asturn: Asset Turnover Ratio
Opeprof: Operating Profitability Ratios Netprofmarg: Net Profit Margin ROE: Return on equity
ROA: Return on assets
vi
LIST OF FIGURES
Figure 1. Descriptive Statistics of Liquidity Ratio ... 25
Figure 2. Descriptive Statistics of Financial Risk Ratio ... 26
Figure 3. Descriptive Statistics of Operating Ratio... 27
vii
LIST OF TABLES
Table 1. Companies' Stock Exchange Transaction Codes ... 22
Table 2. Number of Companies' Profit and Loss Situations by Industry ... 23
Table 3. Financial Ratios in the Study... 24
Table 4. Shapiro-Wilk Normality Test ... 30
Table 5. Kruskal Wallis-H Test Results by Industries ... 33
Table 6. Backward Likelihood Ratio Change Table ... 35
Table 7. Hosmer and Lemeshow Test ... 36
Table 8. Beginning Block Iteration History ... 37
Table 9. Omnibus Tests Results of Model Coefficients ... 38
Table 10. Model Summary ... 38
Table 11. Beginning Classification Table ... 39
Table 12. Classification Table ... 40
viii
ABSTRACT
The main purpose of this study is to measure the effect of financial ratios on profit and loss status of firms operating in different sectors, to analyze which ratios affect the profit and loss status of firms and to examine whether there is any relationship between financial ratios and profitability of firms. We determined whether there is a significant difference in financial ratios between sectors and examined the effects of financial ratios on profit and loss status of firms by logistic regression analysis.
Results indicate that there is no difference in terms of current ratio, cash ratio, working capital turnover ratio, asset turnover ratio, return on equity, return on assets and economic profitability ratio and there is a significant difference between all other ratios. According to logistic regression results, return on equity, operating profitability ratio, asset turnover ratio and debt equity ratio are the most effective financial ratio on profit and loss situations. Also, while cash ratio, debt equity ratio, asset turnover ratio, operating profitability ratio, and ROE is found positive correlation on profitability, short-term liabilities/total liabilities ratio, long-term liabilities/total liabilities ratio, working capital turover ratio and fixed asset turnover ratio is found negative correlation on profitability. On the other hand, results indicate that liquidity ratios have less effect on the profit / loss situations of the firms compared to other ratios.
Keywords: financial ratios, logistic regression, profitability, sectors, financial
analysis
ix
ÖZET
Bu çalışmanın temel amacı; finansal oranların farklı sektörde faaliyet gösteren firmaların kar-zarar durumları üzerindeki etkisini ölçmek, en çok hangi rasyoların firmaların kar-zarar durumlarını etkilediği analiz etmek ve finansal oranlar ile firmaların karlılık durumu arasında herhangi bir ilişki olup olmadığı incelemektir. Finansal oranlarda sektörlere göre anlamlı bir farklılığın olup olmadığı tespit edilmiş ve sektörlere göre finansal oranların firmaların kar-zarar durumları üzerindeki etkileri lojistik regresyon analizi ile incelenmiştir.
Çalışmada sektörlere göre cari oranı, nakit oranı, işletme sermayesi devir hızı oranı, aktif devir hızı oranı, özvarlık kazanma gücü oranı, aktif kazanma gücü oranı ve ekonomik rantabilite oranı açısından bir farklılık bulunmazken, diğer tüm oranlar arasında anlamlı bir farklılık tespit edilmiştir. Lojistik regresyon sonuçlarına göre firmaların kar-zarar durumları üzerinde en etkili değişkenler özvarlık kazanma gücü oranı, ekonomik rantabilite oranı, aktif devir hızı oranı ve borç/özkaynak oranıdır. Ayrıca, nakit oranı, borç özkaynak oranı, varlık devir oranı, faaliyet kârlılığı oranı ve özvarlık kazanma gücü oranları ile kârlılık arasında pozitif ilişki, kısa vadeli borçlar / toplam borçlar oranı, uzun vadeli borçlar / toplam borçlar oranı, işletme sermayesi devir hızı oranı ve sabit aktif devir hızı oranları ile karlılık arasında negatif ilişki tespit edilmiştir. Diğer taraftan, sonuçlar incelendiğinde likidite oranlarının, firmaların kar / zarar durumları üzerinde diğer oranlara göre daha az etkili olduğu tespit edilmiştir.
Anahtar Sözcükler: finansal oranlar, lojistik regresyon, karlılık, sektörler,
1
INTRODUCTION
Profit is a very important concept for the firms and is seen as a tool to measure the success of companies. In order to maintain their assets and gain sufficient profit, companies aim to make profit at the end of each period and they want to control their activities. Therefore, they have to keep their financial activities under control in addition to their basic commercial activities. Financial analysis plays an important role in the management and evaluation of company activities. In addition, thanks to financial analysis, financial structure, profitability and productivity of firms can be informed about such issues.
The analysis of financial statements is widely used by various interest groups, including partners and managers in order to be able to make an accurate financial planning in an enterprise, financial statements analysis should be performed. Financial ratio analysis can be made by using the balance sheet and income statements and thus to have an idea about the financial situation of the companies. The goal of financial statement analysis is to explore the financial position of a company and thus to help investors, creditors, analysist and firm's manager in their decision making. Whether the firms have cash shortages, how much foreign resources they need to continue their activities, whether they use their own resources efficiently and whether they make profit or loss can be obtained through financial analysis.
Data are obtained from the Public Disclosure Platform (PDP) in the 2015 financial reports of companies operating in non-metallic mineral products industry, machinery and metal product industry, wholesale and consumer trade industry and technology industry traded on Borsa Istanbul (BIST). The net profit / loss item of these companies in the financial statements and income statements is accepted as positive companies are profitable and negative companies are loss firms. 24 companies from the non-metallic mineral industry, 22 companies from the machinery and metal products industry, 20 companies from the wholesale and
2
consumer trade industry and 15 companies from the technology industry are included in the analysis. There are 81 companies in the analysis, of which 63 are profit-making companies and 18 are loss-making companies.
19 financial ratios are calculated based on data obtained from 2015 annual financial reports of 81 companies in four sectors traded on Borsa Istanbul. In this study, current ratio, acid-test ratio, cash ratio, short term liabilities/total liabilities ratio, long term liabilities/total liabilities ratio, equity ratio, leverage ratio, debt equity ratio, inventory turnover ratio, receivable turnover ratio, working capital turnover ratio, fixed asset turnover ratio, equity turnover ratio, asset turnover ratio, operating profitability ratio, net profit margin ratio, return on equity ratio, return on assets and economic profitability ratio are defined as independent variable and profitability status as dependent variable.
In this study, firstly, we examine whether there is a difference between sectors in terms of financial ratios. Secondly, the logistic regression analysis is conducted to determine the financial ratios that affect firms’ profit and loss situation. Industry variable is added to the model as a categorical variable.
Initially, this model is unpredictable for a great number of independent variables. A small number of observations versus a large number of independent variables do not make it possible to calculate the parameter covariance matrix. Therefore, highly correlated variables is included in the analysis. According to the results, cash ratio, short term liabilities/total liabilities ratio, long term liabilities/total liabilities ratio, debt equity ratio, inventory turnover ratio, receivable turnover ratio, working capital turnover ratio, fixed asset turnover ratio, asset turnover ratio, operating profitability ratio, return on equity ratio, economic profitability ratio and industry variables are included in the model.
In this study is divided into four parts. In the first part, profitability concept and financial analysis method are explained, data and methodology used in this
3
study is explained in second part. In third part, empirical results are provided, the results is discussed in last part.
CHAPTER 1 PROFITABILITY AND
FINANCIAL STATEMENT ANALYSIS 1.1. PROFITABILITY
Profitability is required for every organization. The planning and control functions of finance aim to increase the profitability of the company. The cost of funds must be low to ensure profitability. Idle funds accrue, not any returns. Therefore, the organization should avoid idle funds. The finance function also requires matching costs and fund returns. Profitability increases if funds are used efficiently (Gopal, 2008).
Profitability depends on the correct use of funds. Budget control, ratio analysis and cost volume profit analysis can be increased by analyzing the company's profitability (Paramasivan and Subramanian, 2009).
Profitability is the “bottom line” and the primary reason for being in business. Having your own business might provide an opportunity to achieve greater returns than are possible with more traditional means, but it might be subject to much greater risk as well. For many people, the opportunity to run their own business and be their own boss might be even more motivating than the profit motive, but if the company isn’t profitable, it can’t survive. (Gill et all, 2009)
4
1.2. FINANCIAL STATEMENT ANALYSIS
The financial analysis establishes the relationship between the items in the financial statements in order to determine a firm's financial condition, results of operations and financial development and to make a future-looking forecast. In order to be able to make an accurate financial planning in a firm, financial statements analysis should be performed.
The analysis of financial statements is widely used by various interest groups, including partners and managers. Business owners want to see whether their capital is protected or not and profitability of their investments and managers want to see whether the operations of the firm are successful or not.
The financial statements is the most important element that investors, lenders and managers look at when they want to make the right decision since the financial statements show the results of the company's activities. Financial statement analysis provides information about the financial structure of the companies for the previous period. Furthermore, the company's future profit, future cash flow requirement and future borrowing need can be estimated through financial statements analysis. Briefly, financial analysis is a method of calculating the relationship between the items in the financial statements and the trends of the items in the years to see the financial position and financial development of a firm and to make predictions about the financial position of the firm.
The purpose of the financial statement analysis is to explore company operations and developments as a result of these operations, ie the financial situation of a company, and to help external users such as financial analysts, creditors and governments and internal users such as the company's management and employees in their decision making (Mugan and Akman, 2007).
5
Financial statements are used to look at the financial and investment activities of a firm in a given period. Financial statement analysis provides information to all stakeholders in understanding the firm's health and competitiveness. In terms of firm management, financial statements analysis is an important method to identify the strengths and weaknesses of the firm and to ensure that the firm is more advantageous than its competitors. When lenders decide whether or not to lend to the company, if they want to determine the strengths and weaknesses of the firm and foresee the future of the firm, it will be a useful tool to use the firm's financial statement analysis (Malhotra and Lafond, 2008).
The main objectives of financial analysis in terms of management and manager are:
measuring the degree of success in activities, examining the rate at which the goals are reached,
investigation of the causes if the targets are not achieved, comparison with competing businesses,
ensuring continuous monitoring of activities,
making correct and corrective financial decisions at every stage, financial planning. (Usta, 2008)
The main techniques used in financial analysis are; horizontal analysis,
vertical analysis, trend analysis, ratio analysis.
1.2.1. Horizontal Analysis
Horizontal analysis is performed by comparing the financial statements of the company for two or more periods. It is used to examine the changes in the items in the financial statements over time. The changes in the items can be calculated
6
either on the basis of the first year or the change of each year compared to the previous year.
1.2.2. Vertical Analysis
The vertical analysis is interpreted by proportioning the item in the financial statement to the sum of the total or group. Thus, the percentage of each item is determined and interpreted according to the percentage of items.
1.2.3. Trend Analysis
In the trend analysis, a year is taken as a base year and the increase or decrease of the items compared to the base year is determined and the changes are shown as a percentage. Thus, the trend of the items according to the base year is calculated and the changes experienced by the company can also be analyzed.
1.2.4. Ratio Analysis
Ratio analysis utilizes ratios and relationships between various financial statement accounts as basic tools to compare operational, financial and investing performance of companies over time and against one another (Feldman and Libman, 2007). Ratio analysis is a frequently used method of financial statement analysis. The ratio defines the relationship between the two items and is used as an index to use in the analysis.
Effective financial management is necessary for a company to be financially successful. Therefore, financial ratios are an important technique in performing financial analysis. Lenders and investors use ratio analysis when making decisions because ratio analysis is very important for us to interpret financial statements, to determine trends over time and to measure financial structures of enterprises (Goel, 2016).
7
Thanks to the ratio analysis, company managers can compare the firm’s financial position to other firms in the same sector, identifying the company’s relative strengths and weaknesses and making a better plan for the future. This benchmarking will help investors and lenders to better understand the position of the firm compared to other firms in the industry, rather than making intuitive decisions (Malhotra and Lafond, 2008).
The results of trend analysis, horizontal analysis and vertical analysis may be insufficient in some cases. For example, ratio analysis is needed when it is desired to look at whether assets are used efficiently. Ratio analysis is used when looking at the relationship between items such as the relationship between profitability and sales or profitability and asset. In interpreting the ratios, the financial position of the competitors and the sector averages are taken into consideration (Mugan and Akman, 2007).
Michael Samonas said that there are some limitations to the ratio analysis. Some of these limitations are the fact that rates include information about the past rather than the future, the difficulty of choosing an appropriate industry to be used in the comparison of firms, and the categorization of industries due to the fact that some firms are involved in several different business lines. (Samonas, 2015)
Ratios can be classified into various aspects according to the purpose of the analysis since the ratio analysis explain the relationships that other methods used in financial analysis do not reveal. It can be classified as ratios in terms of the relationship of financial statements with each other (ratios related to asset structure; ratios related to capital structure). In terms of functions; ratios can be classified as ratios related to liquidity analysis, ratios related to financial structure analysis; ratios related to activity analysis ratios and ratios related to profitability analysis ratios (Arat, 2015).
8
The calculation of various ratios is not only a goal but also sufficient for analysis. The fact that the data used in calculating ratio is not healthy, and that these data show great differences in various months and seasons of the year can be misleading and may lead to erroneous results. It is important to correctly interpret the ratios. The following points should be taken into consideration when making ratio analysis:
a small number of ratios that will determine the status of the firm should be taken to calculate,
should be taken when interpreting ratios,
other useful resources should be used when interpreting ratios, inflation should be considered while interpreting
should be compared with the ratios of the enterprise in previous years, should be compared companies in the same industry (Usta, 2008).
Classification from the point of view of financial management is as follows: Liquidity Ratio
Activity Ratio Solvency Ratio Profitability Ratio
1.2.4.1. Liquidity Ratio Analysis
Companies that want to achieve their long-term profitability targets have to fulfill their financial obligations on time and survive in the short term. Liquidity means that the company has sufficient funds to meet its short-term obligations or can raise funds in a timely manner. Ensuring sufficient liquidity is a serious concern for all companies (Mautz and Angell, 2006).
Liquidity analysis, which focuses on cash flow, measures how quickly assets are converted to cash, ie the ability of a company to meet its short-term
9
obligations. In daily transactions, liquidity management ensures the efficient use of assets (Robinson, 2009). Liquidity ratio can be calculated by current ratio, acid cash ratio and cash ratio.
While liquidity ratios show the solvency of firms, it is a ratio that shows the ability to turn into cash without losing its liquidity value. In general, the excessively high rates cause the problem of not reaching the profitability target as a result of keeping the liquid assets of the company idle. The low rate also indicates that the company may have difficulty in paying overdue debts. (Aksoy and Tanrıöven, 2007)
1.2.4.2.1. Current Ratio
Current ratio referred as a working capital ratio or banker’s ratio. Current ratio expresses the relationship of a current asset to current liabilities.
Current Ratio = Current Assets Current Liability
A good current rate for a company may vary depending on the nature of the entity, but if the rate is too low, the company may have difficulty in fulfilling its short-term obligations. If the current ratio is too high, the company may over-invest in the current assets and perhaps invest part of the fund in different areas. (Sherman, 2015)
The current ration is much lower than the standards can be interpreted as follows:
The company's fixed assets are partially covered by short-term liabilities. The company cannot pay its short-term debt on time.
The company does not have sufficient working capital and therefore cannot operate its fixed assets efficiently.
10
1.2.4.2.2. Acid Test Ratio
Current ratio takes into consideration current assets and current liabilities by evaluating the general liquidity position of an firm. From time to time, it is desirable to reach a more urgent location than indicated by the current rate. The acid test ratio relates the most liquid assets to current debts. When calculating the acid test ratio, the inventory is removed from current assets. Some of the reasons for the inventory may be that the inventory is slow-moving or outdated, and parts of the inventory are pledged to certain creditors.
Acid Test Ratio =Current Assets − Inventory Current Liability
The acid test ratio indicates the ability of an firm to pay its short-term debt without the liquidity of inventories with low liquidity compared to other short-term assets. It is generally preferred that this ratio is equal to one and this ratio also shows whether an firm may meet its obligations in the event of a decrease in sales (Aksoy and Tanrıöven, 2007).
1.2.4.2.3. Cash Ratio
Cash ratio is useful for a company who is undergoing is financial trouble.
Cash Ratio =Cash + Marketable Securities Current Liability
Cash ratio is considered to be the most sensitive indicator of solvency among liquidity ratios. The rate is generally expected to be 20% and if the rate falls below 20%, it may cause congestion in cash and difficulty in finding loans. However, the fact that the ratio is low should not be interpreted as negative
11
immediately, the structure and quality of the assets of the companies should be analyzed and it is a more accurate method to evaluate this ratio together with the operational ratios (Aksoy and Tanrıöven, 2007).
1.2.4.2. Solvency Ratio Analysis
These ratios show how the assets of a company are financed and provide information about the long-term liquidity of a company (Mugan and Akman, 2007). Financial leverage ratios measure the firm's long-term soundness and the firm's degree of financial risk. A high degree of solvency is interpreted as sufficient for a company to pay its debts (Goel, 2016). With the help of financial structure ratios, the relationship between the equity and liabilities of the companies is examined and the relationship between these resources and assets is also determined (Aksoy and Tanrıöven, 2007).
Financial Risk Ratios measure a company's ability to fulfill its long-term obligations and can also answer the question of whether firm has the right amount of debt. This ratio, which is used more by creditors, measures the ability of the company to pay the loans received. In order to make these measurements, debt and equity items are related. (Samonas, 2015)
1.2.4.2.1. Short Term Liabilities/Total Liabilities
This ratio shows that both how much of the total assets of the companies are funded by short-term debts and how much is used from short-term debts in total resources.
Short Term L./Total L. =Short Term Liabilities Total Liabilities
It can be expressed as a risky situation that this ratio exceeds 1/3 in an enterprise. However, in our country, the ratio exceeds this limit in many enterprises
12
because it is difficult to obtain long term debt. The issue that needs to be considered in the financing of the enterprise is the financing of current assets with short-term funds and the financing of fixed assets with long-term funds. Companies that do not comply with this principle may have difficulty in paying their debts and may even face the obligation of liquidation (Toroslu and Durmuş, 2016).
1.2.4.2.2. Long Term Liabilities/Total Liabilities
This ratio shows that both how much of the total assets of the companies are funded by long-term debts and how much is used from long-term debts in total resources.
Long Term L./Total L. =Long Term Liabilities Total Liabilities
Excessive long-term credit utilization of companies increases the annual interest burden, reduces the share of partners' profits, and the enterprise may have difficulty in paying debt installments during periods of recession. The well-known companies whose sales are stable and have been operating in the same line of business for a long time, and those using capital intensive technology or undertaking large-scale new investments can be considered high (Toroslu and Durmuş, 2016).
1.2.4.2.3. Equity Ratio
The debt ratio indicates the firm’s long-term debt-paying ability. It is computed as follows:
Equity Ratio =Shareholder’s Equity Total Asset
It is used as a ratio that helps to see how much of the firms's assets are financed by partners. A higher ratio indicates that the firm may not have difficulty
13
in paying its long-term debt. It is desirable that the ratio does not fall below 50%. However, it is seen that this ratio is kept low in companies that want to make more profit because some firms prefer to keep equity low and turn to foreign resources in order to increase their profitability.
1.2.4.2.4 Leverage Ratio (Debt Ratio)
The debt ratio indicates the extent to which companies’ assets are financed by long-term debt rather than equity, ie the leverage ratio of a company. If the debt ratio is high, it means that the company's debt is much higher than the equity and that the principal and interest payments of the company are a great burden on the company (Goel, 2016). As a general rule, the ratio between 1: 1 and 2: 1 is acceptable but depends on the sector in which a company operates.
Leverage Ratio =Total Liabilities Total Asset
It is an indication of the level of financial leverage used by the company because it represents the percentage of assets financed by creditors. This ratio is usually about %60 in Turkey. If the ratio is high, the possibility of the company having difficulty borrowing in the future may increase. In assessing debt ratios, fluctuations in a company's net income and cash flow from operations should also be examined and the effects of inflation should be taken into account when making the assessment (Mugan and Akman, 2007).
1.2.4.2.5. Debt Equity Ratio
The debt / equity ratio measures the degree to which a company's creditors provide security, showing the relationships between the funds provided by creditors and those provided by stochholders. Thi ratio is particularly useful in analyzing by
14
the lenders to whom the company requests a loan because it provides important information on how long the company can continue to borrow.
Debt Equity Ratio = Total Liabilities Shareholders′ 𝐸𝑞𝑢𝑖𝑡𝑦
The debt / equity ratio is used to determine the balance between the capital resources provided by the partners and the total liabilities. This high rate can be interpreted as the fact that the company is financed through creditors rather than equity and in such a case the risk of company creditors is high. (Samonas, 2015)
This ratio shows the percentage of long-term funds provided by creditors as of the funds provided by the stakeholders. It reflects strengths and weakness in basic financing operations. The desired level is usually one to one. However, in Turkey companies usually have the ratio of 60% to 40% (Mugan and Akman, 2007). It can be said that debt / equity ratios should be evaluated according to sector averages for each sector. However, the comparison of debt / equity ratios in firms in the same sector may not give very accurate results (Sherman, 2015).
1.2.4.3. Activity Ratio Analysis
Activity rates, also referred to as operational efficiency rates, allow you to measure how efficiently a company manages its various assets. Operational rates are considered as an indicator of operational performance as it shows whether both working capital and long-term assets are managed properly (Robinson, 2009).
Efficiency ratios explain the relationship between the level of activity of the company and the assets required to sustain the activity. The purpose of using these ratios is to analyze the indicators of how efficiently the company uses its assets. The ratio of the ratios to the desired intervals is interpreted as the asset utilization
15
of the company is efficient and the management of the company is strong. (Hitchner, 2017)
Only the interpretation of the current ratio and acid test ratio from the liquity ratios can give misleading results. These ratios do not show quality of debtors and are insufficient to show movement of debtors. In summary, since liquidity ratios are insufficient to show the quality of inventories, debts and receivables, it is necessary to calculate the turnover of these assets in order to determine their quality and how efficiently they are used in the company. Therefore, activity ratios are needed (Gopal, 2008).
1.2.4.3.1. Inventory Turnover Ratio
In the calculation of the ratio showing the number of times the inventories are converted, net sales are mostly used in the calculations due to the difficulty of determining the costs of the goods sold. The fact that inventory turnover is high or increasing over the years is considered to be very positive because it is concluded that inventory management is effective (Aksoy and Tanrıöven, 2007).
Inventory Turnover Ratio = Cost of Goods Sold 𝐴𝑣𝑒𝑟𝑎𝑔𝑒 𝐼𝑛𝑣𝑒𝑛𝑡𝑜𝑟𝑦
A high inventory turonver ratio indicates that inventory management is done efficiently. A low inventory turnover ratio also indicates that inventory management is not used effectively. The reasons for this may be an indication of a slow-moving inventory, perhaps due to a low rate of inventory exemption, due to technological obsolenscence or change in fasion (Robinson, 2009).
16
1.2.4.3.2. Receivable Turnover Ratio
Receivables turnover ratio shows how many times the receivables will be converted into cash during the period, but this ratio is high in companies where the company's credit or collection policies are very strict. Thus, they may suffer loss due to less sales than competitors with more flexible credit or collection policies, but it should be noted that flexible credit and collection procedures of companies with a low turnover rate may also cause problems. (Robinson., 2009)
Receivable Turnover Ratio = Net Credit Sales Average Accounts Receivable
1.2.4.3.3. Working Capital Turnover Ratio
This ratio, which shows the relationship between working capital and sales, is an important ratio showing whether or not the working capital is used effectively and is sufficient. However, in order to make the right analysis, the company must compare with the historical rates, competitors and sector averages.
Net Working Capital Turnover Ratio = Net Sales Net Working Capital
This ratio is used to measure the efficiency of working capital management and it is preferable that this ratio is high. High ratio shows that working capital is used efficiently, that is, indicates a lower investment in working capital has generated more volume of sales. High ratio increases the profitability of the company. (Gopal, 2008)
1.2.4.3.4. Fixed Asset Turover Ratio
The fixed asset turnover rate measures the effectiveness of management in generating sales from investments in fixed assets. this ratio differs between
capital-17
intensive enterprises and labor-intensive enterprises. It can be said to have a lower rate in capital intensive enterprises. However, to define a general range, this ratio range is 1 to 3 times. As the rate increases, the investment required to generate sales decreases and profitability can be increased. Moreover, when evaluating this ratio, firms in the same sector group should be compared. When comparing the two firms or industries, the asset numbers should be considered and the assets should be approximately the same (Gill et all, 2009).
Fixed Asset Turnover Ratio = Net Sales Average Fixed Assets
1.2.4.3.5. Equity Turnover Ratio
This ratio indicates whether or not equity is used efficiently. The large ration indicates that the company effectively uses its own equity or that its equity is low and that it makes wide use of foreign resources in financing. It would be correct to see which of these options applies to the business. The low turnover rate means that equity is not used effectively and profitability will be negatively affected. In this case, in order to increase the equity turnover rate, it may be used to decrease the equity or increase the sales.
Equity Turnover Ratio = Net Sales Average Debt
A high ratio indicates that the company's equity is used efficiently. There is no accepted standard measure for this ratio. In order to measure whether the equity ratio of the entity is sufficient or not, it should be compared with the ratios of other enterprises in the same sector (Toroslu and Durmuş, 2016).
18
1.2.4.3.6. Asset Turnover Ratio
Asset turnover ratio is a rate that measures the success of the assets and sales volume created by the companies. This ratio indicates whether the assets are over-invested. The low rate indicates that the firms does not use its assets efficiently and that the firms does not operate at full capacity (Toroslu and Durmuş, 2016).
It is preferred that the ratio be high since this ratio is used to measure the company's ability to effectively use its assets to generate revenue. The higher this rate, the better the company is generating more revenue on its assets (Goel, 2016).
Asset Turnover Ratio = Sales Total Assets
1.2.4.4. Profitability Ratio
All companies are working to maximize their profits. The profitability analysis helps to determine the firm's probability of generating profit, to assess the overall efficiency and performance of firms. If the company is able to obtain profits as a result of its core operating activities, it is sign of good operational health of the firm (Goel, 2016).
Company’s management, lenders and owners use profitability ratios to measure the company's productivity. So, profit for everyone associated with the company is important. For example, from a lender's point of view, if the profit is not sufficient, it will be difficult for them to receive interest payments and principal payments. From a manager's point of view, it should evaluate the company's productivity in terms of profits. Profitability ratios can be expressed in two ways based on sales and based on investments (Gopal, 2008).
19
1.2.4.4.1. Operating Profit Ratio
Operating profit margin measures the probability of a concern by taking into account the amount of the profit that a firm is able to generate after paying its other line of expenses, including office and selling expenses. It is a better indicator of the probability of the company as it is concerned with only the profits from core operations the company as it is concerned with only the profits from core operations of the company and excludes the noncore items (Goel, 2016).
Operating Profit Ratio =Operating Profit Sales
1.2.4.4.2. Net Profit Ratio
The net profit margin shows the final profit picture of the company. The higher the net profit margin, the more likely the company will turn its income into profit. However, assessing the low or high of this ratio may sometimes not give accurate results. Because, if a company recently borrowed long-term debt to increase production capacity or invest, the net profit margin will be significantly reduced. Therefore, the fact that this ratio is lower than that of its competitors does not mean that the company is less productive. A lower profit margin, a decrease in sales erases profits and results in net loss. The higher this margin, the more effective the company's income will be in real profit. Net profit margin is often used to compare a company's results over time (Goel, 2016).
Net Profit Ratio =Profit After Tax Sales
20
1.2.4.4.3. Return on Equity
This rate calculates the return accrued to the common shareholders after deducting interest payments and dividends and informs the owners about the return of the rest of firm’s investments (Mugan and Akman, 2007).
ROE = Net Income − Preferred Dividends Average Shareholders′ 𝐸𝑞𝑢𝑖𝑡𝑦
ROE can be used as an important profitability measure for shareholders because it calculates the net income amount expressed as a percentage of equity. In other words, it measures how much profit a company makes with the money invested. If the roe is high, it can be said that a company's efficiency in converting its shareholders' capital into profits is so good (Goel, 2016).
1.2.4.4.4. Return on Asset
Return on assets measures the firm’s ability to utilize its assets to create profits by comparing profits with the assets that generate the profits.
ROA = Operating Income Average Total Assets
This ratio measure the probability of the total resources available to the business. It indicates how efficiently management has used the total available resources to earn income (Mugan and Akman, 2007).
21
1.2.4.4.5. Economic Profitability Ratio:
Economic profitability ratio shows the profitability of the total resources of the enterprise. This rate is used to measure the return on funds invested in the entity. The economic profitability ratio should be lower than the return on equity ratio. Otherwise, it may be assumed that the cost of utilizing foreign resources is above normal (Toroslu and Durmuş, 2016).
Economic Probability Ratio =Profit After Tax Total Assets
22
CHAPTER 2
DATA AND METHODOLOGY
2.1. DATA
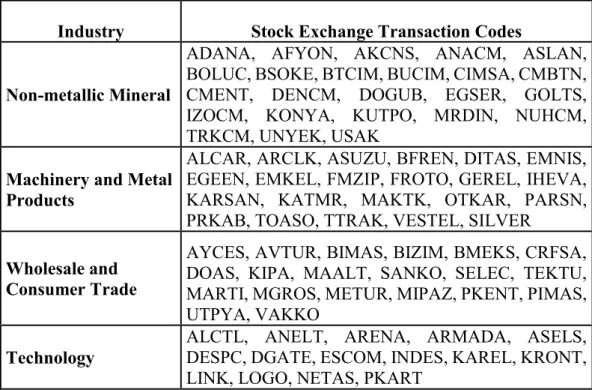
We collect data obtained from 2015 annual financial reports of 81 firms operating in four different sectors traded on Borsa Istanbul (BIST) from the Public Disclosure Platform (PDP). The financial analysis ratios calculated through the balance sheet and income statements of the firms are grouped according to the 4 main sectors mentioned in Table 1. These sectors include non-metallic mineral products industry, machinery and metal product industry, wholesale and consumer trade industry and technology industry. Stock exchange transaction codes of the companies used in the analysis by sectors are given in Table 1.
Table 1. Companies' Stock Exchange Transaction Codes
Industry Stock Exchange Transaction Codes
Non-metallic Mineral
ADANA, AFYON, AKCNS, ANACM, ASLAN, BOLUC, BSOKE, BTCIM, BUCIM, CIMSA, CMBTN, CMENT, DENCM, DOGUB, EGSER, GOLTS, IZOCM, KONYA, KUTPO, MRDIN, NUHCM, TRKCM, UNYEK, USAK
Machinery and Metal Products
ALCAR, ARCLK, ASUZU, BFREN, DITAS, EMNIS, EGEEN, EMKEL, FMZIP, FROTO, GEREL, IHEVA, KARSAN, KATMR, MAKTK, OTKAR, PARSN, PRKAB, TOASO, TTRAK, VESTEL, SILVER
Wholesale and Consumer Trade
AYCES, AVTUR, BIMAS, BIZIM, BMEKS, CRFSA, DOAS, KIPA, MAALT, SANKO, SELEC, TEKTU, MARTI, MGROS, METUR, MIPAZ, PKENT, PIMAS, UTPYA, VAKKO
Technology
ALCTL, ANELT, ARENA, ARMADA, ASELS, DESPC, DGATE, ESCOM, INDES, KAREL, KRONT, LINK, LOGO, NETAS, PKART
23
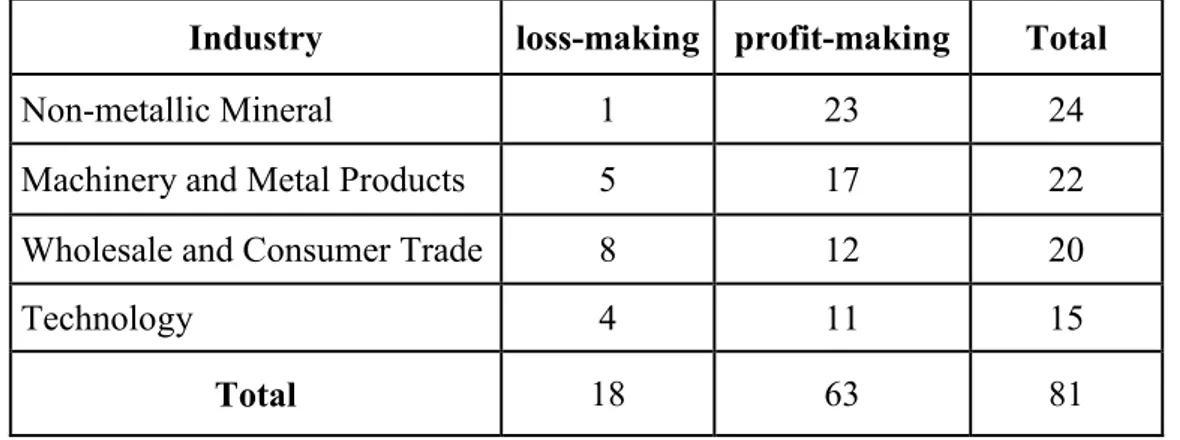
The net profit / loss item of these companies in the financial statements and income statements is accepted as positive companies are profitable and negative companies are loss firms. 24 companies (23 profit-making companies and 1 loss-making company) from the non-metallic mineral industry, 22 companies (17 profit-making companies and 5 loss-profit-making companies) from the machinery and metal products industry, 20 companies (12 profit-making and 8 loss-making companies) from the wholesale and consumer trade industry and 15 companies (4 loss-making and 11 profit-making companies) from the technology industry are included in the thesis.
There are 81 companies in the analysis, of which 63 are profit-making companies and 18 are loss-making companies. In this study, the number of profit and loss status of the firms grouped by sector are shown in Table 2.
Table 2. Number of Companies' Profit and Loss Situations by Industry
Industry loss-making profit-making Total
Non-metallic Mineral 1 23 24
Machinery and Metal Products 5 17 22
Wholesale and Consumer Trade 8 12 20
Technology 4 11 15
Total 18 63 81
Financial ratios used in the study are obtained by using the data in the annual financial statements and income statement of the companies. In this study, current ratio, acid-test ratio, cash ratio, short term liabilities/total liabilities ratio, long term liabilities/total liabilities ratio, equity ratio, leverage(debt) ratio, debt-equity ratio, inventory turnover ratio, receivable turnover ratio, working capital turnover ratio, fixed asset turnover ratio, equity turnover ratio, asset turnover ratio, operating
24
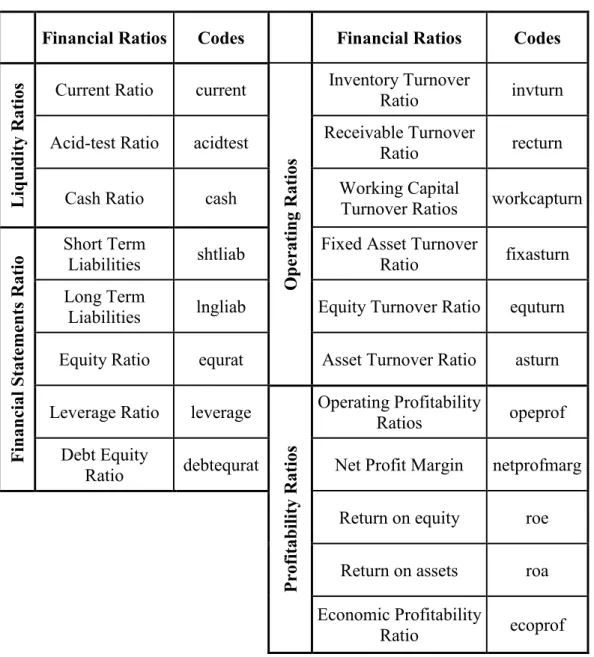
profitability ratio, net profit margin, return on equity, return on assets and economic profitability ratio are calculated. Financial ratios used in the study and codes of these ratios are shown in Table 3.
Table 3. Financial Ratios in the Study
Financial Ratios Codes Financial Ratios Codes
L iq u id ity R atios
Current Ratio current
Op er atin g Rat ios Inventory Turnover Ratio invturn
Acid-test Ratio acidtest Receivable Turnover
Ratio recturn
Cash Ratio cash Working Capital Turnover Ratios workcapturn
Fin an cial S tat em en ts R atio Short Term
Liabilities shtliab Fixed Asset Turnover Ratio fixasturn Long Term
Liabilities lngliab Equity Turnover Ratio equturn Equity Ratio equrat Asset Turnover Ratio asturn Leverage Ratio leverage
Pr ofit ab il ity R atios Operating Profitability Ratios opeprof Debt Equity
Ratio debtequrat Net Profit Margin netprofmarg
Return on equity roe
Return on assets roa
Economic Profitability
25
2.1.1. Descriptive Statistics of Financial Ratio
In order to better understand the general situation of the industries, the average value is given. In addition, Standard deviation values are also included to understand the internal variability of the sectors in terms of financial ratios. Information on the descriptive statistical results of financial ratios are given in for groups as liquidity ratios, financial structure ratios, operational ratios and profitability ratios.
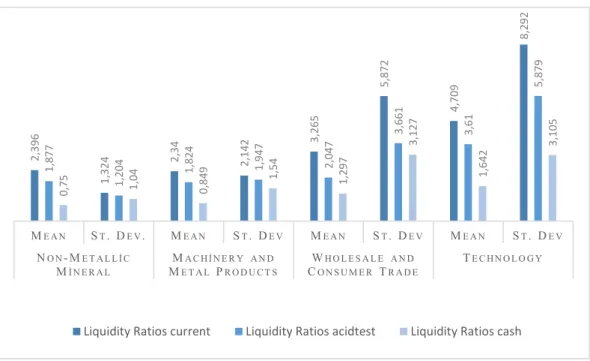
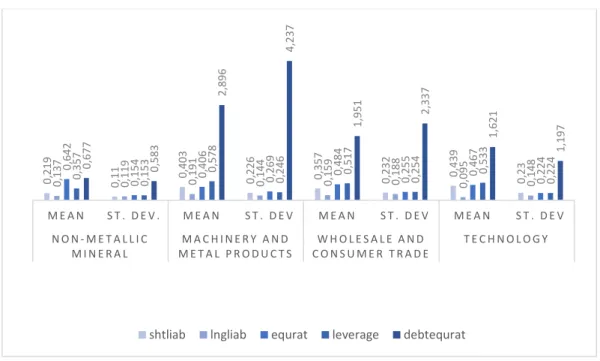
Figure 1. Descriptive Statistics of Liquidity Ratio
Although the non-metallic mineral industry and machinery and metal products industry have similar average of liquidity ratios, high standard deviation values of all liquidity ratios in the machinery and metal industry compared to the non-metallic mineral industry have been observed. We see that the standard deviation values of all liquidity ratios of wholesale and consumer trade industry are much higher than the standard deviation values of industry non-metallic mineral industry and machinery and metal products industry. Also, we see that the highest
2, 396 1, 324 2, 34 2, 142 3, 265 5, 872 4, 709 8, 292 1, 877 1, 204 1, 824 1,947 2,047 3, 661 3, 61 5, 879 0, 75 1,04 0, 849 1, 54 1, 297 3, 127 1, 642 3, 105 ME A N ST. DE V. ME A N ST. DE V ME A N ST. DE V ME A N ST. DE V NO N- ME T A L L İ C Mİ N E R A L MA C H İ N E R Y A N D ME T A L PR O D U C T S WH O L E S A L E A N D CO N S U M E R TR A D E TE C H N O L O G Y
26
standart deviation are observed in the technology industry. However, the high standard deviation values indicate that the internal variability is high. For this reason, there is more internal variability in wholesale and consumer trade industry and technology industry in terms of liquidity ratios than non-metallic mineral industry and machinery and metal products industry.
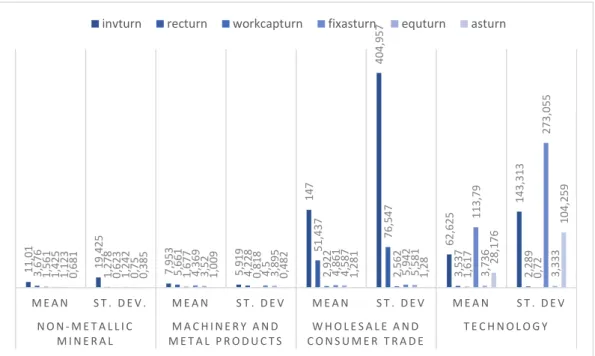
Figure 2. Descriptive Statistics of Financial Statement Ratio
According to descriptive statistics of financial statement ratio, both standard deviation and average of short-term liabilities/total liabilities ratio, long-term liabilities/total liabilities ratio, equity ratio and leverage(debt) ratio are almost the same in four sectors. The obtained values are analyzed in terms of financial statement ratios, we see that there is a similarity between the industries in general terms. Contrary to similarity means and standard deviations of all ratios except debt-equity ratio from financial statement ratios, there is a difference between the industries in means and standard deviations of the debt to equity ratio. The average and standard deviation of debt to equity ratio in the non-metallic mineral industry is quite low compared to all other sectors. Also, we see that machinery and metal products industry is differentiated from other industries in terms of debt to equity
0, 219 0, 11 0,403 0,226 0,357 0,232 0,439 0, 23 0, 137 0, 119 0, 191 0, 144 0, 159 0, 188 0, 095 0, 148 0, 642 0, 154 0,406 0,269 0,484 0,255 0,467 0, 224 0, 357 0, 153 0, 578 0, 246 0,517 0, 254 0,533 0, 224 0, 677 0, 583 2, 896 4, 237 1, 951 2, 337 1, 621 1, 197 M E A N S T . D E V . M E A N S T . D E V M E A N S T . D E V M E A N S T . D E V N O N - M E T A L L I C M I N E R A L M A C H I N E R Y A N D M E T A L P R O D U C T S W H O L E S A L E A N D C O N S U M E R T R A D E T E C H N O L O G Y
27
ratio. When the standard deviation rates are analyzed in terms of these ratios, we see that the industry with the least internal variability is the non-metallic mineral industry.
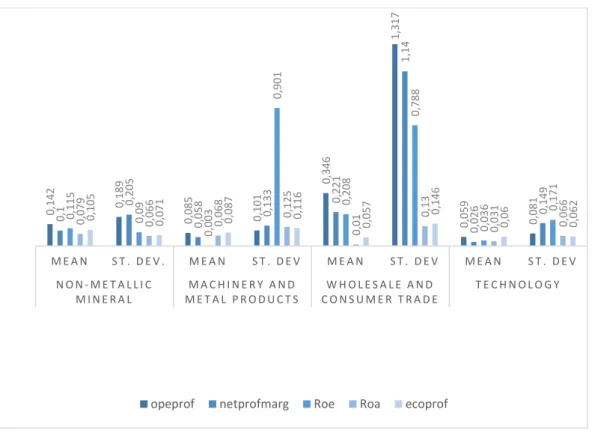
Figure 3. Descriptive Statistics of Activity Ratio
When the obtained data are evaluated in terms of activity ratios, we see that the average and standard deviations of the activity ratios of the industries are quite different from the other sectors. However, both standard deviation and average of inventory turnover ratio, receivable turnover ratio, working capital turnover ratio, fixed asset turnover ratio, equity turnover ratio and asset turnover ratio are almost the same in non-metallic mineral industry and machinery and metal products industry. Wholesale and consumer trade industry has the highest average and standart deviations in terms of inventory turnover ratio and receivable turnover ratio compared to other sectors. Finally, when the averages and standard deviations of the activity ratios of the technology sector are evaluated, we see that this sector has high average and standart deviations in terms of inventory turnover ratio, fixed asset turnover ratio and asset turnover ratio compared to other sectors.
11, 01 19, 425 7, 953 5, 919 147 404, 957 62, 625 143, 313 3, 676 1, 278 5, 661 4, 228 51, 437 76, 547 3, 537 2, 289 1, 561 0, 623 1, 677 0, 818 2, 922 2, 562 1, 617 0, 72 1, 425 1, 242 4, 369 4, 5 4, 861 5, 942 113, 79 273, 055 1, 123 0, 75 3, 52 3, 895 4, 587 5, 581 3, 736 3, 333 0, 681 0, 385 1, 009 0, 482 1, 281 1, 28 28, 176 104, 259 M E A N S T . D E V . M E A N S T . D E V M E A N S T . D E V M E A N S T . D E V N O N - M E T A L L I C M I N E R A L M A C H I N E R Y A N D M E T A L P R O D U C T S W H O L E S A L E A N D C O N S U M E R T R A D E T E C H N O L O G Y
28
Figure 4. Descriptive Statistics of Profitability Ratio
When the data obtained are evaluated in terms of probability ratios, the non-metallic mineral industry, technology industry and machinery and metal product industry have similar average and standart deviation of profitability ratios. Higher standard deviation and average values of probability ratios have been observed in the wholesale and consumer trade industry. We see that the standard deviation and average values of operating profitability ratio, net profit margin ratio and return on equity ratio of wholesale and consumer trade industry are much higher than the standard deviation values and average of these ratios in other industries. For this reason, there is more internal variability in wholesale and consumer trade industry in terms of probability ratios than other industries.
0, 142 0,189 0, 085 0, 101 0, 346 1, 317 0, 059 0,081 0, 1 0, 205 0, 058 0,133 0, 221 1, 14 0, 026 0, 149 0, 115 0, 09 0, 003 0, 901 0, 208 0, 788 0, 036 0, 171 0, 079 0, 066 0, 068 0,125 0, 01 0, 13 0, 031 0,066 0, 105 0, 071 0, 087 0,116 0, 057 0, 146 0, 06 0, 062 M E A N S T . D E V . M E A N S T . D E V M E A N S T . D E V M E A N S T . D E V N O N - M E T A L L I C M I N E R A L M A C H I N E R Y A N D M E T A L P R O D U C T S W H O L E S A L E A N D C O N S U M E R T R A D E T E C H N O L O G Y
29
2.2. METHODOLOGY
In this thesis, first of all, we aim to examine whether there is a difference between sectors in terms of financial ratio values. Whether the data have normal distribution is examined before testing the difference between sectors because whether or not the data set has a normal distribution is very important in using the correct statistical methods in the analysis.
Normality test, Kolmogorov-Smirnov (K-S) and Shapiro-Wilk tests are performed. Kolmogorov-Smirnov (K-S) test is used when the number of observations is more than 35, and Shapiro-Wilk test is used when the number of observations is less than 35 (McKillup, 2012).
In this study, Shapiro-Wilk test is peformed using SPSS program because number of observations for each industry is less than 35. In this test, 95% confidence level, p value less than 0.05 indicates that the variable does not have normal distribution.
Current ratio, acid-test ratio, cash ratio, short term liabilities/total liabilities ratio, long term liabilities/total liabilities ratio, equity ratio, leverage(debt) ratio, debt equity ratio, inventory turnover ratio, receivable turnover ratio, working capital turnover ratio, fixed asset turnover ratio, equity turnover ratio, asset turnover ratio, operating profitability ratio, net profit margin ratio, return on equity ratio, return on assets and economic profitability ratio are tested with Shapiro-Wilk test.
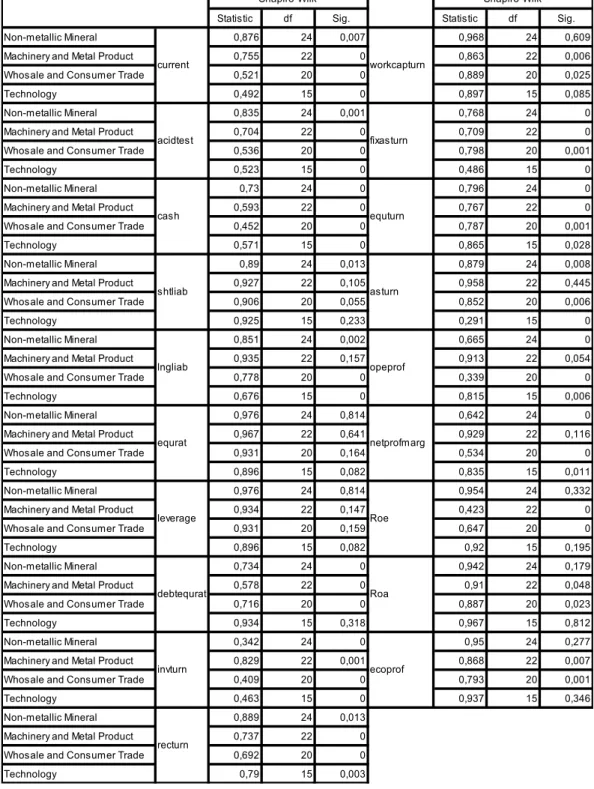
Table 4 shows the Shapiro-Wilk normality test results for each financial ratio by sector. Current ratio, acid-test ratio, cash ratio, inventory turnover ratio, receivable turnover ratio, fixed asset turnover ratio, equity turnover ratio and operating profitability ratio are not normally distributed in the all sectors. Equity ratio, leverage(debt) ratio and return on assets is normally distributed in the all
30
sector. According to the Shapiro-Wilk test results, this study uses to use non-parametric tests because most of the variables do not have normal distribution.
Table 4. Shapiro-Wilk Normality Test
Statistic df Sig. Statistic df Sig.
Non-metallic Mineral 0,876 24 0,007 0,968 24 0,609
Machinery and Metal Product 0,755 22 0 0,863 22 0,006
Whosale and Consumer Trade 0,521 20 0 0,889 20 0,025
Technology 0,492 15 0 0,897 15 0,085
Non-metallic Mineral 0,835 24 0,001 0,768 24 0
Machinery and Metal Product 0,704 22 0 0,709 22 0
Whosale and Consumer Trade 0,536 20 0 0,798 20 0,001
Technology 0,523 15 0 0,486 15 0
Non-metallic Mineral 0,73 24 0 0,796 24 0
Machinery and Metal Product 0,593 22 0 0,767 22 0
Whosale and Consumer Trade 0,452 20 0 0,787 20 0,001
Technology 0,571 15 0 0,865 15 0,028
Non-metallic Mineral 0,89 24 0,013 0,879 24 0,008
Machinery and Metal Product 0,927 22 0,105 0,958 22 0,445
Whosale and Consumer Trade 0,906 20 0,055 0,852 20 0,006
Technology 0,925 15 0,233 0,291 15 0
Non-metallic Mineral 0,851 24 0,002 0,665 24 0
Machinery and Metal Product 0,935 22 0,157 0,913 22 0,054
Whosale and Consumer Trade 0,778 20 0 0,339 20 0
Technology 0,676 15 0 0,815 15 0,006
Non-metallic Mineral 0,976 24 0,814 0,642 24 0
Machinery and Metal Product 0,967 22 0,641 0,929 22 0,116
Whosale and Consumer Trade 0,931 20 0,164 0,534 20 0
Technology 0,896 15 0,082 0,835 15 0,011
Non-metallic Mineral 0,976 24 0,814 0,954 24 0,332
Machinery and Metal Product 0,934 22 0,147 0,423 22 0
Whosale and Consumer Trade 0,931 20 0,159 0,647 20 0
Technology 0,896 15 0,082 0,92 15 0,195
Non-metallic Mineral 0,734 24 0 0,942 24 0,179
Machinery and Metal Product 0,578 22 0 0,91 22 0,048
Whosale and Consumer Trade 0,716 20 0 0,887 20 0,023
Technology 0,934 15 0,318 0,967 15 0,812
Non-metallic Mineral 0,342 24 0 0,95 24 0,277
Machinery and Metal Product 0,829 22 0,001 0,868 22 0,007
Whosale and Consumer Trade 0,409 20 0 0,793 20 0,001
Technology 0,463 15 0 0,937 15 0,346
Non-metallic Mineral 0,889 24 0,013
Machinery and Metal Product 0,737 22 0
Whosale and Consumer Trade 0,692 20 0
Technology 0,79 15 0,003 debtequrat Roa invturn ecoprof recturn lngliab opeprof equrat netprofmarg leverage Roe acidtest fixasturn cash equturn shtliab asturn Shapiro-Wilk Shapiro-Wilk current workcapturn
31
Then, the logistic regression analysis is conducted to determine the financial ratios that affect firms’ profit and loss situation. The research questions identified in the analysis are as follows.
i. What are the financial ratios that affect the profit and loss status of companies by industry?
ii. Which ratio is the most effective on the profit and loss situation of companies?
iii. How much change do industries have in terms of profitability compared to a unit change of a financial ratio?
In statistics, logistic regression or logit regression is a type of probabilistic statistical classification model (Bishop, 2006).
Logistic regression models in which the dependent variable consists of two categories are called binary logistic regression models, and logistic regression models in which the dependent variable consists of more than two categories are called multinomial logistic regression models. The dependent variable is encoded as receiving 0 and 1 (life-death, failure-success, etc.). In the binary logistic regression model, the dependent variable is expressed as P / (1 − P). Since this value represents the probability value, it takes a value between 0 and 1 (Böhning, 1992).
In multivariate statistical analyzes using independent and dependent variables, when the dependent variable is a nominal variable, least squares (LS) estimates are not sufficient. In other words, the variance obtained from the estimation result is not the smallest variance value. Because the LS method "dependent variable is suitable for normal distribution" is made under the assumption. This assumption cannot be achieved if the dependent variable is nominal. In case the dependent variable is a nominal value, logistic regression
32
analysis is used as an alternative to LS method (Kleinbaum, Dietz, Gail and Klein, 2002).
In the application of logistic regression analysis, assumptions such as normal distribution of data or continuity are not required. In addition, logistic regression analysis does not require that the variance-covariance matrices be equal and it is assumed that there is no problem of multicollinearity between independent variables. Logistic regression analysis is more flexible than other methods. Therefore, it is more preferred than other methods (Menard, 2002).
Logistic regression model can generally be written as follows.
𝑌 = 𝑙𝑛 [ 𝑃𝑖
1 − 𝑃𝑖] = 𝛽0+ 𝛽1𝑥1+ ⋯ + 𝛽𝑛𝑥𝑛 + 𝑒
Here, Y is dependent variable (categorical), x’s are independent variables and β’s represent the regression coefficients. In this study, the industry variable was added to the model as an independent variable.
The model to be used in the study is generally expressed as follows. 𝑆𝑡𝑎𝑡𝑢𝑠 (1,0) = 𝛼 + 𝜃(𝑖𝑛𝑑𝑢𝑠𝑡𝑟𝑦) + 𝛽1(𝑐𝑢𝑟𝑟𝑒𝑛𝑡) + 𝛽2(𝑎𝑐𝑖𝑑𝑡𝑒𝑠𝑡) + 𝛽3(𝑐𝑎𝑠ℎ) + 𝛽4(𝑠ℎ𝑡𝑙𝑖𝑎𝑏) + 𝛽5(𝑙𝑛𝑔𝑙𝑖𝑎𝑏) + 𝛽6(𝑒𝑞𝑢𝑟𝑎𝑡) + 𝛽7(𝑒𝑣𝑒𝑟𝑎𝑔𝑒) + 𝛽8(𝑑𝑒𝑏𝑡𝑒𝑞𝑢𝑟𝑎𝑡) + 𝛽9(𝑖𝑛𝑣𝑡𝑢𝑟𝑛) + 𝛽10(𝑟𝑒𝑐𝑡𝑢𝑟𝑛) + 𝛽11(𝑤𝑜𝑟𝑘𝑐𝑎𝑝𝑡𝑢𝑟𝑛) + 𝛽12(𝑓𝑖𝑥𝑎𝑠𝑡𝑢𝑟𝑛) + 𝛽13(𝑒𝑞𝑢𝑡𝑢𝑟𝑛) + 𝛽14(𝑎𝑠𝑡𝑢𝑟𝑛) + 𝛽15(𝑜𝑝𝑒𝑝𝑟𝑜𝑓) + 𝛽16(𝑛𝑒𝑡𝑝𝑟𝑜𝑓𝑚𝑎𝑟𝑔) + 𝛽17(𝑟𝑜𝑒) + 𝛽18(𝑟𝑜𝑎) + 𝛽19(𝑒𝑐𝑜𝑝𝑟𝑜𝑓) + 𝑒
Here, status is dependent variable;
status= {1; 𝑃𝑟𝑜𝑓𝑖𝑡 0; L𝑜𝑠𝑠
33
Financial ratios and industry is categorical independent variable. 𝜃 and β’s represent the regression coefficients.
CHAPTER 3 RESULTS
In the literature, the main tests that assess the assumption of normality are the chi-square goodness of fit test, Kolmogorov-Smirnov (K-S) test, Lilliefors corrected Kolmogorov-Smirnov test, Anderson-Darling test, Cramer-von Mises test, Shapiro-Wilk test, D’Agostino skewness test, Anscombe-Glynn kurtosis test, D’Agostino Pearson omnibus test and Jarqua-Bera test (Öztuna, Elhan and Tüccar, 2006).
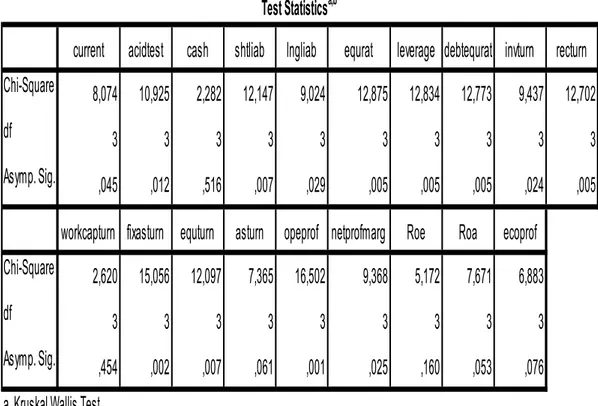
Table 5. Kruskal Wallis-H Test Results by Industries
current
acidtest cash
shtliab lngliab
equrat
leverage debtequrat invturn recturn
Chi-Square
8,074 10,925
2,282 12,147
9,024
12,875 12,834 12,773
9,437 12,702
df
3
3
3
3
3
3
3
3
3
3
Asymp. Sig.
,045
,012
,516
,007
,029
,005
,005
,005
,024
,005
workcapturn fixasturn equturn asturn opeprof netprofmarg Roe
Roa
ecoprof
Chi-Square
2,620 15,056 12,097
7,365 16,502
9,368
5,172
7,671
6,883
df
3
3
3
3
3
3
3
3
3
Asymp. Sig.
,454
,002
,007
,061
,001
,025
,160
,053
,076
a. Kruskal Wallis Test
b. Grouping Variable: industry
34
In the previous part of the study, we concluded that most of the variables are not suitable for normal distribution. Firstly, in order to investigate whether there are statistically significant differences between two or more groups, Kruskal-Wallis H test which is a rank-based non-parametric hypothesis test is used. Kruskal-Wallis test results are shown in Table 5.
It can be said that there is a significant difference when the p values obtained from Kruskal-Wallis H test results are less than 0.05 at 95% confidence level. According to Kruskal-Wallis H results, there is a significant difference between the industries in terms of acid-test ratio from liquidity ratios only. In addition, there is a significant difference between the sectors in terms of all solvency ratios. When the operating ratios are analyzed, we see that the ratios other than working capital turnover ratios and asset turnover ratio have a significant difference between the industries. When the profitability ratio is examined, while the operating profitability ratios and net profit margin ratios have a significant difference between the industries, no significant difference has been detected in terms of return on equity, return on assets and economic profitability ratio.
In the second part of the study, logistic regression is applied. Industry variable is added to the model as a categorical variable. Initially, this model is unpredictable for a great number of independent variables. A small number of observations versus a large number of independent variables do not make it possible to calculate the parameter covariance matrix. Therefore, only one of the highly correlated variables is included in the analysis.
Detailed Spearman's correlation table is given in Appendix 1. According to the results, cash ratio, short term liabilities/total liabilities ratio, long term liabilities/total liabilities ratio, debt-equity ratio, inventory turnover ratio, receivable turnover ratio, working capital turnover ratio, fixed asset turnover ratio, asset turnover ratio, operating profitability ratio, return on equity and economic profitability ratio are included in the model. So, the predicted model is as follows.
35
Status (1,0) = 𝛼 + 𝜃(𝑖𝑛𝑑𝑢𝑠𝑡𝑟𝑦) + 𝛽1(𝑐𝑎𝑠ℎ) + 𝛽𝟐(shtliab) + 𝛽𝟑(lngliab) + 𝛽𝟒(debtequrat) + 𝛽𝟓(invturn) + 𝛽6(recturn)
+ 𝛽𝟕(𝑤𝑜𝑟𝑘𝑐𝑎𝑝𝑡𝑢𝑟𝑛) + 𝛽𝟖(fixasturn + 𝛽9(asturn) + 𝛽10(opeprof) + 𝛽𝟏𝟏(roe) + 𝛽𝟏𝟐(ecoprof) + 𝑒
The most important independent variables are determined by using the backward likelihood ratio selection criterion (Backward LR) using SPSS program. Backward likelihood ratio change values are shown in Table 7.
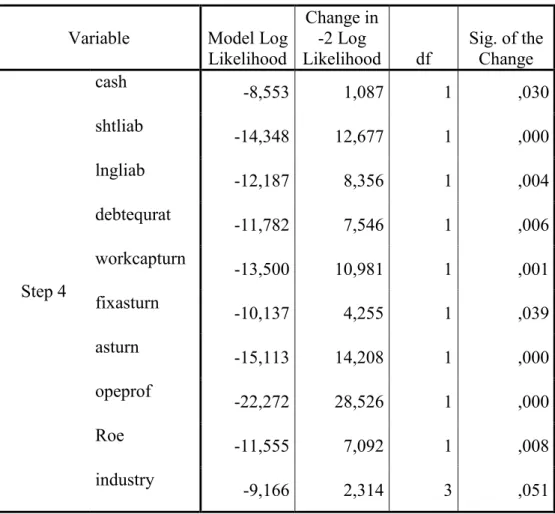
Table 6. Backward Likelihood Ratio Change Table Model if Term Removed
Variable Model Log
Likelihood
Change in -2 Log
Likelihood df Sig. of the Change
Step 4 cash -8,553 1,087 1 ,030 shtliab -14,348 12,677 1 ,000 lngliab -12,187 8,356 1 ,004 debtequrat -11,782 7,546 1 ,006 workcapturn -13,500 10,981 1 ,001 fixasturn -10,137 4,255 1 ,039 asturn -15,113 14,208 1 ,000 opeprof -22,272 28,526 1 ,000 Roe -11,555 7,092 1 ,008 industry -9,166 2,314 3 ,051
When the Table 6 is examined, we see that the most appropriate model is obtained in step 4. Finally, significant variables used in the model are determined
36
as cash ratio, short term liabilities/total liabilities ratio, long term liabilities/total liabilities ratio, debt-equity ratio, working capital turnover ratio, fixed asset turnover ratio, asset turnover ratio, operating profitability ratio and return on equity ratio. In addition, the industry type, which is a categorical variable, is included as a significant variable in the model.
Table 7. Hosmer and Lemeshow Test
Step Chi-square df Sig.
1 ,489 7 ,849
2 ,553 7 ,790
3 ,632 7 ,930
4 ,671 7 ,800
Table 7 shows Hosmer-Lemeshow test results, which is an indicator of goodness of fit of the model. The hypothesis tests valid for this test are as follows.
H0: The theoretical model represents the data well.
H1: The theoretical model does not represent the data well.
When the Table 7 is examined, we see that the Hosmer-Lemeshow test results in step 4 is not significant at 95% confidence level. (0.800> 0.05). Therefore, H0 cannot be rejected. Model estimates are not different from the observed
situation. The fact that H0 cannot be rejected is an indication that the model fit is at
a good level. In other words, it is concluded that there is no significant difference between the values estimated by the model and the observed values, and it can be said that the theoretical model represents the data at a good level.
37
The beginning block iteration values are shown in the Table 8. In the initial model, the value of -2 Log Likelihood with only the fixed term is 85,812. Estimation terminated at iteration number 4 because parameter estimates changed by less than 0.001.
Table 8. Beginning Block Iteration History Iteration Historya,b,c
Iteration -2 Log likelihood Coefficients Constant Step 0 1 86,101 1,111 2 85,813 1,248 3 85,812 1,253 4 85,812 1,253
a. Constant is included in the model. b. Initial -2 Log Likelihood: 85,812
c. Estimation terminated at iteration number 4 because parameter estimates changed by less than ,001.
Omnibus test results of the coefficients obtained from the final model are given in the Table 9. According to results; at the end of the fourth step, we find that the coefficients obtained in the whole block and the whole model are significant because significant value is less than 0.05 at 95% confidence level.
The G-statistics (Chi-Square) obtained by the inclusion of independent variables in the initial model are found to be statistically significant. Thus, logistic regression coefficients are found to be significant. This situation is accepted as an indicator of the goodness of the model.
38
Table 9. Omnibus Tests Results of Model Coefficients
Chi-square df Sig.
Step 4 Step -,314 1 ,575
Block 69,794 12 ,000
Model 69,794 10 ,000
When the independent variables are added, we see that the -2 Log Likelihood value is 69,794 in Table 9. When the table is examined, we see that -2 Log Likelihood value obtained in the initial model is 85,812 and -2 Log Likelihood value decreases and the goodness of fit of the final model increases.
Nagelkerke R2 value is a different form of Cox & Snell R2. Nagelkerke R2
value is always higher than Cox-Snell R2 value (Allison, 2014). Cox-Snell R2 and
Nagelkerke R2 values are shown in the Table 10. These values represent the
explanatory power of the model. When the Cox-Snell R2 value is examined, we see
that the rate of explaining the profit-loss situation of the independent variables is 57.8%, and the rate of explaining the dependent variable of the independent variables is 88.4% when Nagelkerke R2 value is examined.
Table 10. Model Summary
Model Summary
Step -2 Log
likelihood Cox & Snell R Square Nagelkerke R Square
1 15,381a ,581 ,889
2 15,606a ,580 ,887
3 15,704a ,579 ,886