Reliability-Related Issues in the Context of Student Evaluations of
Teaching in Higher Education
İlker Kalender1
1 Graduate School of Education, İhsan Doğramacı Bilkent University, Ankara, Turkey
Correspondence: İlker Kalender, Graduate School of Education, İhsan Doğramacı Bilkent University, Ankara, Turkey. Tel: 90-312-290-1095. E-mail: [email protected]
Received: May 8, 2015 Accepted: June 1, 2015 Online Published: June 9, 2015 doi:10.5430/ijhe.v4n3p44 URL: http://dx.doi.org/10.5430/ijhe.v4n3p44
Abstract
Student evaluations of teaching (SET) have been the principal instrument to elicit students’ opinions in higher education institutions. Many decisions, including high-stake ones, are made based on SET scores reported by students. In this respect, reliability of SET scores is of considerable importance. This paper has an argument that there are some problems in choosing and using of reliability indices in SET context. Three hypotheses were tested: (i) using internal consistency measures is misleading in SET context since the variability is mainly due to disagreement between students’ ratings, which requires use of inter-rater reliability coefficients, (ii) number of minimum feedbacks is not achieved in most of the classes, resulting unreliable decisions, and (iii) calculating reliability coefficient assuming a common factor structure across all classes is misleading because a common model may not be tenable for all. Results showed that use of internal consistency only to assess reliability of SET scores may result in wrong decisions. Considerable large numbers of missing feedbacks were observed to achieve acceptable reliability levels. Findings also indicated that factorial model differed across several groups.
Keywords: Student evaluations of teaching, Reliability, Cronbach’s Alpha, Internal consistency, Inter-rater reliability 1. Introduction
Student evaluations of teaching (SET) have been the standardized way to gather feedback about instructors in higher education institutions (Spooren, Brockx, & Mortelmans, 2013). Ratings reported by students are used for many purposes such as to provide diagnostic feedback, to make administrative decisions, to help student select instructors/courses, and, to base research (Nasser & Fresko, 2006). All these purposes (not exhaustively) can be grouped under either formative or summative assessment. Formative use of SET scores includes feedback about instructional effectiveness to instructors. Ratings can be used by instructors to assess themselves and make required changes in instruction to improve instructional effectiveness (Beran, Violato, Kline, & Frideres, 2009). Summative use of ratings generally is related to high-stake decisions including awarding faculty with salary increase, or promoting them, etc. (Ehie & Karathanos, 1994; Emery, Kramer, & Tian, 2003; Kulik, 2001).
Reliable SET scores are of highly importance since the decisions made based on them can be highly influential on faculty’s career (Solomon et al., 2007). Although validity of SET instruments has been a controversial issue due to several confounding factors related to instructor, course, and student (Addison, Bet, &Warrington, 2006; Baldwin & Blattner, 2003; Otto et al., 2008), SET scores are mostly considered to be reliable (Alaemoni 1999; Hobson & Talbot, 2001). However, as discussed in this paper, there are some problems associated with the reliability of SET scores. Before further discussing the reliability concept, it should be noted that it is a feature of scores provided by raters (or responses by students in SET). In the literature, it is not so uncommon to see studies in which reliability was shown as a feature of instruments (Spooren et al., 2007; Bierer et al., 2004; Coffey & Gibbs, 2001; Pike, 1998; Tuan et al., 2000; Zhao & Gallant, 2012).
In a broad sense, reliability refers to consistency of ratings and/or raters. It can be grouped into two categories: consistency of scores provided by individuals (internal consistency reliability) and agreement on the subject being rated by raters (inter-rater reliability) (As the third category stability can be stated, which is out of scope of this paper). In the context of SET, internal consistency reliability can be defined as the degree to which items in a SET form measure the same trait, i.e. instructional effectiveness, and this kind of reliability is used to make inferences about students. On the other hand, inter-rater reliability indices are related to how close students’ responses to each
other. Unlike internal consistency indices, inter-rater reliability indices provide information as to degree on which students agree on instructors. Thus, the former is used for inferences about raters (students), while the latter gives information about object being rated (instructors).
1.1 Inter-Rater Reliability
Although there are several methods to evaluate internal consistency-based reliability such as average inter-item correlation, split half, etc., the most commonly used index is Cronbach’s Alpha index (Formula 1) (Cronbach, 1951).
α=K/(K-1)[1-sum of σ2
K / σ2Ttotal] (1)
where K is the number of items, σ2
K is the variance of Kth item, σ2Ttotal is the variance of the observed total test scores.
The index developed by Cronbach is actually an extension of Kuder-Richardson’s KR-20 formula which is used to calculate reliability of scores obtained from dichotomously categorized items. The Alpha index can be used with multiple response categories such as items in SET forms (Bain, 2004; Bierer et al., 2004; Espeland & Indrehus, 2003; Zhao & Gallant, 2012; Gentry & Owen, 2004; Richardson, Slater, & Wilson, 2007; Rindermann & Schofield, 2001; Spooren, Mortelmans, & Denekens, 2007). In terms of internal consistency, high values of Alpha are observed if students provide consistent rating scores within their responses regardless of other students. They do not have to agree on characteristics of instructor. For example, in a class in which half of students have negative opinions about instructors and the other half positive, it would quite be expectable to achieve a high Alpha if former group assign have lower scores and the latter do higher, consistently.
Cronbach’s Alpha does not take errors due to ratings of students into account (Rantanen, 2013). However that component of variance is what constitutes the main error source related to SET (Sun & Valiga, 1997). In other words, variability in SET scores is mainly due to the lack of agreement among students on instructors, rather than the lack of ability to measure the same trait by items and this is why Alpha is not informative about instructors (Morley, 2014). Inter-rater reliability has been encouraged by several researchers such as Marsh (2007), Morley (2014), and Tinsley and Weiss (2000) who suggested that inter-rater reliability indices should be used for SET scores. Several indices were proposed to assess inter-rater reliability such as Kappa, Spearman’s ρ and Intra-class correlations (ICCs). Kappa index is used when there are only two rates and Spearman’s ρ is a correlational-based index, while ICCs can be used for any number of raters and it takes variance due to raters’ scores into account. There are two ICC reliability coefficients: ICC for consistency and ICC for absolute agreement, given by Formulas 2 and 3, respectively.
ICCConsistency= σ2S / (σ2S + σ2Error) (2) ICCAbsolute Agreement= σ2S / (σ2S + σ2R + σ2Error) (3) where σ2
S is variance due to differences between objects being rated, σ2R is variability due to differences in rating scales used by raters, and σ2
Error is variance due to differences between scores assigned by raters.
In the context of SET, the formulas (2) and (3) are used to assess how a group of students assesses several items regarding one instructor. In SET scores, sources of variance in ICCs are as follows: (i) The variance due to differences between instructor’s characteristics assessed by different items (σ2
S), (ii) the variance based on differences between students’ ratings for an aspect for which they have the same opinion (σ2
R), and (iii) the variance from differences between students’ opinions about instructor (σ2
Error). The difference between two ICC formulas is the variance term, σ2
R, which is of importance depending on the purpose of the assessment. If the SET scores are to be used for high-stake decisions such as promotion of an instructor, a consensus among students’ ratings should be expected. In other words, a high level of agreement on the scores given by students is needed. In other words, high ICC for absolute values agreement is needed since it takes grading leniency of students in scoring. On the other hand, ICC for consistency should be used if the purpose is just ranking instructors, in which absolute agreement on instructors is irrelevant. When ranking instructors based on SET scores, a less degree of consistent ordering among students would be sufficient. To achieve high inter-rater reliability for consistency, students who order the items in a similar manner would be sufficient. They do not need to agree on the ratings completely.
Three reliability coefficients discussed above are not inter-related. Student ratings are mostly internally consistent whereas students do not agree on instructors (McGraw & Wong, 1996). Morley (2014) showed that inter-rater reliabilities were considerably lower than internal consistency indices. Rantanen (2013) calculated mean of inter-rater reliabilities for SET as 0.29, whereas Solomon et al. (2007) found a value of 0.22. Thus the assumption that high internal consistency does not guarantee agreement among students on instructors should not be assumed.
1.2 Feedbacks Required for Reliable SET Scores
Another omitted or ignored problem, purposefully or not, with reliability of SET scores is that they commonly are estimated without considering minimum number of feedbacks required. If sufficient ratings are not provided by students in a class, this means that the class is not sampled adequately. Calculating reliability coefficients with insufficient feedback does not allow making reliable inferences based on SET scores. As Solomon et al. (2007) stated, there are limited number of studies focused on number of feedbacks required for accurate decisions. In their study, they estimated that 30 to 40 feedbacks are required to achieve an inter-rater reliability of 0.92, a value suggested for high-stake decisions. Rantanen (2013) showed that 15 feedbacks are needed, if one wishes to make inference about an instructor on a single course. But if a more comprehensive evaluation on an instructor is to be made, more feedback would be required. Gillmore, Kane, and Naccarato (1978) gave a number of 5 to 10 courses with at least 20 students within them. Thus having a reliability score at an acceptable level is not enough for precise evaluation. Number of feedback should also meet the minimum criteria.
1.3 Relationship between Reliability and Validity
The last issue focused in that paper is the relationship between reliability and construct validity of SET forms. In practice, SET forms are generally validated at institutional-level during developmental stage and the same instrument is used across all faculties. But reliability is calculated based on a class and/or instructor. If the construct validity defined based on whole group is not applicable to some subgroups, reliability coefficients calculated based on common factor structure would be wrong. If all items in a SET form do not group under the same dimension, it would be meaningless to calculate reliability coefficient including all items. The argument of this paper is that low reliability coefficients can also be due to from the lack of construct validity. Zaharo and Gallant (2012) confirmed that SET forms have construct validity, stating that their items explained approximately 50% of the total variance. Another studies provided findings confirming validity of SET forms (Abrami, 2001; Ellett et al., 1997; Lemos, Queiros, Teixeira, and Menezes, 2011; Marsh, 2007; Theall & Franklin, 2001). However, all these studies focused on whole group assuming a common factorial structure could be applied for classes. But several studies revealed several student segments hidden in the whole body. For example, Trivedi, Pardos, and Heffernan (2011) identified seven subgroups. Another study conducted by Marsh and Hocevar (1991) revealed 21 student segments based on several academic variables. A recent study by Sriprakash, Possamai and Brackenreg (2014) made a similar classification based on university students’ religious preferences. Existence of such subgroups led the researcher to investigate applicability of a common factor structure across all classes. Calculating reliability under an invalid factorial structure is likely to result in misled decisions. Thus it is of significant importance to check the construct validity of SET forms across groups for which reliability are calculated.
The main argument of this paper is that using correct reliability coefficient with sufficient number of feedbacks under a valid factorial model is of significant importance since SET scores are used in higher education institutions for many decisions, some of which are high stake. That study hypothesizes that using internal consistency measures is misleading in SET context since the variability is mainly due to disagreement between students’ ratings. The second hypothesis is that number of minimum feedbacks is not achieved in most of the classes, resulting unreliable decisions. The third hypothesis was stated as follows: calculating reliability assuming a common factor structure across all class is misleading because a common model may not be tenable for all.
To test these hypotheses, the study checked values of the three reliability coefficients (Alpha and two ICCs) across classes. Differences between expected and actual numbers of feedbacks were investigated. With regard to relationship between reliability and construct validity, fit of originally proposed model was checked across subgroups via confirmatory factor analysis.
2. Method
2.1 Sample
A total of 29287 students provided responses in 900 undergraduate- and graduate-level classes in an English-medium, non-profit university in Turkey. Mean class GPA for the courses 2.72 (SD=0.72) out of 4.00. Sixty-five per cent of the classes had 25 or less students and mean class size was of 35.57 (SD=13.63). Credit of the courses ranged between 1 and 8 with a mean of 3.07 and a standard deviation of 0.99. Most of the courses had 3 credits (69.4%). Seven hundred and thirty-five instructors were rated by students. Mean feedback for an instructor is 39.85 (SD=27.59). Average number of students who provided feedback in SET forms were 13.01 (SD=8.07) per class.
2.2 Instrurement
In the SET form, there were 10 items to elicit students’ opinions: (i) The instructor clearly stated course objectives and expectations from students, (ii) The instructor stimulated interest in the subject, (iii) The instructor was able to promote effective student participation in class, (iv) The instructor helped develop analytical, scientific, critical, creative, and independent thinking abilities in students, (v) The instructor interacts with students on a basis of mutual respect, (vi) The instructor was on time and has not missed classes, (vii) The instructor taught the course in English, (viii) Rate the instructor's overall teaching effectiveness in this course, (ix) I learned a lot in this course, and (x) The exams, assignments, and projects required analytical, scientific, critical, and creative thinking.
Confirmatory factor analysis was conducted to assess fit of a unidimensional model with 10 items by LISREL (Jöreskog & Sörbom, 2004). The 10-item model yielded poor fit indices, indicating a low fit between data and the model. After checking inter-item correlations and model parameters, items (vi) and (vii) were removed from the model due to low inter-item correlations and error variances. The fit of the unidimensional model with 8 items showed a considerable improvement. Standardized path coefficients for items (i) to (x) were 0.87, 0.94, 0.90, 0.93, 0.76, 0.93, 0.94, and 0.88, respectively. Estimated fit indices were: Root Mean Square Error of Approximation (RMSEA) =0.06 [90% CI=0.04:0.07], Standardized root mean square residual (S-RMR)=0.03, Goodness of Fit Index (GFI)=0.94, and Comparative Fit Index (CFI)=0.98. When compared generally accepted values for an adequate fit (RMSEA and S-RMR below .08, GFI and CFI above .90) (Hu & Bentler, 1999), it was concluded fit indices were indicated a perfect fit between the data and the model. These 8 items were considered to be grouped under a trait (which can be named as instructional effectiveness) used in calculation of reliability coefficients. 2.3 Description of the Analyses Conducted
Although Cronbach’s Alpha can be calculated directly, there are several considerations which may change the calculations of ICC coefficients. In ICCs, students are raters and the items are object being rated. First, the model of the ICCs should be defined. This includes a decision on whether all items are rated by the all students in a class or by a group of students. In most of the practices, students rate all items and this corresponds to Two-Way model in ICCs. Another decision is related to whether raters are representative of a larger population or not. If students are a sample, then it is called random model, while it is mixed if students are only raters of interest. The last decision is associated with the form of the ICCs. They can be calculated based on a single measurement or averaging k students in a class. In the present study, in parallel to the literature (Morley, 2014), students (raters) were considered substitutable, while items (objects being rated) were taken as fixed. In other words, Two-Way Mixed model with single measure ICCs were used and, following the notation proposed by McGraw and Wong (1996), ICC(C,1) and ICC(A,1) were used for consistency and absolute agreement, respectively. However, choosing one of the models is not a problem from a pragmatic point of view, since the indices calculated based on Two-Way Mixed and Two-Way Random models are exactly the same (Shrout & Fleiss, 1979). In the present study, Two-Way Mixed with single measures approach was adopted for both ICCs.
All of the three reliability coefficients were calculated using SPSS 20’s reliability procedure. However, before calculating ICC indices, data were transposed so that rows presented items and columns the students, due to a requirement by the algorithm used by SPSS. Two values are selected in the present study: 0.70, a value that can be used for formative purposes and 0.90, for summative assessment including high-stake decisions (Morley 2013; Rantanen, 2013).
First, distributions of three reliability indices were examined using a frequency graph. Then Spearman-Brown prophecy formula (4) was used to define minimum numbers of students, to achieve reliability levels of 0.70 and 0.90, separately. Although the formula was originally developed to estimate new reliability after test length changes, it can also be applied to relate change in number of students and reliability, as shown by Benton, Duchon, and Pallet (2011). Current reliability (ρ) was estimated by taking average of ICC(C,1) and ICC(A,1), from the sample of that study, separately. Since ICCs were calculated based on single observer, N was taken as 1 in the formula.
ρ' = Nρ / [1 + (N-1)ρ] (4)
where ρ is the current reliability and N is equal to new number of students sample size divided by 1.
Although the formula (4) is useful in relating number of feedbacks and class size, a question still arises. Is obtaining reliable SET scores not possible for classes with sizes below the values estimated by formula (4)? In practice, class size may show a large variation and the minimum numbers calculated above may not be achieved for smaller classes. For these classes, Rantanen (2013) proposed a new approach. He defined the equality between standard error of a mean for finite populations and standard error for a sample in an infinite population. As a result he derived the
formula (5) for estimating minimum number of feedback as a function of current class size and the class size obtained from the formula (4). For detailed derivation of the formulas, please see Rantanen (2013).
Nc = NpN / (NpN- 1) (5) where Nc is the number of feedback required, Np is class size, and N is the sample size calculated using formula (4)). The last analysis included checking factorial structure of the SET form across subgroups. To this end, classes were clustered to identify their natural groupings in terms of three reliability coefficients via TwoStep cluster analysis. The purpose of this method, developed by Chiu et al. (2001), is to reveal subgroups, if there is any, hidden in the whole body that would otherwise not be. TwoStep cluster analysis is based on hierarchical clustering. It first assigns cases into a pre-cluster and then creates final clusters. Among advantages of this method are ability to handle variables at different scales, automatic determination of number of clusters and ability to handle large data sets. TwoStep cluster analysis also provides importance levels of the predictor variables. After defining clusters, equalities of factor loadings of the 8-item model were tested across groups using Lisrel’s multi-group analysis. Fit indices accepted for a good fit were as follows: RMSEA and S-RMR below .08, GFI and CFI above .90) (Hu & Bentler, 1999).
3. Results
3.1 Distribution of Reliability Indices
SPSS was not able to calculate Cronbach’s Alpha indices for 73 classes and ICCs for 111 classes due to zero variances items. Also classes with at least one missing reliability coefficient were removed from the dataset. Thus a total of 702 classes were kept. Correlations between three reliability coefficients are given in Table 1. As can be seen, correlations between three measures are weak in positive direction, indicating that Cronbach’s Alpha, ICC(C, 1) and ICC(A, 1) coefficients within class did not vary in parallel.
Table 1. Correlations between Reliability Estimates
Cronbach’s Alpha ICC(C, 1) ICC(C, 1) .244**
ICC(A, 1) .077* .256** *. Correlation is significant at the 0.05 level (2-tailed) **. Correlation is significant at the 0.01 level (2-tailed)
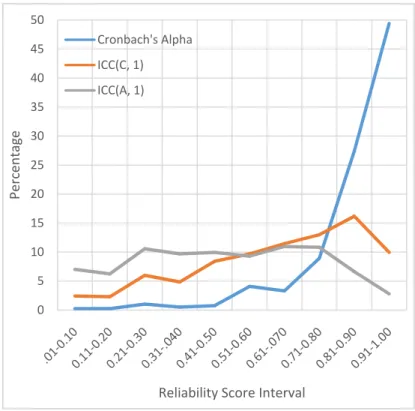
Means (SDs) of the Cronbach’s Alpha, ICC(C, 1) and ICC(A, 1) were 0.85 (0.17), 0.59 (0.29), and 0.35 (017), respectively. Medians were found to be 0.91, 0.67, and 0.46, respectively. Differences between means and medians indicated that indices had skewed distributions. Numbers (percentages) of class that had reliability levels above 0.70 were 634 (90%), 319 (45%), and 171 (24%) for the Cronbach’s Alpha, ICC(C, 1) and ICC(A, 1), respectively. A large drop was observed a large drop when numbers (percentages) of classes with the reliability above 0.90 were checked, 401 (57%), 95 (13%), and 27 (4%), respectively. Numbers (percentage) of courses with all reliability coefficients above 0.70 were 155 (22.08), whereas only 16 courses (2.28%) had values above 0.90 for all three reliability coefficients. Figure 1 shows the frequencies and cumulative frequencies of reliability coefficients. Figures showed that ICCs were almost equally distributed between 0 and 1, indicating inter-rater reliability rarely achieved in SET scores, whereas Cronbach’s Alpha had mostly higher values.
Figure 1. Percentages of Classes within Reliability Intervals 3.2 Minimum Numbers of Feedback Required
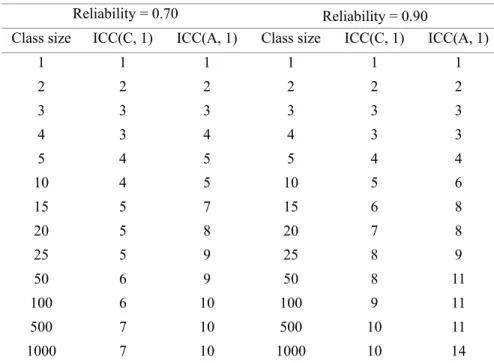
Since the focus is at inter-rater reliability in this paper, minimum feedback for Cronbach’s Alpha was not considered. Averages of ICC(C, 1) and ICC(A, 1) were found to be 0.38 and 0.17. These two values were used as initial reliability estimates (ρ) in formula (4). Application of formula revealed that 10 students would be enough to have a mean inter-rater reliability to 0.90 for ICC(C, 1) in larger classes. Similarly, ICC(A, 1) of 0.90 requires 14 feedback. In approximately 35% (n=245) and 57.7% (n=405) of the classes, number of students were below 10 and 14. Therefore, using the formula (5), minimum numbers of feedbacks to make a reliable assessment were determined for smaller classes. Results indicated that, for example, 5 feedbacks would be enough to obtain an ICC(C, 1) of 0.90 in a class of 10 students. Similarly, 6 students were found to be enough to achieve an ICC(A, 1) of 0.90 for same class size (Table 2). For the reliability of 0.70, required numbers of feedback were smaller. ICC(C, 1) and ICC(A, 1) were found to require 4 and 5 feedbacks in a class of 10 students, respectively. In approximately 21% (n=146) and 31% (n=221) of the classes, number of feedback were not achieved for ICC(C, 1) ad ICC(A, 1) level of 0.70.
0 5 10 15 20 25 30 35 40 45 50 Percentage Reliability Score Interval Cronbach's Alpha ICC(C, 1) ICC(A, 1)
Table 2. Minimum Numbers of Required Feedback as a Function of Class Size
Reliability = 0.70 Reliability = 0.90
Class size ICC(C, 1) ICC(A, 1) Class size ICC(C, 1) ICC(A, 1) 1 1 1 1 1 1 2 2 2 2 2 2 3 3 3 3 3 3 4 3 4 4 3 3 5 4 5 5 4 4 10 4 5 10 5 6 15 5 7 15 6 8 20 5 8 20 7 8 25 5 9 25 8 9 50 6 9 50 8 11 100 6 10 100 9 11 500 7 10 500 10 11 1000 7 10 1000 10 14
Table 3 presents descriptive information about missing feedbacks. Differences between mean and median showed that distributions were right-skewed. Percentage of the missing feedback was 30.93 for ICC(C, 1), whereas it was 33.52 for ICC(A, 1). There were some extreme classes with missing feedback with ratios around 90%.
Table 3. Descriptives of Percentage of Missing Feedbacks
Reliability Levels
0.70 0.90
Statistic ICC(C, 1) ICC(A, 1) ICC(C, 1) ICC(A, 1) Mean 19.45 24.45 30.93 33.52 Median 23.00 26.78 25.00 28.98 Mode 25.00 12.00 25.00 15.00 SD 20.45 19.37 19.88 20.35 Minimum 0 0 0 0 Maximum 72.78 62.99 88.33 91.14 3.3 Construct Validity
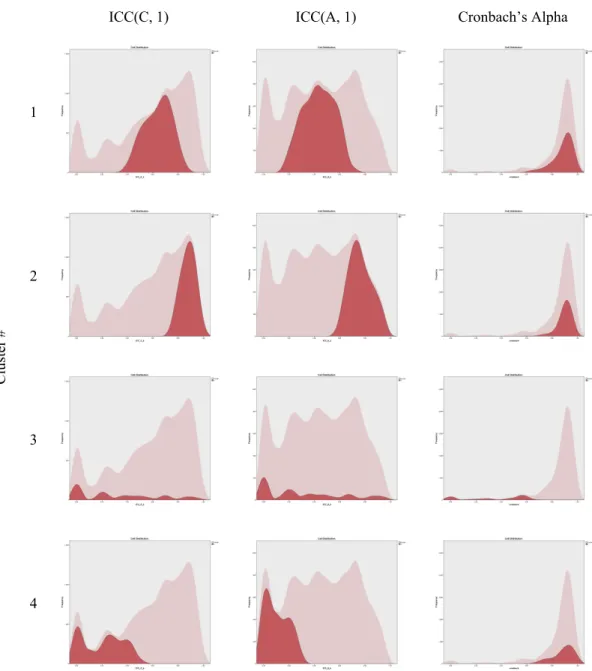
TwoStep Cluster analysis was conducted to reveal natural groupings in the data set, with three reliability indices as input variables. Analysis identified 4 clusters. Number of classes in each clusters was 287 (40.9%), 206 (29.4%), 154 (22.0%), and 55 (7.8%). Importance of predictors were estimated 1.0, 0.98, and 0.81 for ICC(C, 1), ICC(A, 1), and Cronbach’s Alpha, respectively. ICCs were observed as better predictors for group membership as compared to Cronbach’s Alpha. Means for reliability coefficients can be seen in Table 4. Figure 2 presents relative distributions of each cluster in input variables.
Table 4. Means of Reliability Indices across Clusters
Clusters
Reliability Index 1 2 3 4 ICC(C, 1) 0.64 0.88 0.33 0.21 ICC(A, 1) 0.43 0.76 0.32 0.10 Cronbach's Alpha 0.89 0.90 0.35 0.89
While ICCs differed, high Cronbach’s Alpha was common across all clusters except Cluster 3. This cluster can be defined as having classes with unacceptable reliability coefficients in none of the reliability indices. ICCs in this cluster covered a large range with lower frequencies. Cluster 2 included classes with high values for all three reliability coefficients. Cluster 4 included classes in which students provided internally consistent responses but not in terms of inter-rater reliability. Cluster 1 had similar internally consistency but inter-rater reliability for consistency was lower than Cluster 2.
ICC(C, 1) ICC(A, 1) Cronbach’s Alpha
Clu ster # 1 2 3 4
Figure 2. Relative Distributions of Reliability Indices across Four Clusters
Furthermore, three One-way ANOVAs showed significant mean differences in all reliability coefficients across four clusters (F(3, 700) = 540.934, p < .001 for Cronbach’s Alpha; F(3, 700) = 787.332, p < .001 for ICC(C, 1) and F(3, 700) = 756.993, p < .001 for ICC(A, 1)). Means of Cronbach’s Alphas between Clusters 1 and 3, Clusters 2 and 3, Clusters 3 and 4 were found to be significantly different based on Scheffe post-hoc tests. For two ICCS means were significantly different across all clusters (p < .05). Thus it can be concluded that four clusters constituted significant profiles in ICCs, and partially in internal consistency.
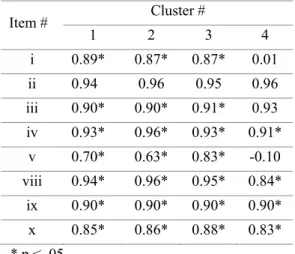
Investigation of standardized factors loadings (Table 4) indicated that they are similar across clusters, except in Clusters 4. Cluster 1 (RMSEA=0.079, SRMR=0.011, GFI=0.919, CFI=0.983) had high factor loadings (M=0.94). Means of factor loadings in Cluster 2 was 0.96 (RMSEA=0.079, SRMR=0.029, GFI=0.849, CFI=0.961) Similarly,
Cluster 3 had also acceptable values with a mean of the loadings of 0.95 (RMSEA=0.066, SRMR=0.016, GFI=0.931, CFI=0.988). Items explained 0.40 of the variance at minimum for these three clusters. The loadings of the Cluster 4 showed that items i and v had unacceptable values. In that cluster, these two items were defined as a second factor but the model did not converge. Two items were excluded from the model and the factor loadings were estimated again. The new model had acceptable fit indices (RMSEA=0.071, SRMR=0.021, GFI=0.903, CFI=0.965). Mean of the factors loadings were 0.95. For classes in cluster 4, reliability coefficients were also calculated again. The new model produced significant improvements in terms of all three indices. Means of ICC(C, 1) and ICC(A, 1), and Cronbach's Alpha were 0.63, 0.55, 0.42, respectively. (Older values were 0.21, 0.12, and 0.89, respectively).
Table 4. Standardized Factor Loadings across Clusters
Item # Cluster # 1 2 3 4 i 0.89* 0.87* 0.87* 0.01 ii 0.94 0.96 0.95 0.96 iii 0.90* 0.90* 0.91* 0.93 iv 0.93* 0.96* 0.93* 0.91* v 0.70* 0.63* 0.83* -0.10 viii 0.94* 0.96* 0.95* 0.84* ix 0.90* 0.90* 0.90* 0.90* x 0.85* 0.86* 0.88* 0.83* * p < .05
Low reliability of Cluster 3 seemed to be mostly associated with students’ disagreement on instructors. High factor loadings indicated that the 8-item model worked well for classes in this cluster. However, the lack of fit for cluster 4 indicated that reliability coefficients cannot be calculated based on the common model due to the misfit with factorial structure. A further analysis was revealed that rates of missing feedbacks were not differed across clusters.
To sum up, analyses indicated that most of students provided in SET forms internally consistent responses, but ICCs were mostly not at the acceptable level. The situation was even worse when absolute intra-class correlations for absolute agreement were considered. Furthermore, number of feedbacks reported by students was observed not to be enough to calculate inter-rater reliability in some classes. Results also showed that the factor structure may not be applicable for all subgroups, and low reliability can be explained by students’ disagreement on instructors and the lack of validity.
4. Discussion
The present study focused aspects regarding reliability of SET scores. Three hypotheses were tested: (i) using internal consistency measures is misleading in SET context since the variability is mainly due to disagreement between students’ ratings, (ii) number of minimum feedbacks is not achieved in most of the classes, potentially resulting unreliable decisions, and (iii) calculating reliability assuming a common factor structure across all classes is misleading because a common model may not be tenable for all.
4.1 Inter-Rater Reliability
The results of the present study indicated that there are significant differences between distributions of internal consistency (Cronbach’s Alpha) and inter-rater reliability (two ICCs) measures. In terms of internal consistency of scores, SET scores were observed to be highly reliable when assessed by Cronbach’s Alpha. On the other hand, two ICCs indices had considerably lower values especially for ICC for agreement. Analyses revealed that nearly 45% and 24% of the classes had a reliability level 0.70 or above, for ICC for consistency and absolute agreement, respectively. When a more stringent reliability level (0.90) was considered, the situation gets worse. Percentage of classes above 0.90 was only 13% and 7% for two ICCs, respectively. Students responded consistently the SET items, but they did not seem to have a consensus on instructor. There may be several reasons for the disagreement among students. First, a conflict between a group of student and instructor in a class may cause those students to develop negative attitudes towards instructor even if he or she is an effective instructor. Grading policy may also provide an explanation for the lack of agreement among students. It is well known that students may reflect the negative effect of grading policy, expected and/or received grades on SET scores (Goldberg & Callahan, 1991; Krautmann & Sander, 1997;
Rodabaugh & Kravitz 1994). Students with low expectations may prefer to assign lower scores for instructors regardless of instructional performance. Trout (2000) stated that students use SET items also to reward or punish instructors. Maturity of students to make a sound assessment of instructor is another concern stated in the literature. Students taught by same instructors may have different interpretations for instructional practices assessed in SET forms.
4.2 Feedbacks Required for Reliable SET Scores
As to number of feedback for reliable SET scores, it was observed that minimum numbers of student responses were not achieved in most of the classes. For ICC for consistency (absolute agreement) approximately between 20% (25%) and 31% (34%) of the required feedback were missing. Classes that are inadequately sampled in number of students may not produce reliable scores. It should also be noted that required numbers of feedback for only one class taught in one semester. If one wishes to make inference for a course and/or instructors over years, more feedback would be required (Gillmore, Kane, & Naccarato, 1978). The situation in practice may be worse and more feedback might be required as stated in this paper. The formulas in the paper is based on the random sampling and if some of the students who wishes to say about instructor are missing at SET day, a bias may occur due to this students.
4.3 Relationship between Reliability and Validity
Results also indicated that a common factorial model may not be tenable for all classes. Analyses revealed that a group of classes did not fit the common model. After proposing a new model for these classes, reliability measures increased significantly. Thus it can be concluded that even a common factorial model is proposed and used thoroughly in all classes, there may be some groups for which the model is not valid. If this is the case, calculating reliability coefficients for such classes may not be reflecting true reliability. As considered together with the lack of maturity of students, some items may be easier to interpret and include directly observable stems, some are more abstract.
Although validity of SET forms studied extensively (Benton and Cashin 2012; Abrami, 2001; Theall & Franklin 2001; Wilhelm and Comegys, 2004), results from that study provided contradictory results with the results in the literature. Segment of classes defıned by cluster analysis showed that construct which was intended to be measured by SET forms may not be tenable for some classes with low reliability indices. On the other hand, another cluster which included classes with low reliabilities was shown to have strong construct validity. Indeed unfitting models were expected since, as Young and Shaw (1999) and Kalender (2014), showed that there is no universal definition of instructional effectiveness acceptable for all. Thus it can be said that when confronted with low reliabilities, checking construct validity should be step which is needed to be checked. If necessary, alternative models and/or modified models with different specifications could be defined (Shevlin et al. 2000).
4.4 Conclusion
The results discussed above may trigger an alert for those who use SET scores, especially for decision-makers in terms of usefulness of SET. Lower inter-rater reliabilities suggested that SET scores should be with caution, or maybe not be used at all for formative and summative purposes. For formative assessment lower levels of inter-rater reliability values may be acceptable. But for summative purposes inter-rater reliabilities were far beyond the acceptable levels as indicated by the results. SET has been used as the principal way for obtaining feedback from students and making decisions in higher education institutions. Some other ways to assess instructors may be used to compensate the lack of inter-rater reliability: in-class observations, peer-assessment, self-assessment, alumni evaluation, etc. The present study does not exclude the practice of using Cronbach’s Alpha or any other internal consistency measures, but its use should be limited to assessment of consistency of respondents. But inter-rater reliability should be also considered when making decisions regarding instructors. Also ways for increasing rate of students who provided feedback should be sought. Analysis showed that although mean of students per class was 39.85, only one-third of students provided feedback (mean=13.01) per class.
As a limitation, independency of observations was not satisfied in most of the classes. After instructor leave the class, students may share their opinions and/or a student may prefer to give lower scores due to a contradiction between instructor and his or her friend. Thus one of the main assumptions may be violated in data collection phase.
The main argument of this paper was supported by the findings. Using correct reliability coefficient with sufficient number of feedbacks under a valid factorial model is of significant importance since SET scores are one of the main components in decision making. The results of that study implied that receiving highly consistent responses for SET forms from students does not necessarily imply that students would agree on instructor as well. Thus it is strongly advised that when internal consistency is observed, consensus among students should not naively be assumed and
must be checked. If internal consistency reliability is used to make inferences about instructors, results may be misleading since the reliabilities are found to be considerably larger than inter-rater indices.
References
Abrami, P. (2001). Improving judgments about teaching effectiveness using teacher rating forms. New Directions for Institutional Research, 109, 59-87. http://dx.doi.org/10.1002/ir.4
Addison, W., Best, J., & Warrington, J. 2006. Students’ perceptions of course difficulty and their ratings of the instructor. College Student Journal 40(2), 409–16.
Aleamoni, L. M. (1999). Student rating myths versus research facts from 1924 to 1998. Journal of Personnel Evaluation in Education, 13(2), 153-166. http://dx.doi.org/10.1023/A:1008168421283
Bain, K. (2004). What the Best College Teachers Do? Cambridge, MA: Harvard University Press.
Baldwin, T., & Blattner, N. (2003). Guarding against potential bias in student evaluations: what every faculty member needs to know. College Teaching, 51(1), 27-32. http://dx.doi.org/10.1080/87567550309596407
Benton, S. L., & Cashin, W. E. (2012). Student ratings of teaching: A summary of research and literature. IDEA Paper # 50, IDEA Center, Kansas State University.
Benton, S. L., Duchon, D. & Pallett, W. H. (2013). Validity of student self-reported ratings of learning. Assessment & Evaluation in Higher Education, 38(4), 377-388. http://dx.doi.org/10.1080/02602938.2011.636799
Beran, T., Violato, C., Kline, D., & Frideres, J. (2009). What do students consider useful about student ratings? Assessment and Evaluation in Higher Education, 33, 519-527. http://dx.doi.org/10.1080/02602930802082228 Bierer, S. B., Fishleder, A. J., Dannefer, E., Farrow, N., & Hull, A. L. (2004). Psychometric properties of an
instrument designed to measure the educational quality of graduate training programs. Evaluation & the Health Professions, 27, 410–424. http://dx.doi.org/10.1177/0163278704270006
Chiu, T., Fang, D., Chen, J., Wang, Y., & Jeris, C. (2001). A robust and scalable clustering algorithm for mixed type attributes in large database environment. In Proceedings of the 7th ACM SIGKDD International Conference on Knowledge Discovery and Data Mining 2001 (pp. 263–268). http://dx.doi.org/10.1145/502512.502549
Coffey, M., & Gibbs, G. (2001). Research note: The evaluation of the student evaluation of educational quality questionnaire (SEEQ) in uk higher education. Assessment & Evaluation in Higher Education, 26, 89–93. http://dx.doi.org/10.1080/02602930020022318
Cronbach, L. J. (1951). Coefficient alpha and the internal structure of tests. Psychometrika, 16, 297-334. http://dx.doi.org/10.1007/BF02310555
Ehie, I. C. & Karathanos, D. (1994). Business faculty performance evaluation based on the new aacsb accreditation standards. Journal of Education for Business, 69(5), 257-262. http://dx.doi.org/10.1080/08832323.1994.10117695
Ellett, C.D., Loup, K.S., Culross, R. R., Mcmullen, J.H., & Rugutt, J. K. (1997). Assessing enhancement of learning, personal learning environment, and student efficacy: Alternatives to traditional faculty evaluation in higher education. Journal of Personal Evaluation in Education, 11, 167–92. http://dx.doi.org/10.1023/A:1007989320210
Emery, C. R., Kramer, T.R, & Tian, R.G. (2003). Return to academic standards: a critique of student evaluations of teaching effectiveness. Quality Assurance in Education, 11(1), 37-46. http://dx.doi.org/10.1108/09684880310462074
Espeland, V., & Indrehus, O. (2003). Evaluation of students’ Satisfaction with nursing education in Norway. Journal of Advanced Nursing, 42, 226–236. http://dx.doi.org/10.1046/j.1365-2648.2003.02611.x
Gentry, M., & Owen, S.V. (2004). Student perceptions of classroom quality: Differences between honors, AP, and advanced students and students in general classes. Journal of Secondary Gifted Education, 16(1), 20-29.
Gillmore, G. M., Kane, M. T., & Naccarato, R. W. (1978). The generalizability of student ratings of instruction: estimation of the teacher and course components. Journal of Educational Measurement, 15, 1–13. http://dx.doi.org/10.1111/j.1745-3984.1978.tb00051.x
Goldberg, G., & Callahan, J. (1991). Objectivity of students’ evaluations of instructors. Journal of Education for Business, 66, 377-378. http://dx.doi.org/10.1080/08832323.1991.10117505
Hobson, S. M., & Talbot, D. M. (2001). Understanding student evaluations. College Teaching, 49, 26–31. http://dx.doi.org/10.1080/87567550109595842
Hu, L.T. & Bentler, P. M. (1999). Cutoff criteria for fit indexes in covariance structure analysis: conventional criteria versus new alternatives. Structural Equation Modeling, 6(1), 1-55. http://dx.doi.org/10.1080/10705519909540118
Jöreskog, K. G. & Sörbom, D. (2004). LISREL 8.7 for Windows [Computer software]. Skokie, IL: Scientific Software International, Inc.
Kalender, I. (2014). Profiling instructional effectiveness to reveal its relationship to learning. Asia-Pacific Education Researcher, 23(3), 717–726. http://dx.doi.org/10.1007/s40299-013-0145-2
Krautmann. A. C. & Sander, W. (1997). Grades and student evaluations of teachers. Economics of Education Review, 18, 59–63. http://dx.doi.org/10.1016/S0272-7757(98)00004-1
Kulik, J. (2001). Student ratings: validity, utility, and controversy. New Directions for Institutional Research. 109, 9-25. http://dx.doi.org/10.1002/ir.1
Lemos, M. S., Queiros, C., Teixeira, P. M., & Menezes, I. (2011). Development and validation of a theoretically based, multidimensional questionnaire of students evaluation of university teaching. Assessment & Evaluation in Higher Education, 36, 843–864. http://dx.doi.org/10.1080/02602938.2010.493969
Marsh, H. W. (2007). Students’ Evaluations of University Teaching: Dimensionality, Reliability, Validity, Potential Biases and Usefulness. In The Scholarship of Teaching and Learning in Higher Education: An Evidence-based Perspective, edited by R. P. Perry and J. C. Smart, 319–383. New York, NY: Springer. http://dx.doi.org/10.1007/1-4020-5742-3_9
Marsh, H. W., & Hocevar, D. (1991). Students evaluations of teaching effectiveness: The stability of mean ratings of the same teachers over a 13-year period. Teaching & Teacher Education, 7, 303-314. http://dx.doi.org/10.1016/0742-051X(91)90001-6
McGraw, K. O., & Wong, S. P. (1996). Forming inferences about some intraclass correlation coefficients. Psychological Methods, 1, 30–46. http://dx.doi.org/10.1037/1082-989X.1.1.30
Morley, D. (2014). Assessing the reliability of student evaluations of teaching: choosing the right coefficient. Assessment & Evaluation in Higher Education, 39(2), 127-139. http://dx.doi.org/10.1080/02602938.2013.796508
Nasser, F. & Fresko, B. (2006). Predicting student rating: the relationship between actual student rating and instructors’ predictions. Assessment and Evaluation in Higher Education, 31(1), 1-18. http://dx.doi.org/10.1080/02602930500262338
Nunnally, J. C., & Bernstein, I. H. (1994). Psychometric Theory. 3rd ed. New York, NY: McGraw-Hill.
Otto, J., Sanford, D. A, Jr, & Ross, D. N. (2008). Does ratemyprofessor.com really rate my professor? Assessment and Evaluation in Higher Education, 33(4), 355–368. http://dx.doi.org/10.1080/02602930701293405
Pike, C. K. (1998). A validation study of an instrument designed to measure teaching effectiveness. Journal of Social Work Education, 34, 261–271.
Rantanen, P. (2013). The number of feedbacks needed for reliable evaluation. A multilevel analysis of the reliability, stability and generalisability of students’ evaluation of teaching. Assessment & Evaluation in Higher Education, 38(2), 224-239. http://dx.doi.org/10.1080/02602938.2011.625471
Richardson, J. T. E., Slater, J. B. & Wilson, J. (2007). The national student survey: development, findings and implications. Studies in Higher Education, 32, 557–580. http://dx.doi.org/10.1080/03075070701573757
Rindermann, H., & Schofield, N. (2001). Generalizability of multidimensional student ratings of university instruction across courses and teachers. Research in Higher Education, 42, 377–399. 10.1023/A:1011050724796
Rodabaugh, R. C., & Kravitz, D. A. (1994). Effects of procedural fairness on student judgments of professors. Journal on Excellence in College Teaching, 5(2), 67-83.
Sriprakash, A., Possamai, A., & Brackenreg, E. (2014). Cosmopolitan tensions: Religious diversity in an Australian university. Australian Educational Researcher, 41(3), 227-242. http://dx.doi.org/10.1007/s13384-013-0123-y
Shrout, P., & Fleiss, J. (1979). Intraclass correlations: Uses in assessing rater reliability. Psychological Bulletin, 86(2), 420-428. http://dx.doi.org/10.1037/0033-2909.86.2.420
Solomon, D. J., Speer, A. J., Rosebraugh, C. J., & DiPette, D. J. (1997). The reliability of medical student ratings of clinical teaching. Evaluation & The Health Professions, 20, 343–352. http://dx.doi.org/10.1177/016327879702000306
Spooren, P., Mortelmans D., & Denekens, J. (2007). Student evaluation of teaching quality in higher education: development of an instrument based on 10 likert-scales. Assessment & Evaluation in Higher Education, 32, 667–679. http://dx.doi.org/10.1080/02602930601117191
Spooren, P., Brockx, B., & Mortelmans, D. (2013). On the validity of student evaluation of teaching: The state of the art. Review of Educational Research, 83, 598-642. http://dx.doi.org/10.3102/0034654313496870
Sun, A., & Valiga, M. (1997). Using generalizability theory to assess the reliability of student ratings of academic
advising. Journal of Experimental Education, 65(4), 367-79. http://dx.doi.org/10.1080/00220973.1997.10806611
Theall, M. & Franklin, J. (2001). Looking for bias in all the wrong places – A search for truth or a witch hunt in student ratings of instruction? In the student ratings debate: Are they valid? How can we best use them? Theall, P., Abrami, L. and Lisa Mets (Eds.) New Directions in Educational Research, no. 109. San Francisco: Jossey-Bass.
Tinsley, H. E. A. & Weiss, D. J. (2000). Interrater reliability and agreement. In H. E. A. Tinsley & S. D. Brown, Eds., Handbook of Applied Multivariate Statistics and Mathematical Modeling, pp. 95-124. San Diego, CA: Academic Press. http://dx.doi.org/10.1016/B978-012691360-6/50005-7
Trivedi, S., Pardos, Z. & Heffernan, N. (2011). Clustering Students to Generate an Ensemble to Improve Standard Test Score Predictions. In Biswas et al. (Eds). Proceedings of the Artificial Intelligence in Education Conference, 328–336. http://dx.doi.org/10.1007/978-3-642-21869-9_49
Tuan, H. L., Chang, H. P, Wang K. H., & Treagust, D. F. (2000). The development of an instrument for assessing students’ perceptions of teachers’ knowledge. International Journal of Science Education, 22, 385–398. http://dx.doi.org/10.1080/095006900289804
Wilhelm, W. B., & Comegys, C. (2004). Course selection decisions by students on campuses with and without published teaching evaluations. Practical Assessment, Research & Evaluation, 9(16). Retrieved from http://PAREonline.net/getvn.asp?v=9&n=16
Young, S., & Shaw, D. G. (1999). Profiles of Effective College and University Teachers. The Journal of Higher Education, 70(6), 670–686. http://dx.doi.org/10.2307/2649170
Zhao, J., & Gallant, D. J. (2012). Student evaluation of instruction in higher education: Exploring issues of validity and reliability. Assessment & Evaluation in Higher Education, 37, 227–235. http://dx.doi.org/10.1080/02602938.2010.523819