Download details:
IP Address: 212.174.144.130
This content was downloaded on 11/01/2016 at 13:45
Please note that terms and conditions apply.
View the table of contents for this issue, or go to the journal homepage for more 2011 J. Phys.: Conf. Ser. 309 012002
Ultralow background periods in CAST Micromegas
detectors and tests in the Canfranc Underground
Laboratory
F.J. Iguaz1, T. Dafni2, E. Ferrer-Ribas1, J. Gal´an2, J.A. Garc´ıa2, A. Gardikiotis3, I. Giomataris1, I. Irastorza2, J.P. Mols1,
T. Papaevangelou1, A. Rodr´ıguez2, A. Tom´as2, T. Vafeiadis4,5 and C. Yildiz6
1
IRFU, Centre d’ ´Etudes Nucl´eaires de Saclay (CEA-Saclay), Gif-sur-Yvette, France
2
Laboratorio de F´ısica Nuclear y Astropart´ıculas, Universidad de Zaragoza, Zaragoza, Spain
3 Physics Department, University of Patras, Patras, Greece 4
European Organization for Nuclear Research (CERN), Gen`eve, Switzerland
5 Aristotle University of Thessaloniki, Greece 6
Dogus University, Istanbul, Turkey
E-mail: [email protected]
Abstract. Micromegas detectors have shown a low and stable background level in the CAST experiment due to their low radioactive materials, good energy resolution and spatial resolution. Since 2008, four ultralow background periods have been observed with the new microbulk detectors. During these periods, the background level reduced one order of magnitude, reaching a value around 10−7 s−1 keV−1 cm−2 between 2 and 7 keV. In all cases, the intensity of the three fluorescence lines (at 3, 6 and 8 keV) presented at the background spectrum reduced but the relative ratio remained stable. To clarify the origin of these periods and might determine the ultimate background level of these readouts, a CAST-like detector has been installed at the Canfranc Underground Laboratory. The actual level is compatible with the one measured in CAST. A new Micromegas detectors is being developped for working in CAST experiment during 2011, based on the conclusions of this work.
1. Introduction
The CERN Axion Solar Telescope (CAST) uses a prototype of a superconducting LHC dipole magnet to convert axions into detectable X-ray photons. Axions are pseudoscalar particles that appear in the Peccei-Quinn [1, 2] solution of the strog CP problem and are candidates to Dark Matter. Stars could produce axions via the Primakoff conversion of plasma photons [3]. The CAST experiment points to the Sun aiming to detect solar axions. These particles could couple to a virtual photon provided by the magnetic transverse field of 9 T, being transformed into a real photon that carries the energy and momentum of the original axion [4]. The magnet is able to follow the Sun twice a day during the sunset and sunrise for a total of about 3 hours per day. During the remaining time, i.e, when the CAST magnet is not aligned with the solar core, background data is taken.
The experiment finished its first phase keeping the bores under vacuum by 2004 after having taken two years of data. As no significant signal above background was observed when following
the Sun, an upper limit on the axion-to-photon coupling of gaγ < 8.8× 10⁻¹¹ GeV−1 (95% CL)
for axion masses ma < 0.02 eV was set [5]. For extending the axion mass range, CAST was
upgraded with a sophisticated gas system and novel cold windows for operation with helium gas at various pressures inside the magnetic field region. This gas would restore the coherent conversion probability from axions to photons for a narrow axion mass range.
During 2005 and 2006 the magnet was filled with 4He gas and axion masses up to 0.39 eV
were investigated by measuring a total of 160 presure steps between 0.08 mbar and 13.4 mbar.
A typical upper limit on the axion-to-photon coupling of gaγ < 2.2× 10⁻¹⁰ GeV−1 (95% CL)
for axion masses ma < 0.39 eV was extracted [9]. Since the year 2008, CAST is taking data
with 3He in the magnet bore. At the moment of writing this proceeding, nearly 720 pressure
steps have already been measured, equivalent to a gas pressure of 80 mbar and an axion mass
of 0.93 eV. A preliminary exclusion plot for the 3He data acquired during 2008 was generated
[10], which includes data from three out of the four detectors and covers axion masses between 0.39 and 0.65 eV. The data of the remaining detector is being analyzed and the final combined limit is expected soon.
2. Micromegas detectors in CAST 2008-10
During the first phase of CAST and 4He data-taking periods, a conventional Micromegas was
used, covering one of the four magnet bore exits. Althought it was the only detector without
any shielding, it showed the lowest background level of the three detectors: 5× 10⁻⁵ s−1 keV−1
cm−2. This fact motivated the installation of a shielding in 2008, consisting of a 25 mm thick
archeological lead layer and an external 15-20 cm thick polyethylene layer. Between these two parts, there is a cadmium foil to absorb the neutrons thermalized in the polyethylene. A 5 mm-thick copper layer is placed inside the lead which works also as Faraday cage. The whole setup is flushed with nitrogen in order to remove radon.
The new shielding reduced the background level by a factor 3, reaching the level of 1× 10⁻⁵
s−1 keV−1 cm−2 during the data-taking period between April and September of 2008. At the
end of 2008, two of the Micromegas detectors were replaced by two new microbulk [13] type models. These detectors are built with very low-background materials: kapton and copper for the readout and plexiglas and aluminium for the chamber.
The data acquisition system registers the analogue signal induced in the mesh at each event with a 1 GHz FADC and the integrated charge on each strip using four Gassiplex cards. Several analysis parameters are extracted like the cluster size, multiplicity and width from the strips data and the risetime, width, amplitude and integral from the mesh pulses. An X-ray of less than 10 keV produces a primary ionization localized in a range less than 1 mm. The amplification of this charge gives a narrow pulse with a fixed risetime and a mean strip multiplicity which corresponds to around 5 mm. Cosmic muons and high energy gammas produce a spatially extended ionization, resulting to broader pulses and higher multiplicities.
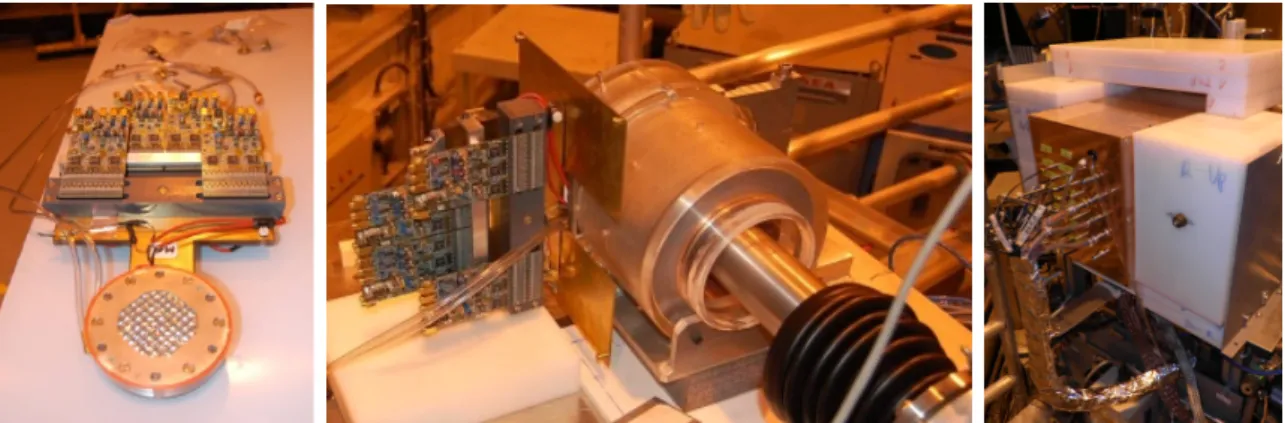
Figure 1. Left: The Micromegas detector used in CAST. The active area is situated at the
front part and is covered with a stainless steel window and a plexiglass piece. The strips are read by four Gassiplex cards situated at the rear part. Center: The circular lead shielding that surrounds the readout and the stainless steel tube that comes out from the magnet bore. Right: The Faraday cage and the external polyethylene shielding that covers the lead shielding. The electrical signals and the gas tubes are extracted from the copper box via feedthroughs.
The raw trigger rate of Micromegas detectors in CAST is around 1 Hz. Most of the
background events like muons are rejected in the offline analysis with a discrimination algorithm, which keeps only events compatible with X-rays. As shown in figure 2 (left), the background level is reduced at least by one order of magnitude for all energies, while keeping an 80% of 6 keV X-rays from the iron source in the calibration runs. An example of the background level in CAST is shown in figure 2 (right). The remaining spectrum consists mainly in three peaks at 3, 6 and 8 keV, generated by the fluorescence lines of the Micromegas’ copper and the stainless steel of the window and the tube coming from the magnet bore.
Total Energy [keV]
0 2 4 6 8 10 12 14 16 18 20 ] -1 keV -2 cm -1 dN/dE [s -6 10 -5 10 -4 10 -3 10
Figure 2. Left: Background energy spectrum of a CAST Micromegas detector shielded with 5
cm of lead. The black line considers all the events acquired and the blue one only those selected by the discrimination algorithms. Right: Evolution of the background energy spectra of CAST in 2008 after the application of the selection parameters. The four spectra correspond to data before the shield closing (blue line), just after (red line), one week later (green line) and two weeks later (black line).
November and the background level returned to the initial values. This increase coincidenced in time with an interruption of the nitrogen flush inside the shielding. Later the background level
decreased again and reached a value of 2× 10⁻⁷ s−1 keV−1 cm−2, which remained stable until
the 27th of November, when a series of power cuts caused the end of the run.
The daily calibrations with the iron source showed that the detector response to the 6
keV X-rays remained unchanged, even if they were taken at random times. However, the
parameters of background events changed along time, increasing the rejection power factor of the algorithms. This change was independent of the energy and as a consequence, the shape of the final background energy spectrum remained stable but it scaled down along time. This effect is shown in figure 2 (right). Note that no increase in the acquisition deadtime was observed and the raw trigger rate remained stable in 0.7 Hz during all days.
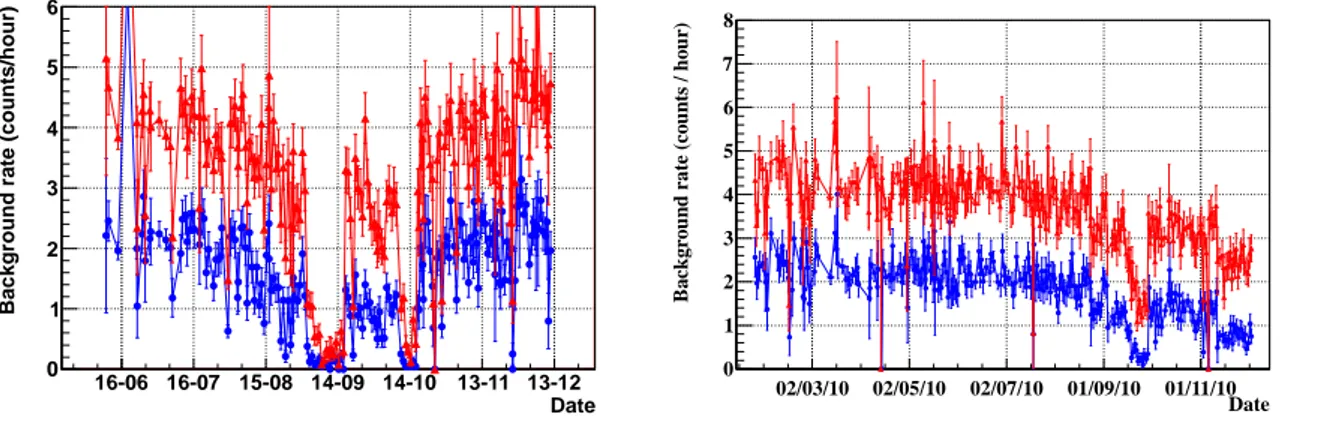
As shown in figure 3, three more ultralow background periods have been observed during the years 2009 and 2010. All of them occurred during September and October, which could indicate an environmental variation of background events. In all cases, the intensity of the three lines at
3, 6 and 8 keV drastically reduced one order of magnitude from the mean value of 6× 10⁻⁶ s−1
keV−1 cm−2. The environmental conditions (radon, humidity, temperature and air pressure)
near the sunrise line are being monitored since October 2009. However, no clear correlation between radon and the ultralow background periods has been observed until now.
Date
16-06 16-07 15-08 14-09 14-10 13-11 13-12
Background rate (counts/hour)
0 1 2 3 4 5 6 Date 02/03/10 02/05/10 02/07/10 01/09/10 01/11/10 B a ck g ro u n d r a te ( co u n ts / h o u r) 0 1 2 3 4 5 6 7 8
Figure 3. Background rate in the sunrise detector of CAST after the application of the selection
parameters during 2009 (left) and 2010 (right) in the range of energies between 2 and 7 keV (blue circled line) and between 2 and 10 keV (red triangled line).
4. A Micromegas CAST-like detector at the LSC
A Micromegas CAST-like detector has been installed at the Canfranc Underground Laboratory with two main objectives: the determination of the ultimate background level of this kind of readouts and the clarification of the ultralow background periods observed at the CAST experiment. The detector tested is the M10, which took data in CAST only during some weeks.
The readout has been characterized with an iron source in argon-isobutane mixtures of 2.3 and
5.0%, reaching gains up to 2× 10⁴ and showing an energy resolution of 13.5% FWHM at 5.9
keV in Ar-5%iC4H10.
As shown in figure 4 (left), the new setup reproduces the shielding of the sunrise detector. It consists in a 5 mm-thick copper layer, surrounded by a 25 mm-thick lead layer and all materials inside a Faraday copper box. This box is prepared for automatic calibrations with an iron source and is also gas-tight because all the gas and electrical connections are extracted via feedthroughs. These features assure a good radon extraction with a nitrogen flow of 30 l/h. The setup also includes a slow control which continuosly monitors the temperature, the gas pressure and the current of the detector.
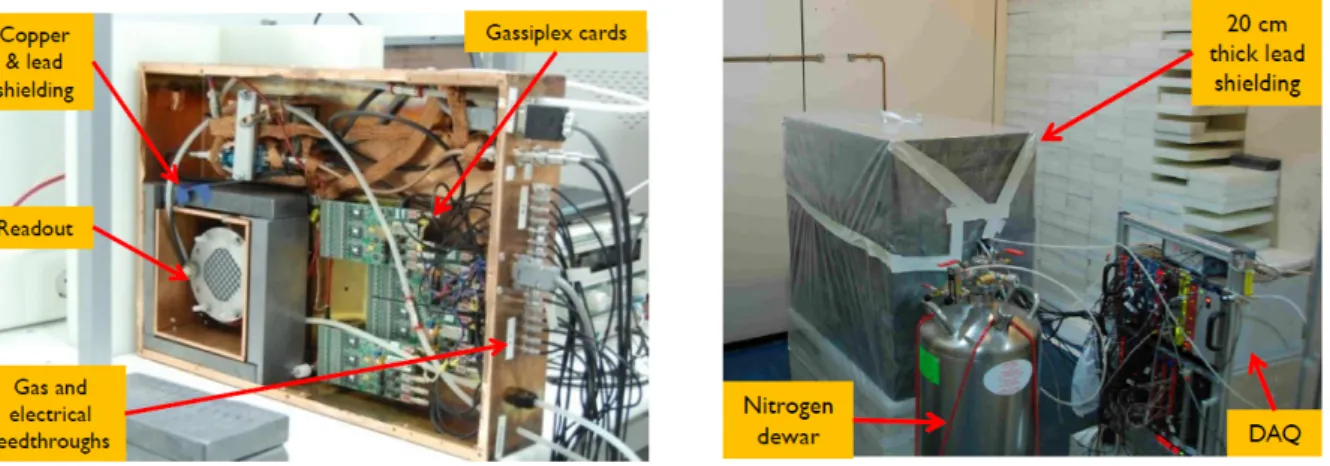
Figure 4. Left: A view of the setup installed in Canfranc. The M10 detector is shielded with
a 5 mm-thick copper layer and a 25 mm-thick lead layer. The readout and the shielding are situated inside a copper Faraday cage and all the gas and electrical connections are extracted via feedthroughs. Right: The previous setup installed inside a 20 cm-thick lead castle, wrapped in a plastic bag at the Canfranc Underground Laboratory. A constant flux of nitrogen keeps the inside atmosphere clean of radon.
During the background tests in Canfranc, an external 20 cm-thick lead shielding (shown in figure 4, right) has been added around the setup to determinate the ultimate background level. This update has reduced the mean raw rate from 0.2 Hz to 0.01 Hz, but also the background rejection power due to the fewer number of external events detected. The preliminary result
between 2 and 10 keV is 1.0±0.5×10⁻⁶s−1 keV−1cm−2, which is almost one order of magnitude
better than in CAST. Other shielding configurations have been tested in order to check their effect in the background level and the final conclusions of this work are expected soon.
5. A new Micromegas detector for CAST
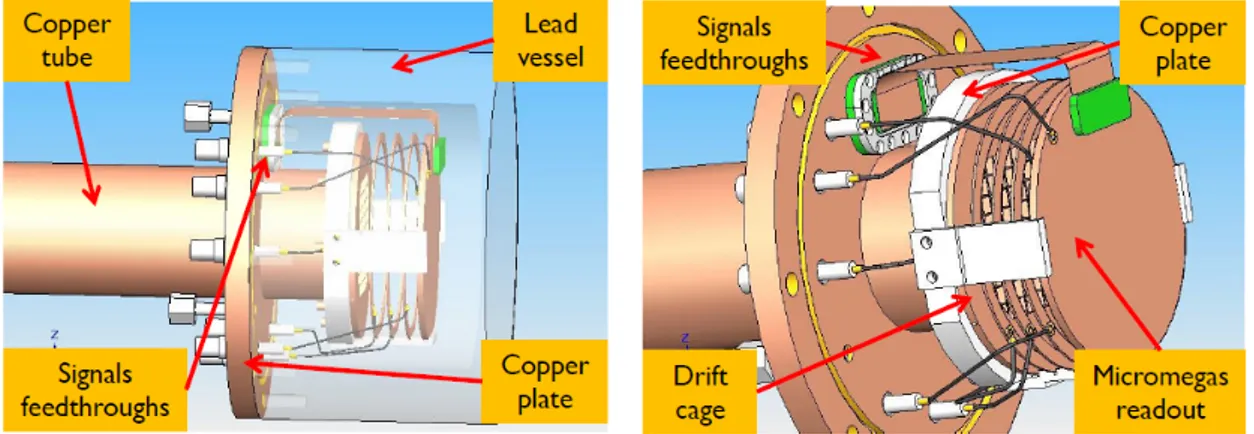
A new Micromegas detector is being designed with improved features and will be installed at the sunrise line in CAST in 2011. Two views of the actual design are shown in figure 5. Althought the final setup will also include the conclusions of Canfranc tests, the actual design supposes two main background sources in the actual detector: the radon which diffuses inside the shielding and the materials situated near the readout.
The lead shielding of the actual setup will be replaced by a lead gas-tight vessel, which will contain the argon-isobutane mixture and will conserve the shielding power. The inner vessel, composed of two pieces of stainless steel and plexiglass, will be replaced by a drift cage of
Figure 5. Two views of the new design of the sunrise Micromegas detector to be installed in
CAST in 2011, designed by J.P. Mols. A detailed description of the setup is made in text.
copper and peek. In this way, a uniform drift field will be guaranteed and there will be less and cleaner material near the readout. Finally, strips will be digitized by the T2K electronics. This new acquisition system will make the detector a real TPC, which will increase the background reduction.
6. Conclusions and outlook
During 8 years of operation in CAST, Micromegas detectors have shown a low and stable background level due to their low radioactive materials, good energy resolution and spatial resolution. Since 2008, four ultralow background periods have been observed with the new
microbulk detectors. During these periods, the background level reduced one order of magnitude,
reaching a value around 10−7 s−1 keV−1 cm−2. The energy spectrum after the application of
the selection parameters shows three clear peaks at 3, 6 and 8 keV, caused by the fluorescence of near materials. The intensity variation of these lines could be correlated to variations of radon gas inside the shielding. Since October 2009, the radon is being monitored in CAST but no clear correlation with the ultralow background periods has been observed until now.
To clarify the origin of these periods and to determine the ultimate background level of these readouts, a CAST-like detector has been installed at the Canfranc Underground Laboratory. The actual level is compatible with the one measured in CAST. A new Micromegas detectors is being developped for working in CAST experiment during 2011, based on the conclusions of this work.
References
[1] R. Peccei, H. Quinn, Phys. Rev. Letters 38 (1977) 1440.
[2] S. Weinberg, Phys. Rev. Letters 40 (1978) 223; F. Wilczek, Phys. Rev. Letters 40 (1978) 279.
[3] H. Primakoff, Phys. Rev. Letters 81 (1951) 899; P. Sikivie, Phys. Rev. Letters 51 (1983) 1415 (Erratum ibid. 52 (1984) 695).
[4] K. van Bibber et al., Phys. Rev. Letters 59 (1987) 759.
[5] K. Zioutas et al., Phys. Rev. Letters 94 (2005) 121301; S. Andriamonje et al., JCAP 4 (2007) 010. [6] P. Abbon et al., NJP 9 (2007) 170.
[7] D. Autiero et al., NJP 9 (2007) 171. [8] M. Kuster, NJP 9 (2007) 169. [9] E. Arik et al., JCAP 02 (2009) 008.
[10] F.J. Iguaz et al., Proceedings of the conference IDM 2010, Montpellier (France).
[11] P. Baron et al., IEEE Nucl. Sci. Symp. Conf. Rec. 55 (2008) 1744; D. Calvet et al., 16th IEEE NPSS real
time conference, 2009, Beijing (China).
[12] T. Papaevangelou et al., J. Phys. Conf. Ser. 179 (2009) 012015. [13] T. Papaevangelou et al., JINST 5 (2010) P02001.