SAKARYA UNIVERSITY JOURNAL OF SCIENCE
e-ISSN: 2147-835X
http://www.saujs.sakarya.edu.tr
Received Revised Accepted DOI
09.02.2017 02.07.2018 15.09.2017 10.16984/saufenbilder.290944
A new tool for prediction of phase transitions in liquid crystals
Murat Beken*1ABSTRACT
In this article, fundamental analysis of C37H59NO2, C37H59NO3, and C41H67NO2 from among liquid crystals is conducted via Differential Thermal Analysis (DTA) device in high pressure environment. Phase transition temperature, entalphy, and entrophy of these liquid crystals are observed. In addition, an Artificial Neural Network (ANN), which is a method of Artificial Intelligence, is modeled. Then, output values of ANN model and DTA device are compared, and correlation between them is demonstrated. For the values which are not measured with DTA device, outputs are produced by ANN model. In this article, three layered feed-forward back propagation ANN model is used. With this approach, it is proved that, ANN is a resourceful method for prediction in studies conducted about phase transition.
Keywords: Differential Thermal analyse (DTA), Artificial Neural Network (ANN), Critical Point,
Enthalpy, Liquid
1. INTRODUCTION
Materials have different physical properties like mechanical, electrical, magnetic and optical, in different phases and material science requires a wide knowledge of the phase transitions of elements. Background thermodynamic studies provide significant tools for material processing [1]. Experimental studies about thermal analysis, which were developed more than two centuries ago, can give information on phase transformations and phase diagrams. Nowadays, Differential Thermal Analysis technique (DTA) is a widespread and well-known method for thermodynamic investigations [1].
DTA is a method, which is based on recording the temperature difference (∆T) [2-4].Changes in the sample, which lead to the absorption or evolution of heat can be determined relating to the inert reference. The peaks, which are obtained from
* Corresponding Author
1 Beykent Üniversitesi, Elektrik-Elektronik Mühendislik Bölümü, İstanbul, Türkiye – [email protected]
DTA curves, give information whether the reaction is endothermic or exothermic. Furthermore, solid state reactions and active gas reactions can be obtained by virtue of DTA peaks. Some studies on analysing the materials under high pressure take place in the literature. Tammann has analysed various materials under high pressure by recording the discontinuity in the volume at the tansition [5-6]. In addition, similar studies have been performed by Kaufman and Stone [7-8]. However, it is difficult to provide high-pressure conditions to observe the materials and to make inquiries about phase transitions. In the present work, DTA method was correlated with artificial neural network model, which was developed in the field of biological neural networks. Using computer controlled high-pressure DTA device, the critical points and the change of enthalpy were measured under different high pressure values for C37H59NO2, C37H59NO3 and C41H67NO2 [9].
Artificial neural networks (ANN) were developed based on the principles of the work of the human brain. ANN has many important features ANNs typically gather their knowledge by detecting the patterns and relationships in data and learn (or are trained) through experience, not from programming. An ANN is formed from hundreds of single units, artificial neurons or processing elements (PE), connected with coefficients (weights), which underlie the neural structure and are organised in layers [10]. The history of neural networks started by taking interest in neurobiology. However, the field of ANN studies has gone through many phases during the development process. The preparatory work on ANNs, which was made by Mc Culloch and Pitts, started with modelling the basic functions of a biological neuron as a threshold device [11]. Computational stencils based on the ordinary neural network model were offered by Frank Rosenblatt in 1950 [12]. In 1960s, Widrow and Hoff used simple neural models to study the first adaptive systems [13]. However, Minsky and Papert propounded some formidable impediments about artificial neural networks and geared down the studiesof ANNs in 1969 [14]. After Hopfield published the study, "Neural Networks and PhysicalSystems" in 1982, studies in the field of ANN got back on the rails and modern ANN period began. Currently, ANNs are being used for a wide variety of tasks in many different fieldsof business, industry and science [15]. In addition, there is a study about observing phase behavior of liquid crystals via artificial neural network model [16].
When it is difficult to construct the algorithm, ANN make possible to produce well-qualified results quicker than the classical computing methods can do. The literature is vast and growing. There are various types of studies about application of artificial neural networks in the literature. For instance, a lot of studies can be seen in the field of high energy particle and statistical physics. A part of these studies are concerned about determining the kinetic parameters or thermal properties [16-17]. However, in our study liquid crystals were observed via differential thermal analysis and then the experimental data were simulated with ANN model. Thus, it was intended to show that ANN can be a powerful tool for the prediction of thermal parameters.
2. METHOD 2.1. Differential thermal analysis
Differential thermal analysis (DTA) is a technique, which is based on recording the temperature difference between a sample and reference material by using a set of thermocouples. The reason of this temperature difference is the phase modulation of the sample material. Observed temperature difference (T) is plotted against the time or the temperature. So, DTA device is calibrated by using standards with known temperatures of phase transitions. However, the most important point is choosing the reference material. Because the phase of reference material should never change in the operating range of DTA to obtain correct data and record the temperature difference. Using DTA method, one can measure all reactions and processes that involve energy exchange during heating or cooling of a sample. Also, one can obtain information about whether the reaction is endothermic due to the dehydration, dehydroxylation, structural decomposition and transformation, magnetic changes, melting, or evaporation and sublimation, or exothermic; due to the oxidation/burning of organic matter, iron oxidation, or crystalization of amorphous material [4].
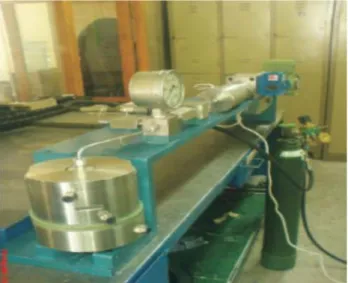
Fig 1. High Pressure Differential Thermal Analysis Device
2.2. Structure of DTAThe computer-controlled
Differential Thermal Analysis device (see Fig. 1), which is used for the observation of phase transitions in this work, is composed of three main parts [18].
2.2.1. Heat control unit/ Data processing unit
Heating unit serves to heat the body of DTA in a controlled way and to fix the heating rate depending on the sample material. However, data processing unit is as important as heating unit. For this reason, data processing unit should have appropiate structure for recording the temperature of reference and sample material transiently and correctly. In this work, a control panel, which includes heating control unit and data processing unit, was built. A datalogger was used for double function; one of them to control the heating against time. The other function of the datalogger is to monitor the temperature. For this reason, NiCr-Ni thermocouples (type K) with 1 mm diameter, are used for the temperature measurement. For temperature calibration, it was considered that the melting point of Indium was 154.80C [19]. It has been assumed that the dependence of the emf on temperature was linear.
After the determination of the melting point of indium was repeated, it was seen that the standart deviation was 0:5 K.
Indium (154.80C) Benzoic Acid (122.60C)
However, both of these functions were implemented by using a graphical programming language (GPL). In this work, a control system, which is based on on-off mechanism, was developed using this GPL. So, the temperature increase of the reference material can be made linear. The most important point is to insure this temperature increase to be linear for observing the change of energy in the specific time interval.
2.2.2. Pressure Unit
The DTA pressure unit consists of a couple of pistons and a valve of inert nitrogen gas. Also, high pressure is obtained by using hydraulics pressing pump. So, the different diameters of the pistons with constant pressure force, can provide different pressure values in two different pressure rooms.
2.3. Artificial Neural Networks Model
ANNs are mathematical systems that mimic the way in which the human brain works [20]. A neural network is a collection of interconnecting computational elements simulated like neurons in biological systems. The development of ANN is based on basic of computational stencils [12]. The
first work on neural networks was done by Frank Rosenblatt in the late 1950's and early 1960's. At the same time, Bernard Widrow and Ted Hoff studied at first adaptive systems by using the simple neural models and improved a new learning mechanism [21]. However, Minsky and Papert propounded some formidable impediments about artificial neural networks and decelerated the studies of ANN in 1969 [14]. After J.J. Hopfield had published the study, which was named as "Neural Networks and Physical Systems", theoryof ANN got back on the rails and modern artificial neural networks period started [22]. Duringthe past 15 years, there has been a substantial increase in the interest on ANNs studies.
Scientists improved artificial neural networks, based on the ability of apprehending difficult and complex samples of the brain [17]. ANNs learn from the data, which are related tothe problem under study. In other words, system is trained by experience with appropriate learning examples without programming. Briey, neural networks gather their knowledgeby detecting the patterns and relationships in data [10].
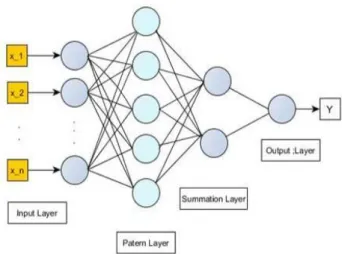
A neuron consists of several layers of nodes. The frst or the lowest layer is called as the input layer, where external information is received. The last or the highest layer is called as the output layer, where the problem solution is obtained. The input and output layers areseparated by one or more layers, which are called as the hidden layers. The use of a hiddenlayer makes possible to describe nonlinear systems [15]. Each input element has a weight factorof the function that determines the strength of the interconnection and thus the contributionof that interconnection to the following neurons
A lot of learning rules have been developed in the process of development of ANNs. However, one of the most often used and succesful learning rules is the feedforward back-propagation rule. In this learning rule, the network reads the input and output values in the training data set and changes the value of the weighted links to reduce the difference between the predicted and target values. The error is minimized by changing the number of iterations, the momentum and the learning rate until the network reaches a specified level of accuracy. However, the remarkable point is not to train the system too long. Because, if a network is trained very much, it will overtrain and memorise
the training data. So the system will lose the ability to generalize [10]
Fig 2. General structure of an ANN model
In this work, feedforward backpropagation rule was used and experimental data were trained by using a supervised learning algorithm. For this reason, we will focus more on feedforward networks in this study.
3. EXPERIMENTAL 3.1. Samples and Thermal Properties
Thermal decomposition of liquid crystals (C37H59NO2, C37H59NO3 and C41H67NO2) were analyzed by DTA device, which was calibrated by using indium and benzoic acid. Calibration of the DTA device was made in order to obtain correct data from the system. Obtained DTA curve peak areas were used for calculating the calibration constant, which is necessary for calculating the enthalpy values. The calibration constant (Z) was determined as . The enthalpy values could be calculated by:
= ∆ . . / (1)
Heating rates were fixed as 6-9 deg/min and the HP-DTA measurements were performed by using 2-9 mg samples in the most of the HP-DTA scans. Thermal behaviors of C37H59NO2, C37H59NO3 and C41H67NO2 were examined between 1 and 300 atm gas pressure by using HP-DTA apparatus. The sample, which was covered by an aluminum holder, was fixed onto a NiCr-Ni thermocouple (type K). Also, a copper-constantan thermocouple (type T) was used for reading the temperature of the reference material.
3.2. Liquid Crystals
The history of liquid crystals dates back to the 1850s. However, the importance of liquid crystals were realized more than 100 years after 1850s. In the early last century, George Friedel did many experiments about liquid crystals. In 1922, Friedel classifed the liquid crystals by handling different molecule orders. In the same period, Oseen ve Zcher developed some mathematical models to demonstrate the liquid crystals. In 1988, F. Reinitzer, an Austrian botanist, discovered unusual behaviour of an organic compound (cholesteryl benzoate). When he heated the substance, he observed that it melted at 145 0C to form a milky liquid and became clear at 179 0C. This was marked as the discovery of a very useful class of compounds known as liquid crystals. However, extensive researches about liquid crystals were done by developing "liquid crystal display" in 1968. Since then, there has been an interest in correlating molecular structure with liquid crystals.
Liquid crystals (LC) are generally defined as the special condition of the substance by the virtue of being a phase of matter whose symmetric and mechanical properties are intermediate between those of a crystaline solid and an isotropic liquid [23]. Liquids crystals have both of the liquids' and solids' characteristics. For this reason, they are named as mesophases. In other words, they have ordered structure like liquids. Because of having ordered structure and liquid property, LCs can be called as anisotropic.
Liquid crystals are divided into several types according to their molecular structures; calamitic, discotic and lath-like. Calamitic liquid crystals are composed of rod-like molecules and ordered structure in the direction of the longer axes of the molecules. The liquid crystals formed from diskshape molecules are known as discotic liquid crystals. Intermediate between rod-like and disk-like molecules are the lath-disk-like species. Transitions to the mesophases may be brought about in two different ways; one by purely thermal processes which are named as thermotropics and the other by the inuence of solvents, which are named as lyotropics. The properties of liquid crystals can be investigated with several techniques like Fourier Transform Infrared spectroscopy (FTIR), Solid-State Nuclear Magnetic Resonance (SS-NMR) Spectroscopy, Neutron and Light Scattering, Dynamic Mechanical Analysis (DMA) or Dielectric
Spectroscopy and Differential Scanning Calorimetry (DSC). In this study, Differential Thermal Analysis technique was used for observing phase transition temperaturesand enthalpies of C37H59NO2, C37H59NO3 and C41H67NO2
4. ANN RESULTS
In this work, three-layered Multilayer Perceptron (MLP) feedforward neural network architecture was used and trained with the error back propagation algorithm. The back propagation algorithm is used to search for weights and bias values that generate neural network outputs that most closely match the output values in the training data. Training with back-propagation is an iterative process. In this neural network architecture each layer is fully connected to the previous layer, and has no other connection
4.1. C37H59NO2
In the first training processing of C37H59NO2, train sets were made of the experimental data under 1,5, 80, 100, 160, 200, 300 atm pressures. As can be
seen from Table I. Also, sigmoid activation function was used to produce output values, which are associated with input values. Then to good results input and output values which uses as the training set were normalized, thereby converting real numbers between 0 and 1. Test were made by changing iteration for different momentum and learning rates between 0 and 1. Hidden layer number was chosen as 1 and its neurons were chosen as 4. The system has been activated for different iterations values between 100 and 1000 until the obtain the smallest error. As can be seen from Fig. 3-a, minimum error rate was obtained when the learning rate 0.9 and momentum rate had reached to 0.1 and iteration 1000. In this case, 0.004 percent error was observed.
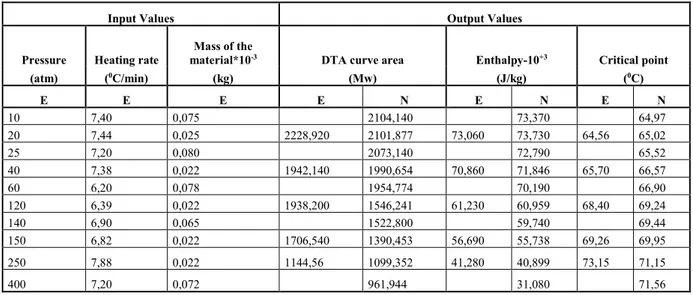
At the next step, test sets were composed of the experimental data, which have not been used for training the network for checking the achieved predictive ability of ANN. As can be seen from Table II, the measurements under 20, 40, 120, 150 and 250 atm pressure were chosen as test sets. Test results with the experimental results were evaluated consiste
Table I. The outputs of the training data and the experimental data for C37H59NO2
Input Values Output Values
Pressure Heating
rate Mass of the material*10
-3 DTA curve area Enthalpy-10+3 Critical point
(atm) (0C/min) (kg) (Mw) (J/kg) (0C) E E E E N E N E N 1,000 7,150 0,058 7002,730 6623,537 95,590 94,235 75,2000 75,899 5,000 7,260 0,056 6594,300 6493,593 95,300 93,758 76,9100 76,736 10,000 7,120 0,057 6581,920 6538,740 93,190 93,645 77,6600 77,445 80,000 7,560 0,055 5000,660 5325,810 76,120 74,594 86,9000 86,069 160,000 6,020 0,080 7218,010 6614,629 60,150 61,293 88,6000 89,584 200,000 4,180 0,070 6319,490 6574,036 41,790 40,999 90,0000 90,458 300,000 7,560 0,064 5113,940 5091,927 23,060 23,659 90,0000 90,431
Table II. The outputs of the test data and the experimental data for C37H59NO2
Input Values Output Values
Pressure Heating rate
Mass of the
material*10-3 DTA curve area Enthalpy-10+3 Critical point
(atm) (0C/min) (kg) (Mw) (J/kg) (0C) E E E E N E N E N 10 7,40 0,075 2104,140 73,370 64,97 20 7,44 0,025 2228,920 2101,877 73,060 73,730 64,56 65,02 25 7,20 0,080 2073,140 72,790 65,52 40 7,38 0,022 1942,140 1990,654 70,860 71,846 65,70 66,57 60 6,20 0,078 1954,774 70,190 66,90 120 6,39 0,022 1938,200 1546,241 61,230 60,959 68,40 69,24 140 6,90 0,065 1522,800 59,740 69,44 150 6,82 0,022 1706,540 1390,453 56,690 55,738 69,26 69,95 250 7,88 0,022 1144,56 1099,352 41,280 40,899 73,15 71,15 400 7,20 0,072 961,944 31,080 71,56
4.2. C37H59NO3
The same instructions were actualized for C37H59NO3. In every phase, two of the three parameters (the momentum rate, learning rate, and iteration number) were kept constant alternately and it was observed how the other parameters affected the system. For training processing of C37H59NO2, train sets were made of the experimental data under 1, 5, 10, 80, 160, 200, 300 atm pressure. Then, momentum and learning coeffcients was changed between 0 and 1, and the number of iterations was chosen as 100, 200, 300, 400, 500, 600, 700, 800, 900, 1000 For every
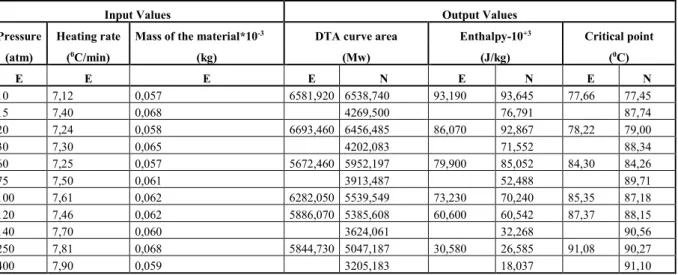
learning rate, the outputs of the neural network were recorded. It was seen that the minimum error rate 0,008 was obtained when the learning rate 0.7 and momentum rate had reached to 0.3 and iteration 800. the learning rate 0.008 error. Results can be seen from Table III Then test sets were the experimental data under 20, 60, 100, 120,250 atm pressure for checking whether the network created satisfactory results at the end of simulation. It was observed that the system reproduced the approximate values to the experimental data although these input values had not been used for training the network(see Table IV)
Table III. The outputs of the training data and the experimental data for C37H59NO3
Input Values Output Values
Pressure Heating
rate Mass of the material*10
-3 DTA curve area Enthalpy-10+3 Critical point
(atm) (0C/min) (kg) (Mw) (J/kg) (0C) E E E E N E N E N 1,000 7,150 0,058 7002,730 6623,537 95,590 94,235 75,2000 75,899 5,000 7,260 0,056 6594,300 6493,593 95,300 93,758 76,9100 76,736 10,000 7,120 0,057 6581,920 6538,740 93,190 93,645 77,6600 77,445 80,000 7,560 0,055 5000,660 5325,810 76,120 74,594 86,9000 86,069 160,000 6,020 0,080 7218,010 6614,629 60,150 61,293 88,6000 89,584 200,000 4,180 0,070 6319,490 6574,036 41,790 40,999 90,0000 90,458 300,000 7,560 0,064 5113,940 5091,927 23,060 23,659 90,0000 90,431
Table IV. The outputs of the test data and the experimental data for C37H59NO3
Input Values Output Values
Pressure Heating rate Mass of the material*10-3 DTA curve area Enthalpy-10+3 Critical point
(atm) (0C/min) (kg) (Mw) (J/kg) (0C) E E E E N E N E N 10 7,12 0,057 6581,920 6538,740 93,190 93,645 77,66 77,45 15 7,40 0,068 4269,500 76,791 87,74 20 7,24 0,058 6693,460 6456,485 86,070 92,867 78,22 79,00 30 7,30 0,065 4202,083 71,552 88,34 60 7,25 0,057 5672,460 5952,197 79,900 85,052 84,30 84,26 75 7,50 0,061 3913,487 52,488 89,71 100 7,61 0,062 6282,050 5539,549 73,230 70,240 85,35 87,18 120 7,46 0,062 5886,070 5385,608 60,600 60,542 87,37 88,15 140 7,70 0,060 3624,061 32,268 90,56 250 7,81 0,068 5844,730 5047,187 30,580 26,585 91,08 90,27 400 7,90 0,059 3205,183 18,037 91,10 4.3. C41H67NO2
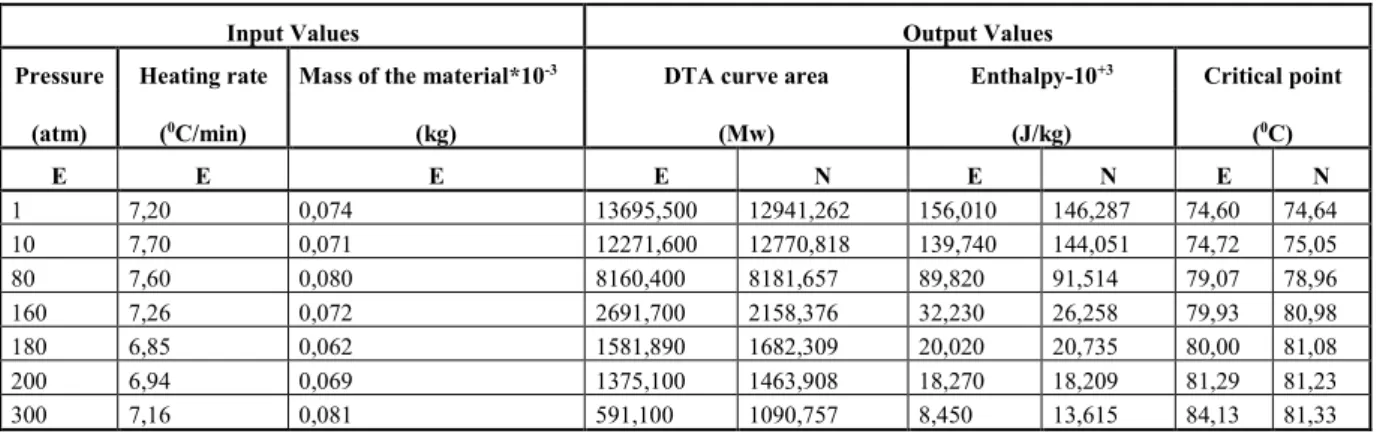
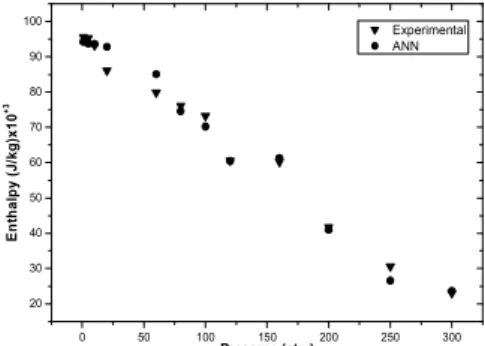
Lastly, C41H67NO2 was observed and DTA curve area, the critical points and the changeof the enthalpy values were obtained by using DTA. There were a total data sets that weredivided into two groups for training and testing. Training sets containing experimentaldata consisting of 1, 10, 80, 160, 180, 200, 300 atm under pressure. Testing setcontaining experimental data consisting of 1, 10, 80, 160, 180, 200, 300 atm under pressure
Then, learning rate and momentum rate was selected between 0 and 1. The program was instructed to run for between 100 and 1000 iterations. It was observed that it was enoughto select the maximum number of iteration as 900 to reach the target values 0,005 when the learning rate 0.5 and momentum rate had reached to 0.5 (see TableV).
For the validation, test sets were the experimental data which had not been used fortraining the network for checking whether the network created
satisfactory results at theend of simulation. It was observed that the system reproduced the approximate values to the experimental data although these input values had not been used for training the network (see Table VI).
This study deals with the prediction of the critical points and the change of enthalpy of liquid crystals (C37H59NO2, C37H59NO3 and C41H67NO2) via artificial neural networks. An ANN training set was trained for predicting the DTA curve area, the critical points and the change of enthalpy. Besides training, test sets were composed of the
experimental data, which were not involved in the training process at all. Obtained output values andexperimental data were compared each other. In Figs. 3 and 4, the curves of experimentalvalues and output values show the relation between P(atm)-T (0C), for C37H59NO2, Figs. 5 and 6 show the relation between P(atm)-T (0C/min), for C37H59NO3 and Figs. 7 and 8 show the relation between P(atm)-T (0C),for C41H67NO2. Comparisons have proven that ANN’s offer a promising alternative approach due to its nonlinear structure.
Table V. The outputs of the training data and the experimental data for C41H67NO2
Input Values Output Values
Pressure Heating rate Mass of the material*10-3 DTA curve area Enthalpy-10+3 Critical point
(atm) (0C/min) (kg) (Mw) (J/kg) (0C) E E E E N E N E N 1 7,20 0,074 13695,500 12941,262 156,010 146,287 74,60 74,64 10 7,70 0,071 12271,600 12770,818 139,740 144,051 74,72 75,05 80 7,60 0,080 8160,400 8181,657 89,820 91,514 79,07 78,96 160 7,26 0,072 2691,700 2158,376 32,230 26,258 79,93 80,98 180 6,85 0,062 1581,890 1682,309 20,020 20,735 80,00 81,08 200 6,94 0,069 1375,100 1463,908 18,270 18,209 81,29 81,23 300 7,16 0,081 591,100 1090,757 8,450 13,615 84,13 81,33
Table VI. The outputs of the test data and the experimental data for C41H67NO2
Input Values Output Values
Pressure Heating rate Mass of the material*10-3 DTA curve area Enthalpy-10+3 Critical point
(atm) (0C/min) (kg) (Mw) (J/kg) (0C) E E E E N E N E N 5 7,30 0,075 12361,286 138,681 72,43 20 7,15 0,071 11114,200 11150,229 127,780 138,665 75,19 75,71 25 7,50 0,080 11844,987 132,264 73,09 50 7,70 0,082 11539,630 10733,121 123,000 122,777 78,60 77,52 60 7,60 0,078 10506,240 116,378 74,41 100 7,15 0,093 5323,090 5872,675 67,300 76,502 79,80 80,08 120 7,80 0,086 6207,600 4978,248 57,050 56,052 79,89 80,31 140 6,90 0,065 5639,836 63,089 77,78 250 7,02 0,074 865,900 1042,771 11,950 12,965 82,08 81,67 400 7,20 0,072 895,261 11,541 81,58 0 50 100 150 200 250 300 62 64 66 68 70 72 74 76 C ri ti c a l p o in t ( 0C ) Pressure (atm) Experimental ANN
Fig 3. The correlation between P(atm) and T(0C) of
C37H59NO2 according to experimental and neural network
values 0 50 100 150 200 250 300 30 40 50 60 70 80 E n th a lp y ( J /k g )x 1 0 + 3 Pressure (atm) Experimental ANN
Fig 4. The correlation between P(atm) and Enthalpy of C37H59NO2 according to experimental and neural network
0 50 100 150 200 250 300 74 76 78 80 82 84 86 88 90 92 C ri ti c a l p o in t ( 0C ) Pressure (atm) Experimental ANN
Fig 5. The correlation between P(atm) and T(0C) of
C37H59NO3 according to experimental and neural network
values 0 50 100 150 200 250 300 20 30 40 50 60 70 80 90 100 Experimental ANN E n th a lp y ( J /k g )x 1 0 + 3 Pressure (atm)
Fig 6. The correlation between P(atm) and Enthalpy of C37H59NO3 according to experimental and neural network
values 0 50 100 150 200 250 300 74 76 78 80 82 84 Experimental ANN C ri ti c a l p o in t ( 0C ) Pressure (atm)
Fig 7. The correlation between P(atm) and T(0C) of
C41H67NO3 according to experimental and neural network
values 0 50 100 150 200 250 300 0 20 40 60 80 100 120 140 160 Experimental ANN E n th a lp y ( J /k g )x 1 0 + 3 Pressure (atm)
Fig 8. The correlation between P(atm) and T(0C) of C41H67NO3 according to experimental and
neural network values
5. CONCLUSION
In a simpler way, this study shows that a good training neural network system makes possible obtaining very good reproducibility of DTA experimental data and enables to accelerate the experimental studies. Furthermore, it is important to decide the most appropriate learning algorithm, momentum rate, learning rate and determine the number of correct iteration number for avoiding the overtraining of the neural network.
ACKNOWLEDGMENTS
The author wishes to thank Dr. Reha Basaran for the support of experimental Studies, Fatma Kosovali for neural network studies and Prof. Dr. Belkis Bilgi for providing the liquid crystals.
REFERENCES
[1] N. Clayton, N. Musolino, E. Giannini, V. Garnier, and R. Flükiger, «New Apparatus for DTA at 2000 bar: Thermodynamic Studies on Au, Ag, Al and HTSC Oxides”, Supercond. Sci. Technology,» Supercond. Sci. Technology, cilt 17, no. 3, pp. 395-406, 2004.
[2] A. Langier-Kuzniarowa, «Standardization in Thermal Analysis,» J. Therm. Anal. Calorimetry, cilt 24, p. 913, 1984.
[3] S. Yariv, «The Role of Charcoal on DTA Curves of Organo-Clay Complexes: an Overview,» Applied Clay Science, cilt 29, pp. 225-236, 2004.
[4] Alain F Plante, José M Fernández, J Leifeld, «Application of Thermal Analysis Techniques in Soil Science,» Geoderma, cilt 153, no. 1-2, pp. 1-10, 2009.
[5] G. Tammann, Z.S. Phys. Chem, cilt 20, p. 743, 1912.
[6] P.W.Bridgman, Phys.Review3, p. 126, 1914.
[7] R. L. Stone, «Differential Thermal Analysis by The Dynamic Gas Technique,» Anal.
Chem., cilt 32, p. 1582, 1960.
[8] L. Kaufman, Material Science and Engineering Series, New York: McGraw-Hill, 1963.
[9] M. Beken, «The Neural Network and Multivariate Linear Regression Approach for Observing Phase Transitions of Polymers With The Differential Thermal Analysis Method,» J.
Therm. Anal. Calorimetry, cilt 101, no. 1, pp.
339-347, 2010.
[10] S. Agatonovic-Kustrin and R. Beresford, «Basic Concepts of Artificial Neural Network (ANN) Modeling and Its Application in Pharmaceutical Research,» Jour. Of Pharm. Biol.
Anal. , cilt 22, pp. 717-727, 2000.
[11] M. Culloch and W. Pitts, «A Logical Calculus Of The Idea Immanent In Nervous Activity,» Bulletin of Math. W. S. Biophys., cilt 5, pp. 115-133, 1943.
[12] O. Maimon and L. Rokach, Data Mining and Knowledge Discovery Handbook, Springer, 2005.
[13] Kotfica, E. Tomaszewicz and M., «Application of Neural Networks in Analysis of Thermal Decomposition of CoSO4·7H2O,» J.
Therm. Anal. Calorimetry, cilt 74, p. 583, 2003.
[14] G. Zhang, B.E. Patuwo, M.Y. Hu, «Forecasting with Artificial Neural Networks: The State of the Art,» Inter. Journal of Forecasting, cilt 15, no. 1998, pp. 35-62, 1998.
[15] R. C. O. Sebastiao, J. P. Braga, and M. I. Yoshida, «Competition Between Kinetic Models in Thermal Decomposition: Analysis by Artificial Neural network,» Thermochimica Acta, cilt 412, no. 1-2, pp. 107-111, 2004.
[16] J. Straszko, A. Biedunkiewicz, and A. Strzelczak, «Application of Artificial Neural Nerworks in Oxidation Kinetic Analysis of Nanocomposites,» Polish Journal of Chemical
Technology, cilt 10, no. 3, pp. 21-28, 2008.
[17] J. A. Conesa, J. A. Caballero, and J. A. Reyes-Labarta, «Artificial Neural Network for Modelling Termal Decompositions,» J. Anal.
Appl. Pyrolysis, cilt 71, pp. 343-352, 2004.
[18] M. Beken, Yüksek Basınç Altında Çalışan
Diferansiyel Termal Analiz Cihazının
Geliştirilmesi, İstanbul: Yıldız Teknik
Üniversitesi, 2002.
[19] M. Beken, «Artifıcial Neural Network Prediction for Thermal Decomposition of Potassıum Nitrate (KNO3) and Benzoic Acid (C6H5COOH),» Mod. Phys. Lett. B, cilt 24, no. 17, pp. 1855-1868, 2010.
[20] R. Erb, «Introduction to Backpropagation Neural Network Computation,» Pharmaceutical
Research, cilt 10, no. 2, pp. 165-170, 1993.
[21] R. Erb, «Introduction to Backpropagation Neural Network Computation,» Pharmaceutical
Research, cilt 10, no. 2, pp. 165-170, 1993.
[22] B. Widrow and M. E. Ho, «Adaptive Switching Circuits,» IRE WESCON ConventionRecord, pp. 96-104, 1960.
its content may not be copied or emailed to multiple sites or posted to a listserv without the copyright holder's express written permission. However, users may print, download, or email articles for individual use.