Selçuk J. Appl. Math. Selçuk Journal of Vol. 9. No. 2. pp. 65 72 , 2008 Applied Mathematics
Cointegration Relationship Between The Two Sides of The Electric Energy Sector
Y¬lmaz Akdi1, Af¸sin ¸Sahin2, Cemal Atakan3
1Department of Statistics, Faculty of Sciences, Ankara University, 06100
Tando-gan, Ankara Turkey
e-mail: [email protected]
2Republic of Turkey Ministry of Agriculture and Rural A¤airs, 06530, Ankara,
Turkey
e-mail: [email protected]
3Department of Statistics, Faculty of Sciences, Ankara University, 06100
Tando-gan, Ankara Turkey
e-mail: [email protected]
Abstract. Energy is one of the basic micro dynamics of the general econ-omy. Turkey as one of the candidate countries to the European Union is dependent on the petroleum and natural gas as the member states. Along with this, Turkey should turn to other energy sources bethinking the high population increase. In this article, we have investigated the relationship between the elecrtic energy production and consumption in Turkey. We ob-served that the production and consumption series are both non-stationary. Standart and the periodgram based unit root tests were employed to both series. The periodgram based unit root test is invariant to mean. Moreover, the distribution of critical values are free of the sample size and model se-lection. First, we observed that both of the series are non-stationary. Next, we have searched for a possible cointegration methods. We rejected the coin-tegration relationship for the consumption and supply side of the electric energy sector.
Key words: Electric energy sector, unit root, cointegration, and peri-odogram.
1.Introduction
Electric energy is a secondary renewable energy resource obtained by utilizing primary sources. Within the last couple of years, parallel to the high growth, modernization and population trends in the developing countries as Turkey, demand for energy has been increased rapidly. In Turkey, nearly thirty per-cent of the electric energy is produced from hydraulic and the rest from thermic power stations and the capacity utilization ratio is nearly seventy percent (Public Waterworks Administration of Turkey). By the ascending demand and restricted supply sources, the sector has started to become more strategic for Turkey. Today, per capital energy is one of the most basic of needs than before.
In the literature there are several studies investigating the supply and demand interaction for the sector. Weinberg (1980) debates about the uncertainty concerning the estimates of future policies. Gillard (1988) tries to present a projection for energy demand for the future by considering several assump-tions as population and economic growth. Yuan et al. (2007) claims that there is a long-run relationship between real GDP and energy consumption and the causality runs from electricity consumption to real GDP. She¢ eld (1999) presents a projected energy demand for the next century for several regions in the world by considering di¤erent scenarios and energy sources. Erdogdu (2007) tells about the energy reform in Turkey and forecasts the electricity demand by using cointegration analysis and ARIMA modeling and claims that the current electricity demand projections are overestimated. In this article we analyzed the long-run relationship between the electric en-ergy production and consumption by considering Turkey which is one of the important candidate countries of the European Union. Considering these series gives us a non-stationary solution which means that it is impossible to conduct forecasts for the future. Therefore the regulation on the Elec-tric Energy Demand Estimates published in April, 2006 by Energy Market Regulatory Authority may have some biases (They consider economic, so-cial, demographic, climatic, environmental data and the past values of the variables will be estimated and the other regional data).
Following section introduces an overview of the electric energy market. The third section presents the data, methodology and results and the last section is discussion and conclusion.
2. Electric Energy Market Overview
One of the components of energy, electric energy is the most quali…ed re-newable energy. Besides its share of consumption among the total energy is superlative and this contribution is increasing persistently. Natural gas, pe-troleum, coal and bio-diesel tread on the electric energy (see Asif and Muneer, 2007 for the detailed analysis of types of energy and the global usage …gures). The demand for electric energy within the …nal energy consumption increases continuously. The plans for meeting the needs are critical for an e¤ective pricing in the sector. Achievable plans will be healthy by the long term forecasts of the demand side of the sector. The storage problem, high costs for the production and quality standards make forecasts harder to implement and decreases the level of accuracy in the estimates. Therefore the quality of the plans is proportional by the demand forecasts. Forecasting errors may also cause excess demand or supply for the future. This rebounds to the taxpayers in the future.
The spread between the least consumption and highest consumption may increase more than two times yearly and may ‡uctuate regionally and sea-sonally. The high variability of the electric energy demand also a¤ects the supply side of the sector. It can not be stored; therefore there is also a high possibility of excess supply. In a reverse case, where the demand ex-ceeds the supply, cuto¤s and obligatory saving policies usually steps in. This will increase the uncertainty in the industry sector and investments will be postponed. For this reason, the supply level of energy should be su¢ cient for the maximum demand and the reserve capacity should be ready. There-fore the plans should be prepared by considering the seasonal variability and optimality of the production capacity.
In the past, the demand for electric energy has been forecasted irrationally, therefore the excess supply has been observed. However, the policy makers could not recognize the increasing the demand for the sector. The optimistic view for the demand side of the sector has let them made guaranteed pur-chase agreements. The productions of the power houses have been decreased. The energy import driven policies have been rebounded to twin problems: increasing excess energy production capacity and foreign dependency con-cerning the primary resources. The overestimation problem for the electric
energy demand caused the energy purchased guaranteed power houses work-ing by full capacity and the public power houses producwork-ing by lower cost. This situation also has been increased the prices and decreased the com-petitive advantage of the domestic industry over against the international …rms.
As mentioned above, as a result of increasing population and growth, and increasing trend in the electric energy production & consumption cause sig-ni…cancy problem concerning the forecasts obtained from the data. In 2020 in Turkey it is planed to be consumed more than two times than today’s …gure which is nearly equal to the average world consumption (State Planning Or-ganization). However in this article we claim a possibility of overestimation problem because of market frictions and rigidities caused by the long-term agreements.
3. Data, Methodology and Results
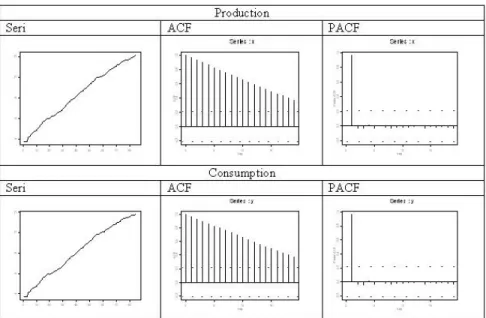
The data has been gathered from Turkish Statistical Institute for the period 1923-2007. Graphs of the data employed in the model are presented in Figure 1.
We employed ADF unit root test to assess stationary properties of the pro-duction (X) and consumption (Y) data. As seen in table 1 both of the series are integrated in order one.
Series ADF ADF
First Di¤. 1% level 5% level 10% level Result
X -2.6738 -5.1971 -3.5102 -2.8963 -2.5854 I(1)
Y -2.9872 -4.9642 -3.5103 -2.8963 -2.5854 I(1)
Figure 1. Descriptive Graphs of the Series
Next we employed periodogram based unit root test proposed by Akdi and Dickey (1998) and found that the production and consumption series are consistent by ADF results I(1).
The periodogram based test method is free of sample size and model se-lection. Therefore it is thought that the proposed method is more robust. To summarize in brief: For a given fX1; X2; :::; Xng time series, assuming
!k = (2 k) =n, periodograms are calculated as
In(!k) = n 2 a 2 k+ b 2 k where ak= 2 n n P t=1 Xt X cos (!kt) and bk = 2 n n P t=1 Xt X sin (!kt) : Since, n P t=1 cos (!kt) = n P t=1
sin (!kt) = 0, the periodograms are mean-invariant.
the series are not stationary, Akdi and Dickey (1998) show that the dis-tribution of Tn(!k) = 2(1 cos(!b2 k))In(!k) is mixture of chi-squares, namely
Tn(!k) d
! 21 + 3 21: Therefore it is possible to test the null hypothesis of
a unit root based on the periodograms. The distribution of the test statistic does not depend on the sample size. The critical values for the periodogram based unit root test statistic are provided in Akdi and Dickey (1998).
Series b2 In(!1) Tn(!k) Crit. Value Result
Xt 6.2490 335.6390 0.2934 0.178 Unit Root
OXt 0.0031 0.0113 0.0202 0.178 Stationary
Yt 6.029 328.2540 0.2974 0.178 Unit Root
OYt 0.0033 0.01638 0.0281 0.178 Stationary
Table 2: Periodogram-Based Unit Root Test Results
Consequently, it is meaningful to search for a cointegration relationship among the two series. For this purpose initially we have used the restricted maximum likelihood methodology proposed by Johansen (1988) to search for the cointegration relationship. We have not observed a long-run relationship by trace and max statistics. The results are given in Table(3).
Variables Hyp. No. Eig.val. Trace Max Trace test max test
of Coint. Statistic Statistic at 5% at 5%
X-Y None * 0.1529 14.2540 13.6030 15.4947 14.2646 At most 1 * 0.0079 0.6511 0.6511 3.8415 3.8415
Table 3: Johansen Cointegration Test Results
As in the unit root test, considering the robust properties of the periodograms, we tested cointegration relationship by the methodology proposed by Akdi (1995). Here, for the Xt and Yt series, if the real parts of the
cross-periodograms (Real fIn;X;Y(!k)g) are regressed on the periodograms obtained
from one of those (say Xt ), (In;X(!k)). If the obtained residuals are
can be represented as
Xt= a11Ut+ a12St ; Yt= a21Ut+ a22St
where Ut and St represent the unit root and the stationary parts of the
series, respectively. Note that Yt a21a111Xt= cSt is stationary and in order
to estimate the cointegration vector, it is su¢ cient to estimate the ratio a21=a11.
Assuming that Zk = RealfIn;X;Y(!k)g and Wk = In;X(!k): if we consider
the spectral regression model of Zk = 0 + 1Wk + vk , k = 1; 2; :::; [n=2]
, the ordinary least square estimate of the 1: b1;n will be consistent by
the ratio a21=a11 (Akdi, 1995), where [n=2] denotes the integer part of n=2.
Namely, b1;n p! a21=a11, therefore to test if the series are cointegreted or
not, we should test if bet = Yt b1;nXt is stationary or not.
In order to do this let us regress bet on bet 1(rbet = 0 + 1bet 1 + t; t =
1; 2; 3; :::; n). Not rejecting H0 : 1 = 0 is equivalent to test the null
hy-pothesis of no-cointegration. The rejection of the null hyhy-pothesis will imply that the series are cointegrated with the cointegration vector (1; b1;n)0 .
In our data we observed b1;n = 0:988 . The t-type statistic is b = b1;n Sb
1;n
and if b is less than the critical value, we reject the null hypothesis of no cointegration (see Akdi, Berument ve Atakan, 2005). The distribution of the t-type statistics is di¤erent then the student t distribution and the critical values are produced by Akdi, Berument and Atakan (2005). We observed b = 0:859 and we fail to reject the null hypothesis of no cointegration at the 5% signi…cance level because b is greater than 3:4356 (Table 2).
b b 5 % level crit.
val. ofb Result
X-Y 0.9881 -0.859 -3.4356 No cointegration Table 4: Periodogram-Based CointegrationTest Results
4. Conclusion and Evaluation
Energy demand and supply schedule does not have a long-run relationship. This result has some important political implications. (a) The market is not
e¢ cient and the prices are not determined optimally. (b) There is a case of overestimation for the demand forecasts implemented by several govern-mental organizations. Not considering the unit root case is one of the causes of those estimates. (c) Optimum energy demand will be minimized by the energy usage e¢ ciency. Therefore, the countries should increase education on this issue. (d) The roles of dominant actors should be determined more e¤ectively. (e) Other renewable energy sources should be discussed while preparing long-term plans for the future energy policies.
References
1. Akdi, Y., Berument, H. and Cilasun, S. (2006): The relation between di¤erent price indices: Evidence from Turkey”, Physica A, 360, 483-492.
2. Akdi, Y., Berument, H., Cilasun M, S. and Olgun, H. (2006). “The relation-ship between di¤erent price indexes: A set of evidence from iIn‡ation targeting countries”, Statistical Journal of the United Nations, ECE, 23, 119-125.
3.Akdi, Y. and Dickey, D.A. (1998). “Periodograms for unit root time series: Distributions and Tests”, Commun. Stat., Vol. 27, No. 1, 69-87.
4. Akdi, Y. (1995). Periodogram Analysis for Unit Roots. Ph. D. Dissertation. North Carolina State University, USA.
5. Asif, M. and T. Muneer, (2007). “Energy supply its demand and security issues for developed and emerging economies”, Renewable and Sustainable Energy Reviews, Vol. 11: 1388-1413.
6. Berument, H., Akdi, Y. and Atakan, C. (2005). “An empirical analysis of · Istan-bul stock exchange sub-indexes”, Studies in Nonlinear Dynamics & Econometrics, Vol. 9, Issue: 3.
7. Engle, R.F. and Granger, C.W.J. (1987)” Cointegration and error correction representation”, Estimation Test. Econ., 55, 251-276.
8. Erdogdu, E. (2007). “Electricity demand analysis using cointegration and ARIMA modelling: A Case Study of Turkey”, Energy Policy, Vol. 35, No. 2: 1129-1146.
9. Gillard, B. (1988). “Population, economic growth and energy demand, 1985-2020”, Population and Development Review, Vol. 14, No. 2, Jun: 233-244. 10. She¢ eld, J., A. Gibson, P. Vandenplas, M. Keilhacker, J.F. Davies, K. Lackner et al. (1999). “World population and energy demand growth: The potential role of fusion energy in an e¢ cient world”, Philosophical Transactions: Mathematical, Physical and Engineering Sciences, Vol. 357, No. 1752, March: 377-395.
11. Weinber, A. M. (1980). “Energy policy and mathematics”, SIAM Review, Vol. 22, No. 2, April: 204-212.
12. Yuan, J., Changhong, Z. Shunkun, Y. and Zhaoguand, H. (2007). “Elec-tricity consumption and economic growth in China: Cointegration and co-feature analysis”, Energy Economics, Vol. 29, No. 6: 1179-1191.