CENTRAL BANK INDEPENDENCE,
FINANCIAL MARKET DEVELOPMENT AND INFLATION
A Master’s Thesis by GAMZE KÜSMEN Department of Economics Bilkent University Ankara February 2008
CENTRAL BANK INDEPENDENCE,
FINANCIAL MARKET DEVELOPMENT AND INFLATION
The Institute of Economics and Social Sciences of
Bilkent University
by
GAMZE KÜSMEN
In Partial Fulfillment of the Requirements for the Degree of MASTER OF ECONOMICS in THE DEPARTMENT OF ECONOMICS BILKENT UNIVERSITY ANKARA February 2008
I certify that I have read this thesis and have found that it is fully adequate, in scope and in quality, as a thesis for the degree of Master of Arts in Economics
--- Assoc. Prof. Bilin Neyaptı Supervisor
I certify that I have read this thesis and have found that it is fully adequate, in scope and in quality, as a thesis for the degree of Master of Arts in Economics
--- Assoc. Prof. Zeynep Önder Examining Committee Member
I certify that I have read this thesis and have found that it is fully adequate, in scope and in quality, as a thesis for the degree of Master of Arts in Economics
--- Assist. Prof. Ümit Özlale Examining Committee Member
Approval of the Institute of Economics and Social Sciences
--- Prof. Erdal Erel Director
iii
ABSTRACT
CENTRAL BANK INDEPENDENCE,
FINANCIAL MARKET DEVELOPMENT AND INFLATION Küsmen, Gamze
Master of Economics
Supervisor: Assoc. Prof. Bilin Neyaptı
February, 2008
Central bank independence (CBI) and inflation relation has long been a debate and is established in many studies, such as Bade and Parkin (1982), Alesina (1988, 1989), Grilli, Masciandaro, and Tabellini (1991), and Cukierman, Webb and Neyaptı (1992). Although these studies address the negative relation between CBI and inflation, they do not consider the effect of the development level of financial markets on this relation. Posen (1995) considers the effect of financial market development by using effective financial opposition to inflation formed by the inflation-averse groups. He tests the effect of this variable on CBI and inflation simultaneously. He claims that the variable, which decreases inflation is effective financial opposition to inflation (when used with CBI) rather than CBI. Thus, he states that rather than analyzing the direct relation between inflation and CBI, the effect of effective financial opposition to inflation on CBI and inflation should be
iv
investigated. Based on this study, this thesis looks at the effect of financial market development (FMD) both on CBI and on the relation between CBI and inflation by using alternative indicators for FMD. We find that there is a significant and positive relation between CBI and FMD for non-transition countries. Moreover, although Posen (1995) states that CBI does not have a significant effect on inflation when EFOI is included as an additional explanatory variable, we find evidence that both FMD and CBI have a significant effect on inflation. However, the results of the estimations are not robust to changes in samples.
v
ÖZET
MERKEZ BANKASI BAĞIMSIZLIĞI,
MALİ PİYASALARIN GELİŞMESİ VE ENFLASYON
Küsmen, Gamze Yüksek Lisans, İktisat Bölümü Tez Danışmanı: Doç. Dr. Bilin Neyaptı
Şubat 2008
Merkez bankası bağımsızlığı ve enflasyon arasındaki ilişki Bade ve Parkin (1982), Alesina (1988,1989), Grilli, Masciandaro ve Tabellini (1991), ve Cukierman, Webb ve Neyaptı (1992) başta olmak üzere bugüne kadar birçok çalışmada incelenmiştir. Bu araştırmalar merkez bankası bağımsızlığı ve enflasyon arasındaki negatif ilişkiyi işaret etse de, mali piyasaların gelişmişliğini göz önüne almamaktadır. Mali piyasaların gelişmişlik düzeyinin merkez bankası ve enflasyon arasındaki ilişkiye etkisini inceleyen ilk araştırma Posen (1995) olmuştur. Posen bu etkiyi incelerken enflasyon karşıtı gruplar tarafından oluşturulan “enflasyona karşı etkili mali direnişi” kullanmıştır. Kullandığı bu değişkenin merkez bankası bağımsızlığına ve enflasyona etkisini ayrı ayrı test etmiştir. Posen bu araştırmasında, merkez bankası bağımsızlığının enflasyona karşı oluşan mali direniş sonucu ortaya çıktığını ve enflasyonu düşüren değişkenin birçok araştırmada bahsedildiği gibi merkez bankası
vi
bağımsızlığı değil, aksine merkez bankası bağımsızlığı ile beraber kullanıldığında enflasyona karşı oluşan bu mali direniş olduğunu iddia etmiştir. Bu yüzden de enflasyon ve merkez bankası bağımsızlığı arasındaki ilişkinin değil, bu mali direnişin merkez bankası bağımsızlığı ve enflasyon üzerindeki etkisinin ayrı ayrı incelenmesi gerektiğini savunmaktadır. Bu tezde Posen’ın bulguları ışığında, mali piyasaların gelişmişliğinin merkez bankası ve merkez bankası-enflasyon ilişkisi üzerindeki etkisi mali piyasaların gelişmişlik düzeyi için alternatif göstergeler kullanılarak incelenmektedir. Sonuç olarak, geçiş ülkesi dışındaki ülkeler için mali piyasaların gelişmişliğinin merkez bankası bağımsızlığına etkisinin anlamlı ve posizitif olduğu bulunmuştur. Bunun yanısıra, enflasyona karşı olan mali direniş ile birlikte kullanıldığında merkez bankası bağımsızlığının enflasyona etkisinin olmadığını ve merkez bankası bağımsızlığının etkisinin ancak bu mali direniş yoluyla olabileceğini savunan Posen’ın aksine, mali piyasaların gelişmişliğinin yanısıra merkez bankası bağımsızlığının da enflasyona etkisi olduğu bulunmuştur.
Anahtar Kelimeler: Merkez Bankası Bağımsızlığı, Mali Piyasaların Gelişmişliği, Enflasyon.
vii
ACKNOWLEDGEMENTS
I would like to thank to Prof. Bilin Neyaptı for her supervision and guidance through my graduate study. I am very grateful to her for her patience and tolerance that motivated me in development of this thesis.
I would like to thank to Prof. Ümit Özlale and Prof. Zeynep Önder for encouraging me to begin graduate study and get a master degree in Economics.
I would like to thank to my father, mother and brother for always being ready to help me and for supporting me throughout my whole life.
I owe special thanks to my friends Ayla Yenidede and Sana Lessir for their support, sensibility and invaluable friendships.
Finally, I owe special thanks to Meltem Sağtürk and Özlem Eraslan for their supports and help throughout my graduate study.
viii
TABLE OF CONTENTS
ABSTRACT ... iii
ÖZET ...v
ACKNOWLEDGEMENTS ... vii
TABLE OF CONTENTS... viii
LIST OF TABLES...X LIST OF SYMBOLS (VARIABLES) ... xiii
CHAPTER 1: INTRODUCTION...1
CHAPTER 2: LITERATURE REVIEW ...6
CHAPTER 3:DATA ...19
CHAPTER 4: METHODOLOGY...24
CHAPTER 5: EMPIRICAL RESULTS ...29
5.1.EMPIRICAL RESULTS FOR NON-TRANSITION COUNTRIES...29
5.1.1. Hausman Test Results: ...29
5.1.2. CBI-FMD Relationship: Decade Average Data ...31
ix
5.1.4. Inflation-CBI Relationship: Decade Average Data ...38
5.1.5. Inflation-CBI Relationship: Annual Data...48
5.2.EMPIRICAL RESULTS FOR TRANSITION COUNTRIES:...57
5.2.1. Hausman Test Results: ...58
5.2.2. Wald Test Results: ...59
5.2.3. CBI-FMD Relationship: Period Average Data ...60
5.2.4. CBI-FMD Relationship: Annual Data...61
5.2.5. Inflation-CBI Relationship: Period-Average Data ...62
5.2.5. Inflation-CBI Relationship: Annual Data...64
CHAPTER 6: CONCLUSION ...66
BIBLIOGRAPHY...69
APPENDIX 1: DUMMY VARIABLES FOR FMD MEASURES ...73
APPENDIX 2: COUNTRIES IN DATA SETS ...75
APPENDIX 3: POSEN’S ESTIMATIONS ...77
APPENDIX 4: CORRELATION MATRICES...84
x
LIST OF TABLES
Tables in the Text:
Table 1: Variables Used in Each Data Set ...23 Table 2: Hausman Test Results (Fixed Effect versus Random Effect) with:
Table 2a: Decade-average data of non-transition countries ...30 Table 2b: Annual data of non-transition countries...30 Table 3: Estimation Results for CBI-FMD Relationship with:
Table 3a: 17-country decade-average data ...31 Table 3b: 32-country decade-average data ...32 Table 3c: 66-country decade-average data ...33 Table 4: Estimation Results for CBI-FMD Relationship with:
Table 4a: 17-country annual data...35 Table 4b: 32-country annual data...36 Table 4c: 66-country annual data...37 Table 5: Estimation Results for CBI-Inflation Relationship with:
Tables 5a-5b: 17-country decade-average data...39 Tables 5c-5d: 32-country decade-average data...42 Tables 5e-5f: 66-country decade-average data ...45
xi
Table 6: Estimation Results for CBI-Inflation Relationship with:
Tables 6a-6b: 17-country annual data ...49
Tables 6c-6d: 32-country annual data ...52
Tables 6e-6f: 66-country annual data...55
Table 7: Hausman Test Results (Fixed Effect versus Random Effect in Transition Countries)...58
Table 8: Wald Test Results for Coefficient Restriction of Fixed Effects in Transition Countries: Table 8a: Period-average data...59
Table 8b: Annual data ...59
Table 9: CBI-FMD Relationship: Period average data of transition countries ...60
Table 10: CBI-FMD Relationship: Annual data of transition countries...61
Tables 11a-11b: Inflation-CBI Relationship: Period-average data ...62
Tables 12a-12b: Inflation-CBI Relationship: Annual data ...64
Tables in the Appendices: Appendix 1 Table 1: Averages of Data...73
Appendix 2 Table 1: List of 66 countries ...75
Table 2: List of Transition Countries...76
Appendix 3: Posen’s Estimations For decade-average data of 17 countries: Table 1: OLS model ...77
xii
Table 2: WLS model ...78 For decade-average data of 32 countries:
Table 3: OLS model ...79 Table 4: WLS model ...80 Replication of Table 1 of Posen:
Table 1.1: Without 1950s ...81 Table 1.2: With robust estimation...82 Table 1.3: Without 1950s and with robust estimation...83
Appendix 4: Correlation Matrices
Table 1: For annual data of 66 countries...85 Table 2: For decade-average data of 66 countries...86
Appendix 5:
Table 1: Decade-average data of 66 countries ...88 Table 2: Period-average data of transition countries ...97
xiii
LIST OF SYMBOLS (VARIABLES)
CBI: Central Bank Independence
D: Inflation defined as D= [inflation*100 / (inflation+1)] (range between 0% and 100%)
BSCRGDP: the ratio of total banking sector credit to GDP
PRVTCRGDP: the ratio of credit provided to private sector to GDP
PRVTCRBS: the ratio of credit provided to private sector to banking sector total credit
M2GDP: the ratio of money (M2) to GDP EFOI: effective financial opposition to inflation
FixedX: dummy variable for whether the country has a fixed exchange rate regime LatinA.: dummy variable for whether the country belongs to Latin America
OECD: dummy variable for whether the country is developed and a member of Organisation for Economic Co-operation and Development (OECD).
Asia: dummy variable for whether the country belongs to Asia 1950s: dummy variable for the years 1950-1959
1960s: dummy variable for the years 1960-1971 1970s: dummy variable for the years 1972-1979 1980s: dummy variable for the years 1980-1989
xiv
BSCRGDP*CBI: variable for the interaction of CBI with BSCRGDP PRVTCRGDP*CBI: variable for the interaction of CBI with PVTCRGDP M2GDP*CBI: variable for the interaction of CBI with M2GDP
PRVTCRBS*CBI: variable for the interaction of CBI with PRVTCRBS EFOI*CBI: variable for the interaction of CBI with EFOI
CBI*DBSCRGDP: variable for the interaction of CBI with dummy variable defined for
BSCRGDP
CBI*DPRVTCRGDP: variable for the interaction of CBI with dummy variable defined
for PRVTCRGDP
CBI*DPRVTCRBS: variable for the interaction of CBI with dummy variable defined for
PRVTCRBS
CBI*DM2GDP:variable for the interaction of CBI with dummy variable defined for
M2GDP
CBI*DEFOI: variable for the interaction of CBI with dummy variable defined for
1
CHAPTER 1
INTRODUCTION
Central bank independence (CBI) and inflation relation has been studied widely, among them being Bade and Parkin (1982), Alesina (1988, 1989), and Grilli, Masciandaro, and Tabellini (1991), Cukierman, Webb and Neyaptı (1992)1. Although these studies address the negative relation between CBI and inflation, they do not consider the effect of the development level of financial markets on this relation. Posen (1995) considers the effect of financial market development (FMD) by using effective financial opposition to inflation (EFOI)2 formed by inflation-averse groups. He tests the effect of EFOI on CBI and inflation simultaneously. He claims that the variable, which decreases inflation is EFOI (when used with CBI) rather than CBI. Thus, he states that rather than analyzing the relation between inflation and CBI, the effect of EFOI on CBI and inflation should be investigated.
This thesis tests the effect of FMD both on CBI and on the relation between CBI and inflation by using alternative indicators for FMD. We find that there is a significant and positive relation between CBI and FMD for non-transition countries.
1 Cukierman, Webb and Neyaptı (1992) will be abbreviated as CWN (1992) after herein.
2
Moreover, although Posen (1995) states that CBI does not have a significant effect on inflation when EFOI is included as an additional explanatory variable, we find evidence that both FMD and CBI have a significant effect on inflation. However, the results of the estimations are not robust to changes in samples.
The relationship between CBI and inflation was primarily addressed by Barro and Gordon (1983) and Kydland and Prescott (1977), who argue that independent central banks provide more credible monetary policies and thus price stability. However, CBI and the motivation for the full commitment of central bank to monetary policies require support from financial markets. Therefore, interest groups such as financial markets are important factors in determining the relationship between CBI and inflation. Posen (1995) argues that developed financial markets are averse to higher inflation and thus constitute the most important interest group that has an effect on the monetary policies of central banks. First of all, CBI is considered as one of the tools of a government for selecting “the strength of its commitment to price stability” (Cukierman 1992a, chapter 23; Lohmann [1992]). Second, price stability, an objective of central bank, is the one thing this group aims at. Therefore, Posen (1995) argues that this group’s aversion to inflation, namely EFOI directly affects the expectations about inflation and CBI level. Furthermore, as also Neyaptı (2003) notes, developed financial markets reduce pressures for expansionary monetary policy. Therefore, FMD has a positive effect on price stability and creates a supporting environment for CBI. Hence, development level of financial markets is important for the CBI and inflation. Depending on this, Posen (1995) claims that rather than looking at the relation between CBI and inflation, the effect of EFOI on
3
CBI and inflation should be investigated. Hence, development level of financial markets, for which Posen (1995) uses EFOI, is a factor that affects inflation and CBI simultaneously. Based on these ideas, we search for the effect of FMD on CBI and, by going one step further; we jointly investigate the effect of CBI and FMD on inflation.
Instead of EFOI used by Posen (1995), we use alternative measures of FMD that are commonly used in the literature, such as the ratio of banking sector total credit to GDP, the ratio of credit provided to private sector to GDP, the ratio of credit given to private sector to banking sector total credit, and M2 to GDP. Neyaptı (2001) uses the ratio of credit provided to private sector to GDP and M2 to GDP, namely financial deepening, as FMD indicators and test the effect of CBI and FMD on macroeconomic variables such as inflation, deficit and real growth in transition countries. We choose these variables as alternative indicators of FMD since they are directly available and quantitative measures for FMD.
Our hypothesis is that there is a positive relation between CBI and FMD, whereas there is a negative relation between CBI and inflation since CBI is directly affected by developed financial markets. In order to test our hypotheses, we use these FMD indicators and CBI indicators (defined as equal-weighted index of Legal Independence, LVAU and unequal-weighted index of Legal Independence, LVAW in CWN [1992]) as well as EFOI from Posen (1995). As another point of modification to the Posen study, this thesis uses a larger data set that consists of samples of transition and non-transition countries.
4
We perform Hausman (1978) test in order to choose whether random or fixed effect model should be used in the estimations concerning CBI-FMD relation. As the result of the Wald and Hausman tests, we perform Fixed Effect technique to estimate the relation between CBI and FMD with the annual data of transition countries. We use OLS method with period average data of transition countries and non-transition countries. Moreover, to test the effect of CBI and FMD on inflation, we use OLS method with CBI, FMD and their interactive variables as explanatory variables.
From our estimations, we find that FMD, measured by the ratio of private credit to banking sector total credit and the ratio of M2 to GDP, as well as EFOI has significant and positive effect on CBI level in non-transition countries. This finding is consistent with Posen’s results. However, in transition countries, although FMD is significant, it has a negative sign. This finding is surely inconsistent with the argument of Posen (1995). The reason for FMD to be significant while it has a negative sign is that transition countries are endowed with legal CBI in order to ensure the central bank commitment to price stability. Thus, in transition countries although financial markets are not developed enough to provide the support for decreasing inflation, CBI is high to establish commitment to price stability. Therefore, transition countries with less developed financial markets have higher legal CBI (See Cukierman et al., 2002).
Posen (1995) states that CBI is not a significant variable in explaining inflation when it is used with EFOI, which has a significant effect on inflation. By
5
contrast, we find evidence supporting that CBI is also significant in explaining inflation when used with the FMD indicators and EFOI. Moreover, in our estimations, we investigate that also joint effect of CBI and FMD has a significant effect on decreasing inflation. Neyaptı (2003) discusses that CBI and FMD have two-directional causality and hence one might expect CBI to lead to higher FMD. Especially in transition countries, when CBI and FMD are used together for explaining inflation, we find that CBI is significant, while FMD is insignificant. Surely, this finding does not support the hypothesis of Posen (1995). Nevertheless, the significance of FMD indicator will differ from sample to sample.
As a result, findings indicate that FMD has a significant effect on CBI as Posen states. However, unlike Posen’s results, we find that FMD and CBI jointly have a significant effect on inflation. As a result, the effect of CBI on inflation cannot be underestimated even when used with FMD. Thus; besides FMD, CBI should be added as a factor for commitment of central banks to monetary policies in decreasing inflation.
Chapter 2 gives a summary of the related literature. In Chapter 3, we explain the variables and the data set used in this study. In Chapter 4, we introduce the methodology and the equations estimated. Chapter 5 reports the empirical results for transition and non-transition countries. Finally, Chapter 6 concludes.
6
CHAPTER 2
LITERATURE REVIEW
The relation between central bank independence and inflation began to be rigorously addressed in the rules versus discretionary models (dynamic or time inconsistency models). In order to overcome high inflation, policy makers should make decisions about whether to apply the rules or discretionary policies or an optimum policy, which is a mixture of both discretionary policies and rules, as a monetary policy for commitment to price stability. Kydland and Prescott (1977) discuss that discretionary policy is not the right tool for dynamic economic planning since it leads to economic instability and does not provide full commitment to price stability. Rather, it leads to changes in the policies in each period, given the current situation. They also point out that any change in the decisions of the policy maker (simply discretionary policy) will change future expectations of the economic agents about the future policy decisions immediately. Thus, they indicate that policy maker should choose rules rather than discretionary policy in order to improve the economic performance in dynamic economic systems and provide full commitment to price stability.
7
Similarly, Barro and Gordon (1983a, 1983b) state that central banks applying the rules rather than discretionary policies provide full commitment to the monetary policy and make the people realize this commitment and adjust their expectations accordingly. They indicate that this full commitment to policy brings the right prediction of these expectations of people by central banks. For instance, if central bank is independent and thus government policies do not affect the monetary policy for their interest, central bank can apply the rules with full commitment since there is no direct interference of government to short-term policies. Barro and Gordon (1983a) analysis is an example of a reputational equilibrium for monetary policy. They state that if policy maker chooses rules rather than discretion, she always has the option to cheat by changing from rule to discretion in order to get a benefit from the surprise of people. However, they add that since there is a repeated interaction between the agents and policy maker, it will damage the policy maker’s reputation and will change the expectations of people about future policies. Thus, they point out that the risk of losing reputation or credibility, enforces the policy maker to apply the rule rather than discretion in order to get a full commitment to monetary policy. Therefore, they state that monetary institutions that enforce rules rather than the one that allow discretion can decrease equilibrium rates of inflation and monetary growth.
Taking the results of Barro and Gordon (1983a, 1983b) and Kydland and Prescott (1977), Rogoff (1985) also states that if the commitment of central bank to reduce inflation is increased, then the time-consistent average rate of inflation decreases. In other words, he states that if the head of central bank puts a weight on
8
inflation rate stabilization more than the society does, then the commitment of the central bank to price stability will help to decrease inflation. Therefore, he notes that his model can be an explanation why the central banks are endowed with independence. Moreover, he also argues that if a central bank gives more importance to achieve a low rate of growth for nominal variables such as price level, nominal GNP and money supply, then commitment of central bank to achieve these will decrease the time-consistent rate of inflation although these nominal variables have different effects on stabilization policies. Furthermore, he adds that one measure which central bank is isolated from inflationary pressures is to give central bank “political and fiscal independence”. In summary, he states that increasing the central bank’s commitment to price stability would decrease the time consistent rate of inflation and this commitment comes with fiscal and political independence. In other words, as also Alesina and Summers (1993) states, in Rogoff’s model, the more inflation-averse is the head of the central bank, the less the probability of using discretionary policy and the less the average inflation is, however the more the toleration in cyclical variability in other economic variables.
Alesina and Summers (1993) and Rogoff (1985) note that time-inconsistency theories of inflation, developed as in Kydland and Prescott (1977) and Barro and Gordon (1983), imply that as CBI increases, likelihood of decreasing inflation increases. Besides, there are also studies such as Bade and Parkin (1982), Parkin (1987), Alesina (1988, 1989), Grilli, Masciandaro and Tabellini (1991), and CWN (1992) that empirically demonstrate that increasing central bank independence decreases inflation rate.
9
Bade and Parkin (1982) develop an index for central bank independence for 12 countries that takes integer values from 1 to 4. This measure is based on the political independence of the central bank. In Bade and Parkin (1982), political independence takes the following issues into account: the interaction and its frequency between the central bank and the government, appointment procedures of the head of the central bank, and interference of the government to the board of central bank. Alesina (1988) uses the same measure by including 4 more countries. In addition to this, Alesina (1988) discusses two related subjects. First, he determines the effects of competitions in the elections on macroeconomic policy and business cycles. Second, he determines how monetary policy is affected and changes as a result of the different levels of CBI.
Similarly, Grilli, Masciandaro and Tabellini (1991) develop a measure for central bank independence that takes “political independence” and “economic independence” into account. As in Bade and Parkin (1982), political independence is defined as the freedom of the central bank in choosing the final goals of the monetary policies without interference of the government. Moreover, economic independence is defined as the freedom of central bank in choosing and using the monetary policy tools for achieving these goals. Political independence includes the questions of whether the government appoints the head of the central bank; how long it takes to appoint the head of the central bank; whether the central bank law includes monetary stability as the objective of the central bank; whether the government interferes to the decisions of the central bank about monetary policies; and whether government is
10
represented on the board of the central bank. Moreover, economic independence is used to detect to what extent government can reach the financial sources or credit of the central bank in order to finance its budget deficit. Furthermore, they state that higher central bank independence is associated with lower level of inflation at no apparent cost of real economic performance, meaning that growth of real output or its variability does not change. Thus, they emphasize that higher CBI is beneficial in terms of decreasing inflation but real economic performance does not get worse. In other words, they imply that worse real economic performance is not necessarily the price of low inflation.
Similarly, CWN (1992) is an important research on the topic of central bank independence. It develops four measures of central bank independence and tries to determine their relation with inflation. One measure for CBI developed in CWN (1992) is a questionnaire-based index for perceived actual independence of central bank. Indices LVAU, which is an equal-weighted index of legal independence, and LVAW, which is an unequal-weighted index of legal independence, consist of 4 groups and 16 aspects for CBI. These indices give different weights to different characteristics of CBI and consider the following issues: independence of the head of the central bank, independence of central bank in its decisions about the policies, final aims of the central bank displayed in the law of central bank, and legal limits of the borrowing of government from central bank. CWN (1992) test the relation between CBI and inflation with a sample of 71 countries (21 countries are developed and 50 countries are developing) from 1950 to 1989. They find that legal independence is negatively related to inflation in industrial countries, but there is no
11
significant relation between CBI and inflation in developing countries. If the turnover rate of the head of central bank is used as the actual independence indicator, then CBI is significant in explaining mean and variance of inflation rate in developing countries and in overall sample. Although they detect a significant and negative relation between inflation and legal CBI in developed countries, they cannot detect a significant relation between CBI and inflation in developed countries when turnover rate is used as the CBI indicator. Of particular importance to current study, we use CWN (1992) index called LVAU and LVAW as CBI indicators in our estimations.
Empirical studies in the literature have different implications for the effect of the relation between CBI and inflation on variability of other economic variables such as growth, unemployment and real interest rate. Rogoff (1985) states that the more inflation-averse is the head of the central bank, the less the average inflation is, however the more the toleration in cyclical variability in other economic variables. Alesina and Summers (1993) confirm the idea that as independence level of central banks increases, level of inflation rate and its variability decreases by using the extended version of the Bade and Parkin (1982) scale provided in Alesina (1988). However, in contrast to Rogoff (1985), they claim that while central bank independence brings price stability, it does not have an important effect on the level and variability of real economic variables such as growth, unemployment and real interest rates especially in OECD countries. Thus, similar to the idea of Grilli, Masciandaro and Tabellini (1991), Alesina and Summers (1993) say that higher independence can bring lower inflation without any increase in unemployment.
12
Moreover, Alesina and Gatti (1995) add political uncertainty to the model. In fact, their thesis is that an independent central bank can achieve low inflation rate and low variability of output simultaneously. Therefore, it does not mean that higher independence and low inflation are associated with higher variability in real economic variables.
Eijjfinger et al. (1998) test the relation between four measures of CBI and the mean and variance of macroeconomic variables such as inflation and output growth by using the data of 20 industrial countries for the period of 1972-1992. They look at the elasticity of inflation with respect to CBI and the portion of the covariance between the mean and the variance of inflation, which is explained by CBI. They find evidence that CBI decreases the mean and the variance of inflation but it does not affect the mean and variance of output growth.
De Haan and Kooi (2000) use a proxy for CBI, which is based on the turnover rate of head of central bank for 82 countries and the period of 1980-1989 similar to CWN (1992). They find evidence that there is a relation between CBI and inflation only when the countries that have high inflation are chosen as the sample. They also argue that the idea of Posen (1995), that national differences in inflation are the result of EFOI when used with CBI, is not supported.
Another research which discusses the relation between CBI and inflation in a sample of transition countries is Cukierman, Miller, Neyaptı (2002)3. They introduce
13
new indices for legal independence in 26 formerly socialist economies (transition countries) and they state that these countries preferred to have central banks with higher legal independence level in the 1990s than the level, which the developed countries had in the 1980s. They test whether the inflation is negatively correlated with CBI in this sample of countries. They state that there is not a significant relation between CBI and inflation in the early stages of liberalization, however in the later stages of liberalization, when liberalization is sufficiently high; there is a significant and negative relation between CBI and inflation. They also note the factors like price decontrols, the degree of sustained liberalization and wars that are effective in choosing CBI level.
Neyaptı (2001) analyzes the economic performance of eight eastern European countries4 and the level of CBI after the reforms of 1990s. She states that the CBI and FMD indicators have a significant relation with macroeconomic variables, adding that there is also a positive relation between FMD and CBI. She states that both CBI and FMD are positively related with price stability. Similarly, Maliszewski (2000) uses the sample of transition countries in his estimations. He reviews recent amendments in central bank laws and determines the negative relationship between CBI and inflation in transition countries.
Besides, there are also other studies, which measure the central bank independence. CWN (1992) note these as: Skanland (1984), Parkin (1986), Masciandaro and Tabellini (1988), Bodart (1990), Swinburne and Castello-Branco
4 Eight eastern European countries are Albania, Bulgaria, Czech Republic, Hungary, Poland,
14
(1991), and Leone (1991). CWN also note single or multi-country case studies for central bank independence. Moreover, there are also other case studies concerning the relation between CBI and inflation. Jacome and Vazquez (2005) find evidence for the negative relation between CBI and inflation by using panel regressions and the sample of 24 countries in Latin America and the Caribbean during 1990s. Similarly, Gutierrez (2003) uses Latin American and Caribbean countries and finds that countries that give more legal independence to the central banks in their constitutions are more effective in decreasing inflation than the ones, which do not. Panagiotidis and Triampella (2005) confirm the negative relation between CBI and inflation by using a time series method and the data of Greece before EMU5 membership. They also note the relation between the variability of inflation and CBI. Otero and Ramirez (2004) note a case study of Colombia concerning that the central bank endowed with sufficient independence level after constitutional reform in 1991 had an effect on inflation. In addition to these, Mendonça (2005) considers the relation between inflation and CBI through the example of Brazil.
In developing countries, the relation between CBI and inflation is ambiguous as indicated in CWN (1992). Campillo and Mirron (1997), King and Ma (2001), Forder (1998) etc. claim that there is a suspicion on the robustness of the results of the studies for also developed countries besides developing countries. İsmihan and Özkan (2003) confirm this and give an explanation for this idea. They also argue the reasons why CBI cannot decrease inflation in some of these countries. However, Brumm (2006) claims that the results of the previous studies such as Campillo and
15
Mirron (1997), King and Ma (2001), Forder (1998) are spurious since they do not use a methodology, which takes the “measurement error” in CBI indicators used into account. He states that he detects a significant and negative relation between CBI and inflation even in the sample of developing countries once this error is taken into account.
Posen (1995) considers CBI-inflation relation in the light of EFOI. Until Posen (1995), CBI is used as an exogenous variable. However, in Posen (1995), it is used as an endogenous variable. He states that “the assumption of exogeneity of monetary institutions is false”. He also adds that after Second World War, differences in EFOI caused national differences in CBI levels. He claims that political interests affect monetary policy and thus, CBI and inflation are also affected by EFOI. He considers the variables that determine CBI and states that the relation between CBI and inflation is explained by EFOI. Based on this claim, he argues that the stronger the EFOI, the higher the CBI. Furthermore, Posen (1995) notes that in CWN (1992) a reliable CBI and inflation relation cannot be detected for developing countries since governments in some of these countries use “inflationary monetary policy” regardless of CBI (which means that they support “free hand” in monetary policy). Thus, building on these ideas, Posen (1995) defends the idea that CBI and low inflation are the results of EFOI. According to Posen (1995), in fact, CBI has “distributive policy consequences”, thus price stability which comes with CBI, can be successful if it has the “political support”. He adds that if the “preferences for price stability” do not bring CBI simultaneously, it is not possible to observe negative relation between CBI and inflation in the long run. According to Posen, if
16
these preferences have a universal support, then CBI would be needless for price stability. He states that financial sector itself is sufficient to give the support that central bank independence requires and central bank independence increases, as that support gets stronger. He notes that if the interest groups take price stability as a policy goal, CBI can achieve price stability. He also adds that if a group, which has an interest in “anti-inflationary policy”, has an effect on “counter-inflationary monetary policy” and if this effect increases, CBI level increases and as a result inflation decreases. Hence, financial interests have preferences for price stability. From these ideas, he states that EFOI affects both CBI and inflation simultaneously. Thus, Posen (1995) concludes that CBI and low inflation are the result of EFOI rather than the idea that low inflation is a result of CBI.
Posen (1998) questions the negative relation between CBI and inflation and determines the behavior of public and private sectors in a sample of 17 OECD countries in order to explore the effect of monetary institutions on “disinflationary credibility”. He states that there is no evidence that the cost of disinflation is higher in countries with central banks that are under the influence of political interests, than the ones with independent central banks. He also claims that there is no evidence that CBI prevents the government from collecting seignorage revenues and using the policies for their benefits in the election times. Therefore, Posen (1998) questions the hypothesis stating that the system in which increased CBI promotes lower inflation is the sign of credibility of commitments to price stability.
17
Neyaptı (2003) considers the relation between CBI, inflation and budget deficit. The hypothesis stated in Neyaptı (2003) is that budget deficits are inflationary when the central bank is not endowed with independence and development level of financial markets are not sufficient to reflect “inflationary expectations”. She tests this hypothesis through a panel data study of a sample of 54 countries, which consist of developed and developing countries. The budget deficits affect inflation positively; however, this positive effect is the result of low level of CBI and FMD. She also states that budget deficits have a positive effect on inflation in the countries with high inflation as well as in the countries with low level of inflation when FMD and CBI levels are not sufficient to include the inflationary expectations.
Taking the researches done until now as the basis, we search for the relation between CBI and inflation in the light of FMD. Posen (1995) uses the idea of FMD in order to analyze the relation between CBI and inflation. In this research, first, we replicate the findings of Posen (1995) by using alternative FMD indicators to EFOI of Posen (1995), in order to explain the negative relation between CBI and inflation. We use EFOI as a variable besides FMD indicators and test the hypothesis whether there exist a relation of CBI to FMD and inflation and test whether development level of financial markets affect the relation between CBI and inflation.
Our contribution to the literature is therefore to test Posen’s hypothesis by using a larger data set than Posen and with alternative measures for FMD. Moreover, Posen (1995) states that CBI and the relation between CBI and inflation are the
18
results of EFOI and thus, when both CBI and EFOI are used for explaining inflation, the variable that has a significant effect on inflation is EFOI rather than the CBI. However, we find evidence supporting that there is a significant relation between CBI and inflation when also FMD indicators are used in the estimations.
19
CHAPTER 3
DATA
In order to test our hypotheses, we use the data of Posen (1995) besides our data sets. Posen’s data has decade average observations from 1950 to 1989 for 32 countries (17 OECD and 15 developing countries)6. He uses the variables of federalism (federal), universal banking (univbk), fractionalization (fractn), and regulatory power (regpow) to define, what he calls, effective financial opposition to inflation, EFOI. In addition, he uses dummy variables for three decades (1950s, 1960s, and 1970s), two groups of countries (OECD and Latin America7) and fixed exchange rate regime (FixedX).
Fractionalization is defined by Posen (1995) as the probability that any two randomly chosen legislators that will come from different parties. Federalism is defined as whether the country has a federal government system and this index takes
6 17 OECD countries used in Posen (1995) are Australia, Austria, Belgium, Canada, Denmark, France,
Germany, Greece, Ireland, Italy, Japan, Netherlands, New Zealand, Spain, Switzerland, UK, and US. These countries are considered to be developed countries. Moreover, 15 developing countries are Bolivia, Chile, Colombia, Hong Kong, India, Indonesia, Malaysia, Mexico, Pakistan, the Philippines, Singapore, South Korea, Thailand, Turkey, and Venezuela.
7 Latin America countries are Bolivia, Chile, Colombia, Mexico, and Venezuela. Asian countries are
Hong Kong, India, Indonesia, Malaysia, Pakistan, the Philippines, Singapore, South Korea, Thailand and Turkey. The dummy for Latin American countries will be abbreviated as LatinA.
20
1 if the country has a federal political system and 0 otherwise. Universal banking is the variable, which concerns whether the financial sectors in a country have universal banking system. Posen (1995) states that this variable takes 1 if “the banks are allowed to deal in at least two of securities, insurance, and commercial lending and 0 otherwise”. Regulatory power is the variable measuring to what extent the financial sectors in a country has exposed to the central bank supervisory. Posen (1995) states that this variable takes 1 if “the banking supervision is not under the central bank, 0.5 if it is shared by the central bank and another agency and 0 if it is the central bank’s responsibility”. Lastly, effective financial opposition to inflation index (EFOI) is defined as: “univbk+regpow+federal-fractn”. It ranges between -1 and 3. He estimates whether EFOI has an effect on each of CBI and inflation, rather than considering the relation between CBI and inflation directly. In the estimations run for the purposes of comparison with Posen (1995), we use also EFOI, FixedX and dummy variables used in Posen (1995).
In addition to these, data set consists of the variables of CBI, alternative FMD indicators, inflation, and an additional dummy for Asia since we also extend the data set to also include more countries. FMD indicators can be listed as follows: the ratio of the banking sector credit to GDP (BSCRGDP), the ratio of credit provided to private sector to banking sector total credit (PRVTCRBS), the ratio of credit provided to private sector to GDP (PRVTCRGDP), and the ratio of M2 to GDP (M2GDP). Besides, we have interactive variables of CBI, which are explained in detail in Appendix 1. Moreover, as the CBI indicator, we use the equal-weighted aggregate index of legal independence: LVAU from CWN (1992) in the estimations
21
with 17-, 32- and 66-country data sets8. Data for FMD indicators and inflation are obtained from World Bank database (World Bank Development Indicators [WDI])9.
We conduct our analysis in various different subsets of data. We construct both decade averages and annual data for 66 countries, ranging from 1960 to 1989; and period average and annual data of transition countries from 1989 to 1998. For one set of estimations, we use 17-country and 32-country10 data as in Posen (1995) for the purposes of comparing them with Posen’s estimations. Moreover, we also use a larger data set that consists of 66 countries, which include also 31 countries11 in Posen (1995). These 66 countries, which are documented in Table 1 in the Appendix 2, are chosen according to the list of countries in the data of CBI taken from CWN (1992). We do not include transition countries in this set due to unavailability of CBI data for the years of 1960-1989. Besides, we have annual and period average data for the set of transition countries from 1989 to 1998 since transition countries have CBI data available only for these periods in CMN (2002). Transition countries are documented in Table 2 in the Appendix 2. Moreover, we have some years and countries where data are not available for the FMD indicators, thus panel data set is unbalanced.
8 We use the legal weighted aggregate index: LVAW from CMN (2002) in the estimation with
transition countries.
9 BSCRGDP, PRVTCRGDP, and M2GDP have been directly taken from WDI. PRVTCRBS has been
calculated as the ratio of PRVTCRGDP to BSCRGDP (=PRVTCRGDP/BSCRGDP).
10 Countries are Australia, Austria, Belgium, Canada, Denmark, France, Germany, Greece, Ireland,
Italy, Japan, Netherlands, New Zealand, Spain, Switzerland, UK, US, Bolivia, Chile, Colombia, Hong Kong, India, Indonesia, Malaysia, Mexico, Pakistan, the Philippines, Singapore, South Korea, Thailand, Turkey, and Venezuela. First 17 countries are developed and OECD countries, rest is considered to be developing countries. The main criterion is development rather than the membership of OECD.
22
In the estimations run for comparison purposes (with 17- and 32-country decade average data), we use inflation and CBI taken from the data set of Posen (1995). However, in other estimations (with annual data and 66-country data), CBI is taken from CWN (1992) and we use inflation defined as D=[(inflation*100)/(inflation+1)]12 in order to make it range between 0% and 100% (as in CWN, 1992). We choose to use D to smooth out extreme values.
In the estimations using annual data, we use the variables (EFOI and FixedX) of Posen (1995) by repeating the decade average observations for each year of that decade. In doing this, we assume that the variables we use (EFOI and FixedX) are constant for the years of the decade since they do not change frequently from year to year.
Table 1 below displays the availability of variables used with each data set.
12 We use Consumer Price Index taken from WDI in order to calculate inflation, and inflation is used
for obtaining the variable of D as indicated above part. Inflation is taken as a decimal number. For instance, if inflation is 0.1 (or 10%), the variable of D is [(0.1*100)/(0.1+1)] = 9.09%. So, we take D= 9.09 in our estimations. FMD measures (BSCRGDP, PRVTCRGDP, PRVTCRBS and M2GDP) are used in a similar way. For instance, if the ratio for any FMD is, say, 0.1 (or 10%); then we take it as “10” in our estimations.
23 Table 1: Variables Used in Each Data Set
Data Sets Variables 17-country sample 32-country sample 66-country sample Transition countries sample CBI √ √ √ √ BSCRGDP √ √ √ √ PRVTCRGDP √ √ √ √ PRVTCRBS √ √ √ √ M2GDP √ √ √ √ EFOI √ √ 1960s √ √ √ 1970s √ √ √ OECD √ √ LatinA. √ √ Asia √ FixedX √ √ BSCRGDP*CBI √ √ √ √ PRVTCRGDP*CBI √ √ √ √ PRVTCRBS*CBI √ √ √ √ M2GDP*CBI √ √ √ √ EFOI*CBI √ √ CBI*DBSCRGDP √ √ √ √ CBI*DPRVTCRGDP √ √ √ √ CBI*DPRVTCRBS √ √ √ √ CBI*DM2GDP √ √ √ √ CBI*DEFOI √ √
24
CHAPTER 4
METHODOLOGY
First, we replicate the estimations of Posen (1995) concerning the relation between CBI and EFOI. In Tables 1 and 3 of Posen (1995), he determines the relation between CBI and EFOI through ordinary least square (OLS) estimation method with a decade average data set consisting of 17 OECD and 32 countries respectively. In Tables 2 and 4, he determines the relation between inflation and EFOI through weighted least square (WLS) method by using the decade average data set of 17 OECD and 32 countries. In the estimations with 32-country data set, Posen (1995) does not include the observations that have 30% or more inflation rate. All estimations of Posen (1995) are displayed in the Appendix 3.
Posen (1995) uses a sample of data for 17 OECD countries from 1950 to 1989 in his estimations. However, we have the data set of the FMD variables from 1960 to 1989. Thus, for comparison purposes, we replicate the estimations in Table 1 of Posen (1995) by using robust estimation and the data of 1960 to 1989. As a result, we conclude that the lack of the data of 1950s and the estimation with robust standard errors (White-Heteroscedasticity Corrected) do not change the results
25
extensively. Tables 1.1, 1.2, and 1.3 in Appendix 3 indicate that the results and significance levels do not change if the estimated coefficients of variables in these tables are compared with the ones in Table 1 of Posen (1995) in Appendix 3.
As indicated in data part, we have three types of data set for non-transition countries (17 countries, 32 countries, and 66 countries): 17-country and 32-country data sets are used for comparison to Posen (1995) estimations and 66-country data set is used to investigate these relations in an extended data set, with increased number of observations.
Before proceeding with our panel estimations, we first perform Hausman (1978) test to decide whether we can use random effect (versus fixed effect) for country specific variables. Next, we test the significance of FMD indicators and determine whether FMD is a significant variable when used along with EFOI, in explaining CBI. We test this hypothesis through OLS method with robust standard errors on the samples of three data sets. The equation that is estimated to test this hypothesis is:
CBIit =α1+ α2(FMD)it + α3(EFOI)it+ α4(1960s)it
+ α5(1970s)it+ α6(FixedX)it+ α7(OECD)it
+ α8(LatinA.)it+ α9(Asia)it (1)
By using 17-country data set, we estimate equation (1) without country dummy variables, as in Posen (1995), since it only includes the OECD countries.
26
Moreover, by adding our FMD indicators, we have the opportunity to compare the results with Posen (1995).
For the 32-country data set, we estimate equation (1) without FixedX and Asia dummy. Similarly, by adding alternative FMD indicators, we get the opportunity to compare the results with Posen’s.
For the set of 66 countries, we estimate equation (1) without EFOI and FixedX since they are not available. Moreover, 66-country data set is used in addition to Posen (1995) data sets in order to utilize a larger sample to estimate the relations between CBI, FMD and inflation. In other words, 17-country and 32-country data sets and the equations estimated with these data sets are used for comparison with Posen (1995) whereas 66-country data set is used for determining the relation between our alternative indicators and CBI on a larger sample.
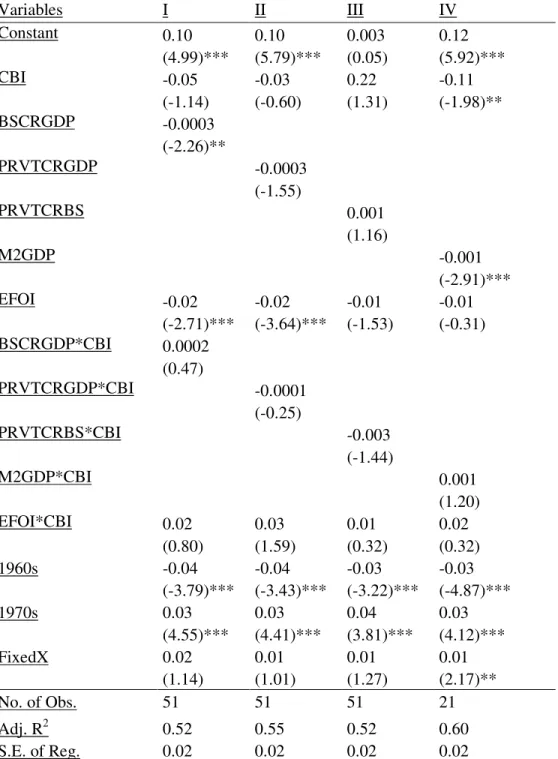
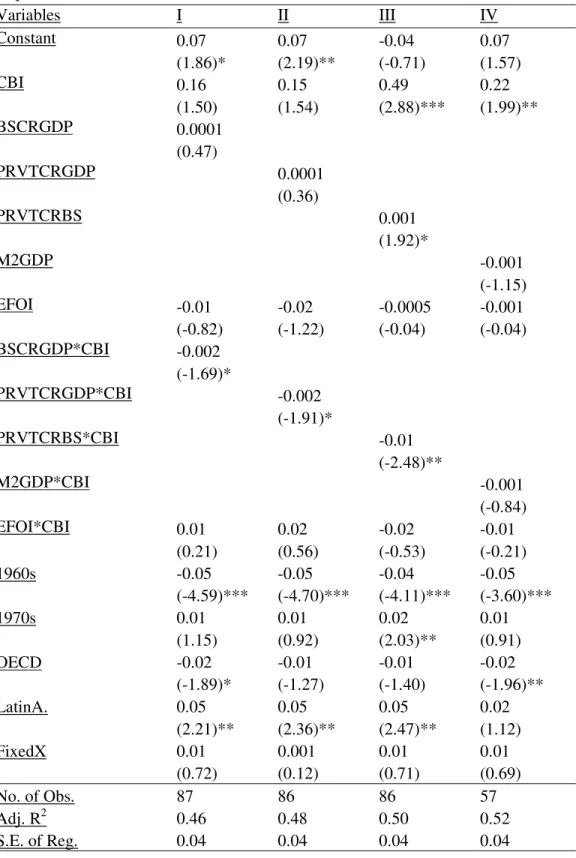
Next, we investigate the relation between inflation and CBI by using OLS estimation technique with robust standard errors. To do this, we use interactive variables as well as the rest of the control variables. The equations estimated for this relation are:
27
Inflationit =α1+ α2(CBI)it+ α3(EFOI)it+ α4(FMD)it
α5(EFOI*CBI)it+ α6(FMD*CBI)it+
α7(OECD)it+ α8(LatinA.)it+ α9(Asia)it +
α10(1960s)it+ α11(1970s)it+ α12(FixedX)it (2)
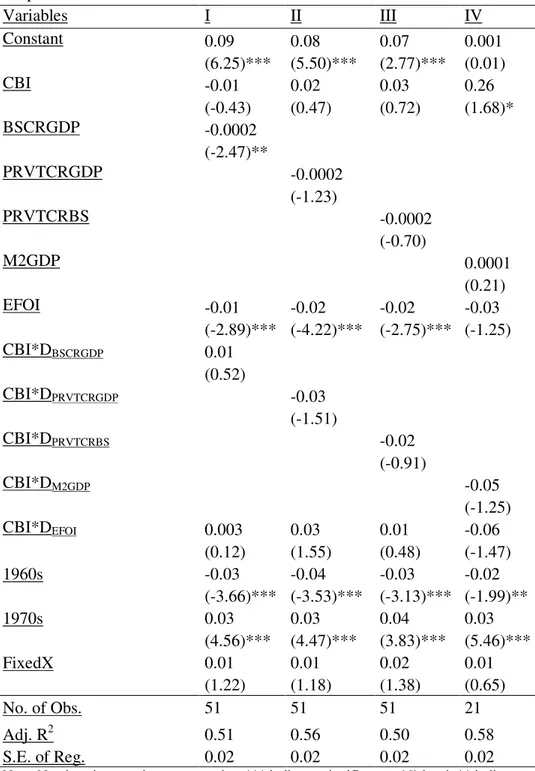
Inflationit =α1+ α2(CBI)it+ α3(EFOI)it+ α4(FMD)it
α5(CBI*DEFOI)it+ α6(CBI*DFMD)it+
α7(OECD)it+ α8(LatinA.)it+ α9(Asia)it +
α10(1960s)it+ α11(1970s)it+ α12(FixedX)it (3)
Equations (2) and (3) include the interactive variables of CBI. These are interaction of CBI with FMD indicators and dummy variables defined for each FMD indicator. We use these interactive variables in order to test the joint effect of CBI and FMD. The dummy variables defined for each FMD indicator are explained in Appendix 1.
In the estimations of equations (2) and (3), we use OLS method13 with robust standard errors. As done in Posen (1995), we do not include the observations with inflation higher than 30%. He states that countries with 30% or more inflation in a decade can be can be considered as a hyperinflationary country. Moreover, he adds that in these countries, “economic structure” and “financial sectors” might gain the ability to adapt to hyperinflation and thus, effective financial opposition to inflation
13 For estimated equations of (2) and (3), we cannot get results of Hausman Test since the model and
data do not support this test, thus we cannot determine whether we can use random or fixed effect model.
28
is not developed in these countries. Rather, the expected relationship between inflation and financial sectors change according to circumstances.
In addition, it is important to note that Neyaptı (2003) discusses that CBI and FMD have two-directional causality and hence one might expect CBI to lead to higher FMD. Although we find that FMD has a significant and positive effect on CBI in general, two directional causality of FMD and CBI may cause endogeneity bias that is not addressed in this paper.
29
CHAPTER 5
EMPIRICAL RESULTS
5.1. Empirical Results for Non-transition Countries
5.1.1. Hausman Test Results:
In this part, we test whether random effect estimation model (versus fixed effect) is appropriate for the relation between CBI and FMD (or EFOI of Posen). In order to do this, we perform Hausman test for the equations below.
CBIit =α1+ α2(FMD)it (4)
CBIit =α1+ α2(EFOI)it (5)
Table 2 below displays the results of the test for equations (4) and (5) in case of each of the 17, 32, and 66-countries’ annual and decade average data. Accordingly, we generalize the results of the test and assume that the result will be applicable to equation (1) also.
30
Table 2a: Hausman Test Results (Fixed Effect versus Random Effect) Dependent variable is CBI (with decade average data)
17-Country Sample 32-Country Sample 66-Country Sample Variables chi-square p-value chi-square p-value chi-square p-value BSCRGDP 2131.65 0.00 641.58 0.00 1927.95 0.00 PRVTCRGDP 1832.23 0.00 563.38 0.00 1369.82 0.00 PRVTCRBS 409.50 0.00 418.22 0.00 5192.25 0.00
M2GDP NA NA 85.27 0.00 631.87 0.00
EFOI 2928.96 0.00 13120.41 0.00 NA NA
NA: Not Applicable.
Table 2b: Hausman Test Results (Fixed Effect versus Random Effect) Dependent variable is CBI (with annual data)
17-Country Sample 32-Country Sample 66-Country Sample Variables chi-square p-value chi-square p-value chi-square p-value BSCRGDP 4925.92 0.00 7184.09 0.00 34336.42 0.00 PRVTCRGDP 5175.21 0.00 7280.31 0.00 28462.66 0.00 PRVTCRBS 1668.77 0.00 3030.47 0.00 178526.20 0.00 M2GDP 801.13 0.00 1841.84 0.00 14142.75 0.00
EFOI 3548.99 0.00 NA NA NA NA
NA: Not Applicable.
According to Table 2, we state that random effect panel estimation is not appropriate for all of our data sets since all chi-square statistics are significant at 1% level. The result of Hausman test says that fixed effect is a better choice for equation (4) and (5) with each data set. However, in order to use fixed effect correctly, we should have an exhaustive data set, which will give us right results.
31
5.1.2. CBI-FMD Relationship: Decade Average Data
In this part, we have the results of OLS estimation method with each of the 17, 32, and 66-country data sets in decade averages, reported in Table 3a, 3b, and 3c, respectively.
Table 3a: OLS estimation method with the decade average data of 17 OECD countries.
Dependent variable is CBI.
Variables I II III IV Constant 0.31 0.22 0.26 0.03 (5.82)*** (5.96)*** (4.93)*** (0.35) BSCRGDP -0.0003 (-0.73) M2GDP -0.001 (-1.17) PRVTCRGDP 0.0003 (0.38) PRVTCRBS 0.003 (2.64)*** EFOI 0.12 0.17 0.11 0.10 (4.66)*** (11.01)*** (4.30)*** (4.90)*** 1960s 0.001 0.01 0.01 0.00004 (0.02) (0.55) (0.22) (0.001) 1970s -0.02 -0.01 -0.005 -0.01 (-0.51) (-0.24) (-0.10) (-0.14) FixedX -0.03 -0.02 -0.02 0.01 (-0.51) (-0.71) (-0.28) (0.13) No. of Obs. 51 21a 51 51 Adj. R2 0.33 0.84 0.32 0.44 S.E. of Reg. 0.13 0.06 0.13 0.12
Note: Numbers in parentheses are t-ratios; *** indicates significant at 1% level; ** indicates significant at 5% level and * indicates significant at 10% level.
a: We do not have 51 observations for the estimation with M2GDP due to unavailability of data for some of 17 OECD countries that use Euro as currency.
32
We observe that in each estimated equation EFOI is significant at 1% significance level as in Posen (1995). However, FMD indicators are insignificant in all estimated equations except for the one with PRVTCRBS, which has a positive sign as expected and is significant at 1% significance level. Note that the coefficient of PRVTCRBS indicates that a 1 percentage point increase in this variable leads to 0.3 percentage point increase in CBI. Moreover, no dummy variable is significant.
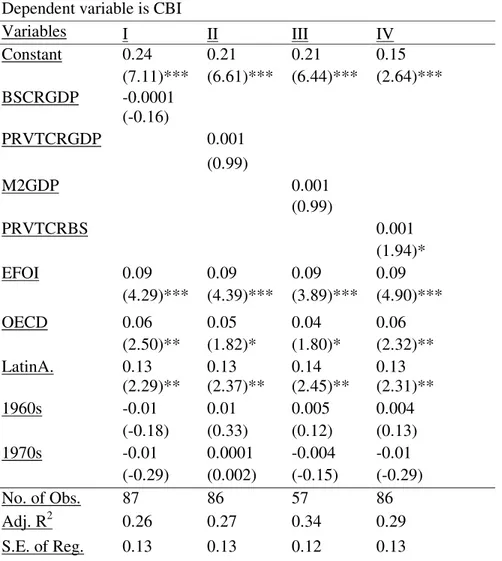
Table 3b: OLS estimation method with the decade-average data of 32 countries
Dependent variable is CBI
Variables I II III IV Constant 0.24 0.21 0.21 0.15 (7.11)*** (6.61)*** (6.44)*** (2.64)*** BSCRGDP -0.0001 (-0.16) PRVTCRGDP 0.001 (0.99) M2GDP 0.001 (0.99) PRVTCRBS 0.001 (1.94)* EFOI 0.09 0.09 0.09 0.09 (4.29)*** (4.39)*** (3.89)*** (4.90)*** OECD 0.06 0.05 0.04 0.06 (2.50)** (1.82)* (1.80)* (2.32)** LatinA. 0.13 0.13 0.14 0.13 (2.29)** (2.37)** (2.45)** (2.31)** 1960s -0.01 0.01 0.005 0.004 (-0.18) (0.33) (0.12) (0.13) 1970s -0.01 0.0001 -0.004 -0.01 (-0.29) (0.002) (-0.15) (-0.29) No. of Obs. 87 86 57 86 Adj. R2 0.26 0.27 0.34 0.29 S.E. of Reg. 0.13 0.13 0.12 0.13
Note: Numbers in parentheses are t-ratios; *** indicates significant at 1% level; ** indicates significant at 5% level and * indicates significant at 10% level.
33
The estimation results in table 3b reveal that EFOI and PRVTCRBS are significant in explaining CBI as was the case for the formerly reported results in table 3a. Similarly, we cannot observe a significant effect of period dummies on CBI. However, we have country dummies, which are all significant. In OECD and Latin America countries, CBI is higher than the rest of the countries.
As a result, we observe that PRVTCRBS is the only significant FMD measure in explaining CBI, when used along with EFOI in the estimations with 17- and 32- country data sets.
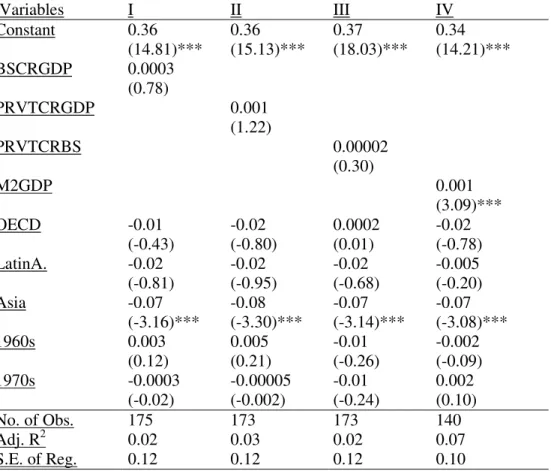
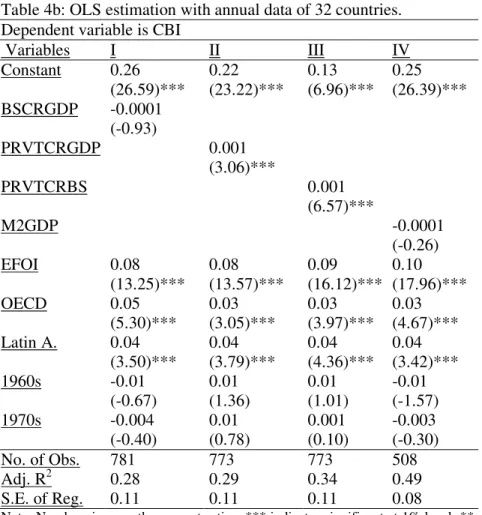
Table 3c: OLS estimation method with the decade-average data of 66 countries. Dependent variable is CBI.
Variables I II III IV Constant 0.36 0.36 0.37 0.34 (14.81)*** (15.13)*** (18.03)*** (14.21)*** BSCRGDP 0.0003 (0.78) PRVTCRGDP 0.001 (1.22) PRVTCRBS 0.00002 (0.30) M2GDP 0.001 (3.09)*** OECD -0.01 -0.02 0.0002 -0.02 (-0.43) (-0.80) (0.01) (-0.78) LatinA. -0.02 -0.02 -0.02 -0.005 (-0.81) (-0.95) (-0.68) (-0.20) Asia -0.07 -0.08 -0.07 -0.07 (-3.16)*** (-3.30)*** (-3.14)*** (-3.08)*** 1960s 0.003 0.005 -0.01 -0.002 (0.12) (0.21) (-0.26) (-0.09) 1970s -0.0003 -0.00005 -0.01 0.002 (-0.02) (-0.002) (-0.24) (0.10) No. of Obs. 175 173 173 140 Adj. R2 0.02 0.03 0.02 0.07 S.E. of Reg. 0.12 0.12 0.12 0.10
Note: Numbers in parentheses are t-ratios; *** indicates significant at 1% level; ** indicates significant at 5% level and * indicates significant at 10% level.
34
Table 3c displays the results of the estimations with 66-country data set. According to this table, M2GDP is the only FMD measure, which is significant at 1% level in explaining CBI. The other variable, which is also significant in all estimated equations, is Asia country dummy variable: in Asia, CBI is significantly lower than other countries. Results also draw a consistent pattern for period dummies. Similar to table 3a and 3b, we cannot detect a significant effect of period dummy variables on CBI.
As a conclusion, the estimations with the FMD indicators in the data sets of 17 countries and 32 countries reveal that PRVTCRBS has an explanatory power in explaining CBI besides the EFOI of Posen (1995). However, by using 66-country data set, we find that M2GDP is the only FMD indicator, which adds power to the model of Posen that explains CBI. In addition, CBI is lower in Asian countries, whereas it is higher in OECD and Latin American countries. Lastly, 1960s and 1970s do not have a significant effect on CBI.
5.1.3. CBI-FMD Relationship: Annual Data
Besides the estimations with decade average data, we also perform all the estimations with annual data of 17-country, 32-country and 66-country samples that are reported in Table 4a, 4b and 4c, respectively.
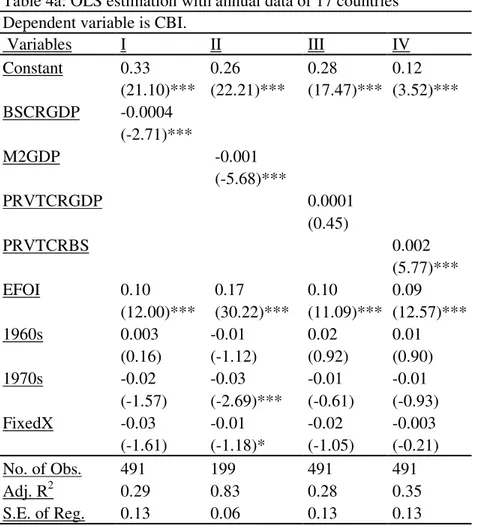
35
Table 4a: OLS estimation with annual data of 17 countries Dependent variable is CBI.
Variables I II III IV Constant 0.33 0.26 0.28 0.12 (21.10)*** (22.21)*** (17.47)*** (3.52)*** BSCRGDP -0.0004 (-2.71)*** M2GDP -0.001 (-5.68)*** PRVTCRGDP 0.0001 (0.45) PRVTCRBS 0.002 (5.77)*** EFOI 0.10 0.17 0.10 0.09 (12.00)*** (30.22)*** (11.09)*** (12.57)*** 1960s 0.003 -0.01 0.02 0.01 (0.16) (-1.12) (0.92) (0.90) 1970s -0.02 -0.03 -0.01 -0.01 (-1.57) (-2.69)*** (-0.61) (-0.93) FixedX -0.03 -0.01 -0.02 -0.003 (-1.61) (-1.18)* (-1.05) (-0.21) No. of Obs. 491 199 491 491 Adj. R2 0.29 0.83 0.28 0.35 S.E. of Reg. 0.13 0.06 0.13 0.13 Note: Numbers in parentheses are t-ratios; *** indicates significant at 1% level; ** indicates significant at 5% level and * indicates significant at 10% level.
We observe similar results in Table 4a, which reveals that EFOI and PRVTCRBS are significant at 1% level with positive sign in all estimated equations. Although we find out that M2GDP and BSCRGDP are significant at 1% level, we get negative coefficients for these variables. According to the theory, we can state that there is a positive relation between FMD and CBI. This result can be due to the small sample problem.
36
Table 4b: OLS estimation with annual data of 32 countries. Dependent variable is CBI
Variables I II III IV Constant 0.26 0.22 0.13 0.25 (26.59)*** (23.22)*** (6.96)*** (26.39)*** BSCRGDP -0.0001 (-0.93) PRVTCRGDP 0.001 (3.06)*** PRVTCRBS 0.001 (6.57)*** M2GDP -0.0001 (-0.26) EFOI 0.08 0.08 0.09 0.10 (13.25)*** (13.57)*** (16.12)*** (17.96)*** OECD 0.05 0.03 0.03 0.03 (5.30)*** (3.05)*** (3.97)*** (4.67)*** Latin A. 0.04 0.04 0.04 0.04 (3.50)*** (3.79)*** (4.36)*** (3.42)*** 1960s -0.01 0.01 0.01 -0.01 (-0.67) (1.36) (1.01) (-1.57) 1970s -0.004 0.01 0.001 -0.003 (-0.40) (0.78) (0.10) (-0.30) No. of Obs. 781 773 773 508 Adj. R2 0.28 0.29 0.34 0.49 S.E. of Reg. 0.11 0.11 0.11 0.08
Note: Numbers in parentheses are t-ratios; *** indicates significant at 1% level; ** indicates significant at 5% level and * indicates significant at 10% level.
Differently from the estimations above, in table 4b we have PRVTCRGDP, which is significant at 1% level besides PRVTCRBS when used along with EFOI. In addition, in OECD and Latin American countries, CBI is higher than the others. Moreover, any change in time variables does not have a significant effect on CBI.
37
Table 4c: OLS estimation with the annual data of 66 countries Dependent variable is CBI
Variable I II III IV Constant 0.35 0.36 0.37 0.33 (43.26)*** (46.65)*** (53.50)*** (41.99)*** BSCRGDP 0.0004 (3.22)*** PRVTCRGDP 0.0006 (3.89)*** PRVTCRBS 0.00001 (1.26) M2GDP 0.001 (9.13)*** OECD -0.02 -0.03 -0.002 -0.02 (-1.91)* (-2.82)*** (-0.19) (-2.60)*** Latin A. -0.02 -0.02 -0.02 -0.004 (-2.55)** (-3.08)*** (-2.01)** (-0.51) Asia -0.08 -0.08 -0.07 -0.07 (-9.53)*** (-10.17)*** (-9.28)*** (-9.13)*** 1960s 0.001 0.002 -0.01 -0.002 (0.12) (0.29) (-1.45) (-0.24) 1970s 0.01 0.003 -0.002 0.004 (0.69) (0.47) (-0.32) (0.64) No. of Obs. 1642 1646 1631 1284 Adj. R2 0.06 0.06 0.05 0.11 S.E. of Reg. 0.12 0.12 0.12 0.10
Note: Numbers in parentheses are t-ratios; *** indicates significant at 1% level; ** indicates significant at 5% level and * indicates significant at 10% level.
Table 4c displays the results of the estimations run on the sample of 66 countries. This time, we have PRVTCRGDP, BSCRGDP and M2GDP, which are significant at 1% level with positive sign. Similar to previous arguments, in Asia; CBI is lower compared to other countries. Moreover, we also observe that OECD and LatinA. country dummy variables have negative effect on CBI when Asia dummy variable is added to model. However, we find that CBI is higher in these countries than the others when Asia dummy is excluded from the model (see tables 4b and 3b).