HOW PRICE MAVENS PERCEIVE VALUE OF PRODUCTS? A STUDY ON PERVAL SCALE
Kalender Özcan ATILGAN*, Ayşe ŞAHİN** ÖZET
Pazarlama literatüründe, pazar uzmanı tüketicilerin dar kapsamda bir yorumu olan fiyat konusunda bilgili (uzman) tüketiciler, az ilgi görmüş bir konudur. Geçmişte gerçekleştirilen araştırmalar ağırlıklı olarak, fiyat konusunda bilgili tüketicileri bilgi aramaya ve bu bilgileri diğer kişiler ile paylaşmaya iten güdülerin neler olduğuna odaklanmıştır. Fiyat konusunda bilgili tüketicilerin ürünleri değerlendirirken algıladıkları değerler bağlamında da anlaşılması gerekmektedir. Bu çalışmada, fiyat konusunda bilgili tüketici düzeyleri ile algılanan değer boyutları (PERVAL ölçeği) arasındaki ilişkilerin belirlenmesi amaçlanmaktadır. Sonuçlar, fiyat konusunda bilgili tüketiciler arasında, kalite/performans, duygusal değerler ve fiyat/değer için para boyutları açısından anlamlı farklılıklar olduğunu göstermektedir.
Anahtar Sözcükler: Fiyat Konusunda Bilgili Tüketici, Algılanan Değer, PERVAL Ölçeği.
ABSTRACT
Price mavenism, which is “a narrow interpretation of market mavenism” has received little attention in marketing literature. Historically, research has been mainly focused on what motivates price mavens to engage in information search and to share their knowledge with others. It should also be understood price mavens by means of their value perceptions when they are evaluating products. This study aims to determine the interrelationships between price maven levels and perceived value dimensions (PERVAL scale). The results indicate that there are significant differences between price mavens by means of quality/performance, emotional values and price/value for money.
Key Words: Price Mavenism, Perceived Value, PERVAL Scale.
* Mersin Üniversitesi, UTİYO İşletme Bilgi Yönetimi Bölümü, Mersin,
E-posta: [email protected]
** Mersin Üniversitesi, İİBF İşletme Bölümü, Mersin, E-posta:
72
INTRODUCTION
The marketing literature includes evidence that consumers help each other in the marketplace (Price, Feick, and Guskey, 1995: 255). Market mavens have been defined as “individuals who have information about many kinds of products, places to shop, and other facets of markets, and initiate discussions with consumers and respond to requests from consumers for market information” (Feick and Price 1987: 85). Maven is a Yiddish word referring a neighborhood expert (Hazelwood, Lawson, and Aitken 2009: 793). Besides being sources of information, market mavens also seek the information (Higie, Feick, and Price, 1987: 265). Clark, Goldsmith, and Goldsmith (2008: 245) argue that essence of mavenism lies in the value mavens place on marketplace information and especially their social nature.
Market mavens actively involved in transmitting all types of marketplace information (Solomon, 2004: 390). It can be acknowledged that the literature on the market maven is less developed compared to innovativeness and opinion leadership (Clark and Goldsmith, 2005: 290). In this study, as one of fundamental marketplace information, a narrower perspective of the market maven (namely, price maven) has been considered. Lichtenstein, Ridgway, and Netemeyer (1993) define price mavenism as the “degree to which an individual is a source for price information for many kinds of products and places to shop for the lowest prices, initiates discussions with consumers, and responds to requests from consumers for marketplace price information” (p. 235).
One of the primary goals of marketers is to enhance target customers’ willingness to purchase products (Agarwal and Teas, 2001: 1). Thus, it is important for managers to understand what customer’s value and where they should focus their attention to achieve market place advantage (Sweeney and Soutar, 2001: 204). Buyers’ perceptions of value represent a relative tradeoff between the quality or benefits they perceive in the product and the sacrifice they perceive by paying the price (Monroe, 1990: 46). From definitions, it can be inferred that value focuses on two factors as price and quality (Lichtenstein and Burton, 1990). Some researchers have defined the concept of “value” in terms consistent with this perspective (Lichtenstein, Ridgway, and Netemeyer, 1993: 235).
Since consumer perceptions of quality, price, and value are backbone of consumer buying behavior, perceived value is the consumer’s overall assessment of the utility of a product based on
73
perceptions of what is received and what is given (Zeithaml, 1988: 14). In spite of price mavenism is more related with perceived value, there has still been a gap, on how price mavens’ perceive the value of products. The present paper attempts to reduce this gap by exploring the interrelationships between the four perceived value dimensions and price mavenism groups.
CONCEPT OF PRICE MAVENISM
Market mavens may be responding to felt obligations to be knowledgeable about product- and shopping-relevant information (i.e., to be ‘good shoppers’) and they may be anticipating that such knowledge will serve to facilitate social exchanges and conversations (Mooradian, 1996). Market mavens eagerly share their marketplace knowledge with other consumers and are often sought by other consumers to get information (Clark and Goldsmith, 2005: 297). Because they understand the social and symbolic meaning of many products, like to stay updated and find shopping enjoyable (Fitzmaurice 2011: 73).
Wiedmann, Walsh, and Mitchell (2001) found that mavens tend to be more conscious of price and value than non-mavens. Similarly, by being price and value conscious, price mavens want to be smart shoppers (Byun and Sternquist, 2010: 288). They are not mainly concerned with price but instead strive to find the best, quality products (Fitzmaurice, 2011: 74). According to the study of Ivens, Müller and Guese (2009), value-oriented shoppers are characterized by high value consciousness and these consumers see themselves as price mavens and have highest score on price-quality scheme.
With this in mind, the current study focuses on the price mavenism concept that is a narrow interpretation of the market mavenism concept (Moore and McGowan, 2001: 3). Price mavens are price experts and are used to talk about prices, thus it can be expected that price mavens to make fewer faults and therefore have a lower fraction of false information (Hinz, 2007).
Price mavenism differs from market mavenism in three respects: First, price mavenism is related only with price-information searching and price-sharing behavior. Second, it has traditionally been regarded as a negative perception of price -i.e. price is negatively related to purchase possibility. Finally, price mavenism has social (or cultural) roots (Byun and Sternquist, 2010: 279). According to Tatzel (2002: 116), an individual may become a price maven by enjoying price comparison
74
shopping which they drive both price and non-price (such as hedonic) benefits.
USING PERVAL SCALE DIMENSIONS TO DEFINE PRICE MAVENS
Perceived value is the essential result of marketing activities (Sánchez-Garcia, Moliner-Tena, Callarisa-Fiol, and Rodríguez-Artola, 2007: 157). Customer perceived value is understood as a trade-off between benefits received by the customer (such as economic, quality, social and relationship) and sacrifices made (such as price, time, effort, risk and convenience) by customer (Helkkula, Kelleher, and Pihlström, 2012; Sánchez-Garcia, Moliner-Tena, Callarisa-Fiol and Rodríguez-Artola, 2007).
Perceived Value (PERVAL), a multi-dimensional scale developed by Sweeney and Soutar (2001), to measure the perceived worth of consumer products to the purchaser. By use of PERVAL scale, researchers attempted to explain complex consumption behaviors and also measure cognitive aspects possibly influencing general product purchases (Lee et al., 2011). Unlike previous measures, PERVAL scale includes both utilitarian (value for money and quality) and hedonic (emotional and social value) components (Sweeney and Soutar, 2001: 216). The PERVAL scale was found to be both reliable and valid in a pre- as well as in a post-purchase context (Orth, Wolf, and Dodd, 2005). Perceived Emotional Value
Consumers’ perceived value beyond the observable physical value of the product (emotional value) refers to their affective reactions to a brand (Supphellen, 2000). Holbrook and Hirschman (1982) argued for emotional aspects of the consumption process, including symbolic, hedonic, and esthetic aspects. For brand evaluations, mavens considered criteria directly relating to the functional quality of products more important than those related to more emotional or less substantive criteria (Williams and Slama, 1995: 16). On the other hand, Jin and Sternquist (2004) found that price mavenism was positively related to hedonic shopping value such as excitement, pride, and sensory involvement and accomplishment. Jin, Sternquist, and Koh (2003) noted that a positive relationship between price mavenism and hedonic shopping value seems likely. Thus;
H1: There are differences in emotional perceived value of consumers among different price mavenism levels.
75
Perceived Social ValueSocial value refers to “the utility derived from the product’s ability to enhance social self-concept” (Sweeney and Soutar, 2001: 211). Price et al. (1987) argue that “information has both entertainment and social value” for market mavens (p. 333). By collecting marketplace information with the intent of sharing it with other people, market mavens can gain social returns and happiness from their search behavior (Jin and Sternquist 2004; Tsai and Lee, 2009). Finally, Byun and Sternquist (2010) contend that price mavens regard price as an indicator of symbolic values such as social status or prestige. Thus;
H2: There are differences among different price mavenism levels by means of perceived social value.
Perceived Quality/Performance
Consumers may judge the quality of the products with the price information and this information may influence the products’ perceived value in the mind of consumer (Hsu et al., 2010: 990). It is expected that when consumers run across top quality at the lowest possible price, they will feel excitement, fun, and even a sense of pride in being a smart shopper (Jin, Sternquist, and Koh, 2003: 387). Consumers high on market mavenism are expected to hold more accurate price-quality perceptions than those of low market mavenism across product categories (Lichtenstein and Burton, 1990). Thus;
H3: There are differences among different price mavenism levels by means of perceived quality/performance.
Price/Value for Money
Perceived value or value for money may be defined as perceived level of product quality relative to the price paid (Di Nisio and Di Battista, 2010; Gallarza and Saura, 2006). To some consumers for whom the monetary sacrifice is pivotal, anything that reduces the monetary sacrifice will increase the perceived value of the product (Zeithaml, 1988: 14). For example, Williams, Slama, and Rogers (1985) thought that recreational shoppers are more likely value oriented than other shoppers. Ohanian and Tashchian (1992: 40) defined mavens as “consumers who are sensitive to market information, with high involvement, recreational shopping values and get the best value for the money”. As consumers demand greater quality for lower prices (Moore and McGowan, 2001: 4), different levels of price mavenism has different price/value for money perceptions. Thus:
76
H4: There are differences among different price mavenism levels by means of price/value for money.
Regarding existence of four demographic variables (age, gender, income and educational levels), four hypotheses were developed as follow:
H5: There are differences among different price mavenism levels by means of demographic characteristics of consumers.
H5a: There are differences among different price mavenism levels by means of age.
H5b: There are differences among different price mavenism levels by means of gender.
H5c: There are differences among different price mavenism levels by means of income.
H5d: There are differences among different price mavenism levels by means of educational levels.
METHOD
A survey was designed to collect data regarding consumer perceived value and price mavenism. The original six-item market maven scale (Feick and Price, 1987) was modified by Lichtenstein, Ridgway and Netemeyer (1993) to focus a narrower perspective of the market maven by considering only one piece of marketplace information, price. In this study, the revised form of market maven scale (price mavenism scale by Lichtenstein, Ridgway and Netemeyer, 1993) was used. Also, PERVAL, 19-item scale assessing customers’ perceptions of the value of a consumer durable good at a brand level developed by Sweeney and Soutar (2001) was used. For each item, participants rated their responses on a five-point Likert scale (1 = strongly disagree; 5 = strongly agree).
The survey instrument was pre-tested on 30 individuals to evaluate clarity of the questions, face validity and reliability. After pre-test, the questionnaire was revised. The final questionnaire was conducted from September through October 2012 in the Mersin area of Turkey. A convenience sample of 421 respondents completed the questionnaire through a face to face interview. Of this number, 412 usable questionnaire data were analyzed using statistical software package.
ANALYSIS AND RESULTS
The aim for conducting factor analysis is to identify the underlying (latent) dimensions (Hair, Celsi, Money, Samouel and Page, 2011: 390). To determine the factorability of the data, the data was checked for by using the Kaiser-Meyer-Olkin (KMO) measure of sampling adequacy and
77
Bartlett’s test of Sphericity. KMO, a measure of sampling adequacy should be .70 or above to consider the sample as adequate (Meyers, Gamst and Guarino, 2006: 518). In this study, the Kaiser–Meyer–Olkin (KMO) value was found to be .851, and and Bartlett's test was significant (X²=5201.363, p = .000).
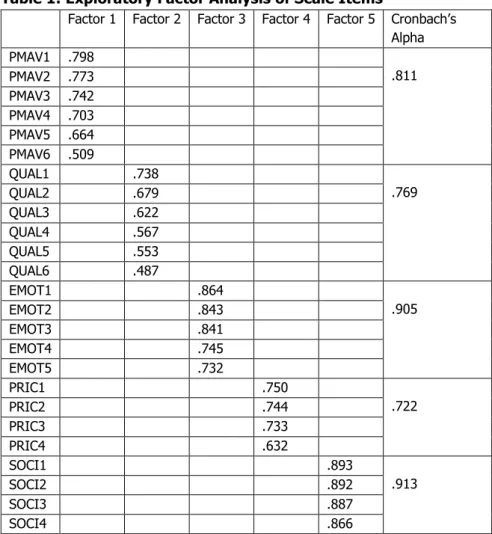
Table 1: Exploratory Factor Analysis of Scale Items
Factor 1 Factor 2 Factor 3 Factor 4 Factor 5 Cronbach’s Alpha PMAV1 .798 .811 PMAV2 .773 PMAV3 .742 PMAV4 .703 PMAV5 .664 PMAV6 .509 QUAL1 .738 .769 QUAL2 .679 QUAL3 .622 QUAL4 .567 QUAL5 .553 QUAL6 .487 EMOT1 .864 .905 EMOT2 .843 EMOT3 .841 EMOT4 .745 EMOT5 .732 PRIC1 .750 .722 PRIC2 .744 PRIC3 .733 PRIC4 .632 SOCI1 .893 .913 SOCI2 .892 SOCI3 .887 SOCI4 .866
Note: PMAV1-6, items for price mavenism; QUAL1-6, items for quality/performance;
EMOT1-5, items for emotional values; PRIC1-4, items for price/value for money; SOCI1-4, items for social values. The principal components factor analysis with varimax rotation method was utilized to obtain the factor solution.
As can be seen from the Table 1, the factor analysis has confirmed that 25 scale items yielded five distinct factors: Factor 1: price mavenism,
78
factor 2: quality/performance, factor 3: emotional values, factor 4: price/value for money, factor 5: social values.
Reliabilities of the scales were assessed using Cronbach’s alpha. Cronbach’s alpha exceeding the value of .70 is known as an acceptable reliability coefficient (Iacobucci and Duhachek, 2003). In this study, all Cronbach’s Alpha values exceeded .70, thus the reliabilities of the scales are satisfactory. Since it is worth creating a second version of the scale simply by collapsing the scaled variable into small number of categories (de Vaus, 2004: 129), trichotomization which is to divide the scale into three equal-sized groups was used. It is usually not desirable to dichotomize or trichotomize a good scale type of variable (Morgan, Griego, Gloeckner, 2001: 68). However, trichotomization can provide a meaningful comparison of three groups. Similar to the previous studies (Abratt, Nel, and Nezer, 1995; Chelminski and Coulter, 2002; Feick and Price, 1987; Slama and Williams, 1990) on mavenism, it was decided to trichotomize the respondents into three equal-sized groups based on their price maven scores. Thus, the price mavenism scale was recoded as low price mavens value of 1 (mean=2.64), those medium level of price mavens value of 2 (mean=3.59), high price mavens as value of 3 (mean=4.29).
After trichotomization, ANOVA was used to measure the differences among price mavenism groups by means of emotional, social, quality/performance and price/value for money dimensions. For interpreting ANOVA results, test for homogeneity of variances assumption should be satisfied (Carver and Nash, 2011: 141). To validate the homogeneity of variance assumption, the results of Levene’s test is conducted. The Levene’s test revealed that the homogeneity of variances assumption between groups is met for quality/performance (Levene’s statistic= 2.925, p=.055> .05), emotional values (Levene’s statistic= 2.212, p=.111> .05), price/value for money (Levene’s statistic= 2.414,
p=.091> .05). On the other hand, the Levene’s test revealed that the variances were not homogenous for social values (Levene’s statistic= 4.454, p=.012< 0.05).
F-values for the analysis are significant for quality/performance, emotional values and price/value for money, post hoc comparisons between price maven groups are performed using Tukey test (see Table 2).
79
Table 2: ANOVA Table for PERVAL ScaleMeans (standard deviations) of price mavens
Price Maven Levels
Quality Emotional Value Social
1 (n=134) 3.88 (.63) 3.91 (.74) 3.47 (.66) 2.74 (.93)
2 (n=159) 4.11 (.55) 4.17 (.56) 3.59 (.56) 2.83 (1.09)
3 (n=119) 4.32 (.47) 4.43 (.48) 3.82 (.64) 3.22 (1.08)
Summary of ANOVA Table
df Mean sq. F Sig. Quality Between groups 2 6.009 19.305 .000 Within groups 409 .311 Emotional Between groups 2 8.268 22.498 .000 Within groups 409 .367 Value Between groups 2 3.903 10.302 .000 Within groups 409 .379 Social Between groups 2 8.092 7.492 .001 Within groups 409 1.080
Post-hoc Tests (Tukey)
PERVAL Dimension Price
Maven Level I
Price Maven
Level j Quality Emotional Value
1 2 .002* .001* .190
1 3 .000* .000* .000*
2 3 .005* .002* .008*
* p< .05
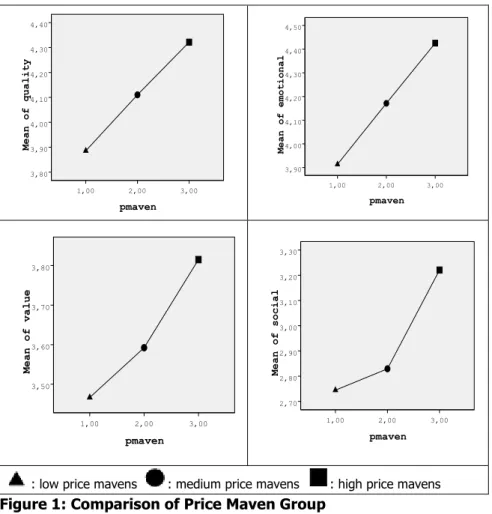
Except price/value for money between low price mavens and medium price mavens, there were significant differences between price maven groups. Thus hypotheses H1, H3, and H4 are supported while H2 is not supported. High price mavens have the highest means of quality/performance (4.32), emotional values (4.43) and price/value for
80
money (3.82). Figure 1 represents the differences of price maven groups by means of PERVAL dimensions.
: low price mavens : medium price mavens : high price mavens
Figure 1: Comparison of Price Maven Group
To analyze the differences among different price mavenism levels by means of age of consumers, the Levene’s test was performed. The Levene’s test revealed that the homogeneity of variances assumption between groups is met for age (p=.429> .05). In a previous study, age was shown to have a significant but weak influence on market (price) mavenism (Summers, Lorterapong, and Morgan, 2006). But in this study,
F-value for age was not significant (see Table 3, F=.311, p= .733).
pmaven 3,00 2,00 1,00 Mean of quality 4,40 4,30 4,20 4,10 4,00 3,90 3,80 pmaven 3,00 2,00 1,00 Mean of emotional 4,50 4,40 4,30 4,20 4,10 4,00 3,90 pmaven 3,00 2,00 1,00 Mean of value 3,80 3,70 3,60 3,50 pmaven 3,00 2,00 1,00 Mean of social 3,30 3,20 3,10 3,00 2,90 2,80 2,70
81
Table 3: ANOVA Table for AgeMeans and standard deviations of price mavens ages
Mean Standard D.
1 (n=134) 30.93 9.185
2 (n=159) 30.36 8.868
3 (n=119) 31.21 9.591
Summary of ANOVA Table
df Mean sq. F p Age Between groups 2 26.239 .311 .733 Within groups 409 84.350 p< .05
Due to the ordinal nature of data (Corder and Foreman, 2009: 117), Kruskal-Wallis test is conducted to test the education levels and income levels among three groups of price mavens (see Table 4). Kruskal-Wallis test revealed significant differences for educational levels (χ²=8.513, p= .014).
Table 4: Kruskal-Wallis Test Results for Demographics (Income and Educational Level)
Demographics Grouping variable: Price maven level Mean ranks χ² p
Income 1 195.18 1.912 .384 2 212.17 3 211.67 Educational level 1 186.08 8.513 .014* 2 208.76 3 226.48 * p< .05
In the study of Feick and Price (1987), mavens found to be a slightly lower average education level. Mann Whitney U tests were performed to see whether there are significant differences between price maven groups (see Table 5). Only one difference are reached as statistically significant on the educational level, where there was a difference between low price mavens and high price mavens in their ranked scores (Z=-2.836, p= .005).
82
Table 5: Comparisons of Price Maven Groups by Means of Educational Levels
Price Maven Level I
Price Maven Level j Mann-Whitney U Z p 1 2 9454.500 -1.786 .074 1 3 6435 -2.836 .005* 2 3 8621 -1.371 .170 * p< .05
It is known that females gain more social returns from sharing price information with one another (Tsai and Lee, 2009). Women were somewhat more likely to be mavens (Feick and Price, 1987). However, as it can be seen in Table 6, difference in price mavenism levels between women and men has not been found significant.
Table 6: Comparison of Gender by Means of Price Mavenism
Female (n=177) Male (n=235) t p Mean 1.977 1.953 -.310 .757 St.Dev. .79 .78 p< .05 CONCLUSION
Commodity prices in the market play a relevant role in consumer decision-making; they influence what, when, where and how much consumers buy (Aalto-Setälä and Raijas, 2003). Since market mavens are good targets for messages about marketing mix changes (Abratt, Nel and Nezer, 1995), price mavens, specific form of market mavens attempt to communicate information about prices of goods. Thus, the focus of price mavens studies should be directed on how they perceive value of products or services.
This study contributes to the understanding the perceived value of price mavens. To measure value perceptions, PERVAL scale was used and consistent with previous studies (e.g. Wiedmann, Walsh and Mitchell, 2001; Feick and Price, 1987), price mavens are divided into three subcategories as low price mavens, medium price mavens, and high price mavens to evaluate the perceived value differences among price maven levels. According to the results of this study, significant differences have been found between price mavens by means of quality/performance, emotional values and price/value for money. Also for all PERVAL dimensions, high price mavens have the highest means. However,
83
significant difference has only been found between the high price mavens and low price mavens by means of educational levels.
Such as market mavens, price mavens can also play an influential role in shaping consumers’ purchase decisions (Feick and Price, 1987). It is known that word-of-mouth communication plays significant role in the communication process (Abratt, Nel, and Nezer, 1995). Companies can use price mavens, who are also known as “experts of good value for money combination” for attracting new customers. Thus, marketing managers need to understand price mavens and know how to communicate with them as well as optimizing pricing levels relative to competing offerings and emphasize value orientation of their products.
The results of this study cannot be generalized to all Turkish consumers because it was applied only in Mersin district. In further research, it would be useful to detect antecedents of price mavens within a general model which may consider psychological or socio-demographic variables. Also, product categories can be considered in analysis of price mavenism and cross-cultural studies may be conducted in different cities or countries.
REFERENCES
Aalto-Setälä, V., Raıjas, A (2003). Actual Market Prices and Consumer Price Knowledge. The Journal of Product and Brand Management, 12 (2/3), ABI/INFORM Global, 180-192.
Abratt, R., Nel, D., Nezer, C. (1995). Role of the Market Maven in Retailing: A General Marketplace Influencer. Journal of Business and Psychology, 10 (1), 31-55.
Agarwal, S., Teas, R.K. (2001). Perceived Value: Mediating Role of Perceived Risk. Journal of Marketing Theory and Practice, 9 (4), 1-14.
Byun, Sang-Eun, Sternquıst, B. (2010). Reconceptualization of Price Mavenism: Do Chinese Consumers Get a Glow When They Know?. Asia Pacific Journal of Marketing and Logistics, 22 (3), 279-293.
Carver, R.H., Nash, J.G. (2011). Doing Data Analysis with SPSS: Version 18.0, 5th edition, Boston: Duxbury Press.
Chelmınskı, P., Coulter, R. (2002). Examining Polish Market Mavens and Their Attitudes Toward Advertising. Journal of East-West Business, 8 (1), 77-90.
84
CLARK, R.A. And GOLDSMITH, R.E. (2005). Market Mavens: Psychological Influences. Psychology & Marketing, 22 (4), 289-312.
Clark, R.A., Goldsmıth, R.E., Goldsmıth, E.B. (2008). Market Mavenism and Consumer Self-Confidence. Journal of Consumer Behaviour, 7, 239-248.
Corder, G.W., Foreman, D.I. (2009). Nonparametric Statistics for Non-Statisticians: A Step-by-Step Approach. New Jersey: John Wiley & Sons, Inc.
De Vaus, D. (2004). Analyzing Social Science Data: 50 Key Problems in Data Analysis. Thousand Oaks, California: Sage Publications Ltd. Dı Nısıo, R., Dı Battısta, T. (2010). An Application of The Structural
Equation Models to Customer Satisfaction and Loyalty Assessment. Electronic Journal of Applied Statistical Analysis: Decision Support Systems and Services Evaluation, 1 (1), 42-53. Feıck, L.F., Prıce, L.L. (1987). The Market Maven: A Diffuser of
Marketplace Information. The Journal of Marketing, 51 (1), 83-97.
Fıtzmaurıce, J. (2011). Market Mavens’ Motivations to Acquire Information. The Marketing Management Journal, 21 (1), 71-83. Gallarza, M.G., Saura, I.G. (2006). Value Dimensions, Perceived Value,
Satisfaction and Loyalty: An Investigation of University Students’ Travel Behaviour. Tourism Management, 27 (3), 437-452.
Hair, Jr., J.F., Celsi, M.W., Money, A.H., Samouel, P., Page, M.J. (2011). Essentials of Business Research Methods. 2nd edition, New York: M.E.Sharpe, Inc.
Hazelwood, E., Lawson, R., Aıtken, R. (2009). An Essential Guide to Audience Development. Marketing Intelligence & Planning, 27 (6), 789-804.
Helkkula, A., Kelleher, C., Pıhlström, M. (2012). Characterizing Value as an Experience: Implications for Service Researchers and Managers. Journal of Service Research, 15 (1), 59-75.
Hıgıe, R.A., Feıck, L.F., Prıce, L.L. (1987). Types and Amount of Word-of-Mouth Communications about Retailing. Journal of Retailing, 63 (3), 260-278.
Hınz, O. (2007). False Information in Internet Auction Communities. 40th Hawaii International Conference on System Sciences, Waikoloa, Big Island, HI, USA, 178.
85
Holbrook, M.B., Hırschman, E.C. (1982). The Experiential Aspects of Consumption: Consumption Fantasies, Feelings and Fun. Journal of Consumer Research, 9 (2), 132-140.
Hsu, C.-H., Hsu, S.-Y., Chen, C.-H., Chen, C.-Y. (June, 2010). The Purchasing Intention of Industrial Lubricating Oil. 7th International Conference on Services Systems and Services Management-ICSSSM, National Institute of Informatics, Tokyo, Japan, 988-993.
Iacobuccı, D., Duhachek, A. (2003). Advancing Alpha: Measuring Reliability with Confidence. Journal of Consumer Psychology, 13 (4), 478-487.
Ivens, B., Müller, B., Guese, K. (2009). A Taxonomy of Price Behaviour. in Advances in Consumer Research Vol. 36, eds. Ann L. McGill and Sharon Shavitt, Duluth, MN: Association for Consumer Research, 1005-1005.
Jın, B., Sternquıst, B. (2004). Shopping is truly a joy. The Service Industries Journal, 24 (6), 1-18.
Jın, B., Sternquıst, B., Koh, A. (2003). Price as Hedonic Shopping. Family and Consumer Sciences Research Journal, 31 (4), 378-402. Lee, D., Traıl, G.T., Kwon, H.H., Anderson, D.F. (2011). Consumer Values
versus Perceived Product Attributes: Relationships among Items from the MVS, PRS, and PERVAL Scales. Sport Management Review, 14 (1), 89-101.
Lıchtensteın, D.R., Burton, S. (1990). An Assessment Of The Moderating Effects of Market Mavenism and Value Consciousness On Price-Quality Perception Accuracy. in Advances in Consumer Research, Vol. 17, Eds. Marvin E. Goldberg, Gerald Gorn, and Richard W. Pollay, Provo, UT : Association for Consumer Research, 53-59. Lıchtensteın, D.R., Rıdgway, N.M., Netemeyer, R.G. (1993). Price
Perceptions and Consumer Shopping Behavior: A Field Study. Journal of Marketing Research, 30 (2), 234-245.
Meyers, L.S., Gamst, G., Guarino, A.J. (2006). Applied Multivariate Research: Design and Interpretation. California: Sage Pub. Monroe, K.B. (1990). Pricing: Making Profitable Decisions. New York:
McGraw-Hill.
Mooradıan, T.A. (1996). The Five Factor Model and Market Mavenism. in Advances in Consumer Research, Vol. 23, Eds. Kim P. Corfman and John G. Lynch Jr., Provo, UT : Association for Consumer Research, 260-263.
86
Moore, M., Mcgowan, K.M. (2001). The Polish Consumer’s Concept of Price as a Marketplace Cue. Journal of Textile and Apparel, Technology and Management, 2 (1), 1-10.
Morgan, G.Arthur, Griego, O.V., Gloeckner, G.W. (2001). SPSS for Windows: An Introduction to Use and Interpretation in Research. New Jersey: Lawrence Erlbaum Associates, Inc.
Ohanıan, R., Tashchıan, A. (1992). Consumers’ Shopping Effort and Evaluation of Store Image Attributes: The Roles of Purchasing Involvement and Recreational Shopping Interest. Journal of Applied Business Research, 8 (4), 4-49.
Orth, U.R., Wolf, M.Mcgarry, Dodd, T.H. (2005). Dimensions of Wine Region Equity and Their Impact on Consumer Preferences. Journal of Product & Brand Management, 14 (2), 88-97.
Prıce, L.L., Feıck, L.F., Hıgıe, R.A. (1987). Information Sensitive Consumers and Market Information. Journal of Consumer Affairs, 21 (2), 328-341.
Prıce, L.L., Feıck, L.F., Guskey, A. (1995). Everyday Market Helping Behavior. Journal of Public Policy & Marketing, 14 (2), 255-266. Rao, V.R. (1984). Pricing Research in Marketing: The State of the Art.
The Journal of Business, 57 (1), Part 2: Pricing Strategy, S39-S60.
Sánchez-Garcıa, J., Molıner-Tena, M.A., Callarısa-Fıol, L., Rodríguez-Artola, R.M. (2007). Relationship Quality of an Establishment and Perceived Value of a Purchase. The Service Industries Journal, 27 (2), 151-174.
Slama, M.E., Wıllıams, T.G. (1990). Generalization of the Market Maven’s Information provision Tendency across Product Categories. Advances in Consumer Research, 17, 48-52.
Solomon, M. (2004). Consumer behavior: Buying, having, and being. 6th ed. Englewood Cliffs, New York: Pearson Prentice-Hall.
Summers, J., Lorterapong, A., Morgan, M.J. (2006). Factors Influencing Consumer Intentions to Purchase Seasonally Discounted Athletic Footwear in Thailand. International Conference of the Academy of Business Administration, Munich, Germany, 185-196.
Supphellen, M. (2000). Understanding Core Brand Equity: Guidelines for In-Depth Elicitation of Brand Associations. International Journal of Market Research, 42 (3), 319-364.
Sweeney, J.C., Soutar, G.N. (2001). Consumer Perceived Value: The Development of a Multiple Item Scale. Journal of Retailing, 77 (2), 203-220.
87
Tatzel, M. (2002). Money Worlds’ and Well-Being: An Integration of Money Dispositions, Materialism and Price-Related Behavior. Journal of Economic Psychology, 23, 103-126.
Tsaı, D., Lee, H.-C. (2009). Demographics, Psychographics, Price Searching and Recall in Retail Shopping. The Service Industries Journal, 29 (9), 1243-1259.
Wıedmann, K.-P., Walsh, G., Mıtchell, V.-W. (2001). The Mannmaven: An Agent for Diffusing Market Information. Journal of Marketing Communications, 7 (4), 195–212.
Wıllıams, T., Slama, M.E., Rogers, J. (1985). Behavioral Characteristics of the Recreational Shopper and Implications for Retail Management. Academy of Marketing Science Journal of the Academy of Marketing Science, 13 (3), 307-316.
Wıllıams, T.G., Slama, M.E. (1995). Market Mavens’ Purchase Decision Evaluative Criteria: Implications for Brand and Store Promotion Efforts. Journal of Consumer Marketing, 12 (3), 4-21.
Zeithaml, V.A. (1988). Consumer Perceptions of Price, Quality, and Value: A Means-End Model and Synthesis of Evidence. The Journal of Marketing, 52 (3), 2-22.