Digital Proceeding of ICOCEE – CAPPADOCIA2015
S. Sahinkaya and E. Kalõpcõ (Editors) Nevsehir, TURKEY, May 20-23, 2015
Investigation of Air Pollution Parameter Variation on Between 2007-2014: The Case of Igdir (Turkey) Dogru S.*1, Bayram T.2,Argun Y.A.3 and Altikat A.4
1, 3
Environmental Health Programme, Vocational School of Health Services, Igdir University, TURKEY. (E-mail: [email protected], [email protected])
2
Department of Environmental Engineering, Engineering Faculty, Yuzuncu Yil University, TURKEY. (E-mail: [email protected])
4
Department of Civil Engineering, Engineering Faculty, Igdir University, TURKEY. (E-mail: [email protected])
ABSTRACT
In the study it has been investigated the annual and winter’s season air pollution values of Igdir centrum between the years 2007-2014 by means of the data obtained from the meteorological observation station found in the same city. For this purpose, it has been used the values of sulfur dioxide (SO2) and particle substance (PM10) in
Igdir city center between 2007 and 2014, which were obtained from the web site of the Ministry of Environment and Urban Planning. Measurement values have been analyzed in deference to Air Quality Evaluation and Management Regulation and limit values determined by the European Union (EU). When analysing the results of air qualities of Igdir between 01 January 2007 and 31 December 2014, the average PM10 has been found out 119,5 µg/m3 and the average of SO2 has been determined as 12,7 µg/m3. When analysing the results of air
qualities for heating season between 01 October 2006 and 31 March 2014, the average PM10 has been found out 173,3 µg/m3 and the average of SO2 has been ascertained as 19,1 µg/m3. The annual PM10 and SO2 value
averages have been found lower than the heating season averages. When the obtained average values were compared with the Long-term Turkey Limit Value (LTL) it has been observed that PM10 was above the expected limit values between 2007 and 2014 and SO2 did not exceed the expected value limits within the same
years. Simultaneously, when EU and LTL values were compared, annual PM10 values have been observed to be exceeded for all years and SO2 values have been observed to be acceptable only in 2011. According to the
results, measurements for the refinement of the air quality of Igdir must be taken. The Ministry of Environment and Urban Planning must increase the air pollution inspections and take the necessary precautions during the days when critical limit is exceeded.
Keywords: Air pollution, Igdir, Particulate matter 10 (PM10), SPSS, sulfur dioxide (SO2).
12. INDRODUCTION
Air pollution can be described as the rise of pollutants, which can be found in the atmosphere in the form of dust, gas, smoke, odor and water vapor, in the amount that would harm people, other beings and objects [1].
In our country, particularly for the supply of heating energy and due to the socio-economic conditions, the effects of the excessive use of cheap but low-calorie coal containing high rate of sulphur, the gradual increase in the number of motor vehicles, and the harsh meteorological conditions that develop occasionally, have led to a state in which a number of precautions against the air pollution, are needed to be taken [2].
In winter 1952, London, the air pollution that was combined with fog, led to an increase in the pollution level of the inactive air layer above the city and the inactive weather that was unable to clear itself, caused the death of 4000 people at such a short notice of only two weeks. Due to the air pollution occurred in the year 1948 in Donara village located in Pennsylvania state of USA, 600 out of 14.000 residents living in the valley, had fallen
sick. Because of the pollutants released into the atmosphere via dense fog and factories, 20 out of 600 patients lost their lives. In 1963, New York, again a similar air pollution caused the death of 300 people [3]. It is a known fact that the air pollution had first came to the agenda in our country in 1950; and it has been informed that because of the air pollution, the demand in coal and petroleum has increased and harsh air pollution events do take place, particularly in large cities such as Istanbul, Ankara and Izmir [4].
Air pollution studies in our country have been launched by the Ministry of Health for the first time, and again managed by the Ministry of Health until 2007. After this date, the Ministry of Environment and Forestry has taken over the duty of monitoring the air quality. SO2 and PM10 data acquired as of 1990, were used to be
published by Turkish Statistical Institute on provincial basis [5]. And as of January 2012, Air Quality news bulletins have been started to be published by the General Directorate for Environmental Management of the Ministry of Environment and Urban Planning.
Igdir lowled, is at the height of 800-900 meters and, it is in a position of a basin that is surrounded by mountains. Mountainous masses surrounding Igdir lowled from South with the mountain chain located between Erzurum-Kars region and Yukarõ Murat-Van region of the Eastern Anatolia Region, are composed of extinct volcanoes from west to east [6]. Due to being in a position that is surrounded by high mountains, having a low wind speed and because of the inversion layer formed above the city, air pollution poses a significant problem in Igdir in winter season. Moreover, wind erosion occur in the various places of the city [7].
In this study, annual air pollution values, and values related to the heating season in Igdir province between 2007-2014, were analyzed retrospectively. SO2 and PM10 concentration values were used as pollution levels.
These values analyzed, were compared to the limit values determined by several institutions. As a result of the study; taking the pollution levels into consideration, the reasons for high pollution levels and the precautions needed to be taken, were mentioned.
2. MATERIAL AND METHODS
The data involved in this study, used the measurement values acquired by the website of the Ministry of Environment and Urban Planning [8]. Using the measurement results of SO2 and PM10 concentrations belonging
to the years 2007-2014; hourly, 24-hour time, monthly, annual values and the values related to the heating season, were calculated via statistical parameters. These statistical parameters are the mean, standard deviation, minimum and maximum values of SO2 and PM10 concentrations. Heating season is calculated by the use of the
data belonging to the period from October 1st and March 31th. In this study, heating season data of eight periods, were used. The data related to the first heating season, 1 October 2006 and 31 March 2007; and to the last heating season, 1 October 2013 and 31 March 2014, were used. Statistical parameters were calculated and compared to “Air Quality Evaluation and Management Regulation” (AQEMR) and to European Union (EU) limit values. SPSS package program was used for the statistical analyses in this study.
Air Quality Index (AQI), makes the air quality-related information easy and comprehensible by rating the air quality as good, medium, sensitive, unhealthy, bad and dangerous in accordance with the pollutant concentrations in the air. AQI has been calculated for 5 main pollutants that cause air pollution. These are; particulate matter (PM10), carbon monoxide (CO), sulphur dioxide (SO2), nitrogen dioxide (NO2) and ozone
(O3) [9]. Amongst the pollutants that change the natural composition of air and thus pollute it, SO2 and PM10
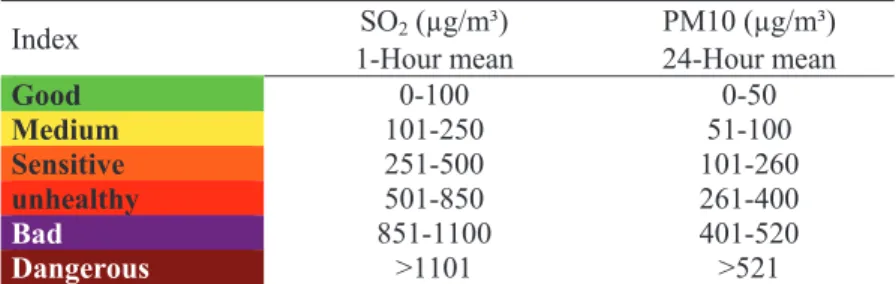
measurement decides the level of pollution, and it has been suggested to all the countries in the world, after being regarded as sufficient by World Health Organization [10]. In Table 1, national Air Quality Index limit values of SO2 and PM10 concentrations, are given.
Table 1. National AQI limit values
Index SO2 (µg/m³) PM10 (µg/m³)
1-Hour mean 24-Hour mean
Good 0-100 0-50 Medium 101-250 51-100 Sensitive 251-500 101-260 unhealthy 501-850 261-400 Bad 851-1100 401-520 Dangerous >1101 >521
In our country, procedures and principles related to air quality management, have been determined by AQEMR, which is full-compatible with EU environmental legislation. With this regulation, limit values mainly regarding 13 pollutants (SO2, PM10, NOx,..), that are necessary to be provided in order for human health and the
PM10 values in 24-hour period, have been given in accordance with AQEMR [12].
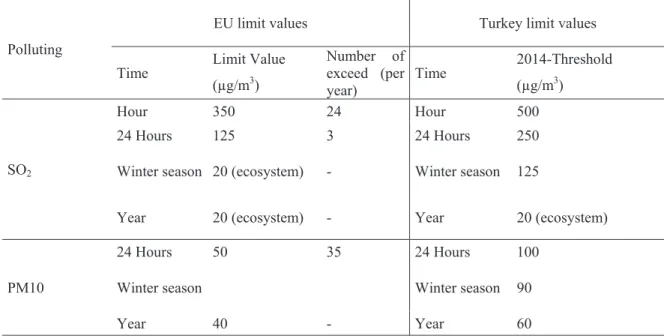
Air quality limit values are the levels that are expressed with the concentration units determined by considering the harmful effects that change when the air pollutants in the atmosphere come together, in order for the protection of human health and for the prevention of short and long-term adverse effects on the environment. Between these two, Long-Term (Annual) Limit (LTL) Value; is the mean of all the measurement results which should not be exceeded within a year. Short-Term (24-Hour) Limit (STL) Value; are the values that should not exceed 95% of the measurement results when sorted by the quantity of the digital values of all the measurement results, in means of 24-hour period or within a year [12]. In Table 3, limit values of Turkey in 2014 and EU limit values of SO2 and PM10 concentrations envisaged in AQEMR, are given [13].
Table 2. Mean warning threshold limits values in 24-hour period, according to the regulations AQEM
Warning Threshold SO2 (µg/m³) PM10 (µg/m³) 24-Hour Mean Primary Standard 500 260 Seconder Standard 850 400 Tertiary Standard 1100 520 Quaternary Standard 1500 650
Table 3. Limit values of Turkey , according to regulations of AQEM, and EU limit values
Polluting
EU limit values Turkey limit values
Time
Limit Value Number of exceed (per year) Time 2014-Threshold (µg/m3) (µg/m3) SO2 Hour 350 24 Hour 500 24 Hours 125 3 24 Hours 250
Winter season 20 (ecosystem) - Winter season 125
Year 20 (ecosystem) - Year 20 (ecosystem)
PM10
24 Hours 50 35 24 Hours 100
Winter season Winter season 90
Year 40 - Year 60
In the evaluation of pollutant parameters in this study, Table 1,2 and 3 were used, and also the comparison of limit values, was made.
3. RESULTS AND DISCUSSION
By using SO2 and PM10 measurement data related to 24-hour period, which were acquired for Igdir city centre
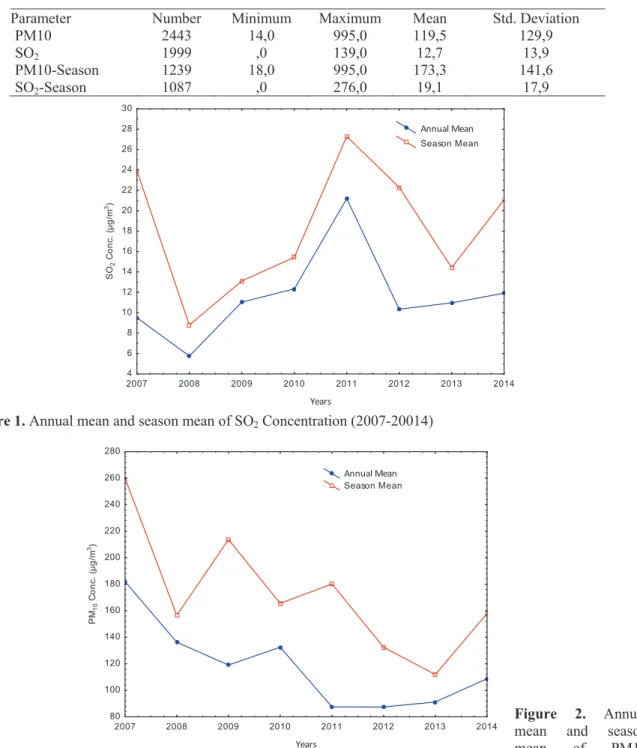
between the years 2007-2014, annual mean values and mean values related to the heating season, were calculated, and the results are given in Table 4, also in Figures 1 and 2.
Between 01 January 2007 and 31 December 2014, 24-hour period mean values of SO2, were measured in 1999
out of 2922 days in total (68,4%). Annual mean SO2 level was determined as 12,7 µg/m3. Annual mean SO2
value was determined as 139 µg/m3. For the period between 2007 and 2014, PM10 mean was measured in 2443 out of 2922 (83,6%) days in total. Annual mean PM10 level was determined as 119,5 µg/m3. Annual mean PM10 values changed between 14-995 µg/m3, and standard deviation was determined as 129,9 µg/m3. In 2009, maximum value was determined as 995 µg/m3.
Between 01 October 2006 and 31 March 2014, mean values of SO2 in 24-hour period for the heating season,
were measured in 1087 out of 1458 (74.6%) days in total. The mean SO2 level was 19,1 µg/m3. SO2 level
changed between 0-276 µg/m3 range, standard deviation was determined as 17,9 µg/m3, and maximum value in the year 2006, was determined as 276 µg/m3. PM10 mean for the heating season, was measured in 1239 out of 1458 (85%) days in total, and mean PM10 value was determined as 173,3 µg/m3. PM10concentration changed between 18-995 µg/m3 range, and standard deviation was determined as 141,6 µg/m3.
Table 4. Means of 24- hour and seasonal measurement of igdir air quality
Parameter Number Minimum Maximum Mean Std. Deviation
PM10 2443 14,0 995,0 119,5 129,9 SO2 1999 ,0 139,0 12,7 13,9 PM10-Season 1239 18,0 995,0 173,3 141,6 SO2-Season 1087 ,0 276,0 19,1 17,9 2007 2008 2009 2010 2011 2012 2013 2014 Years 4 6 8 10 12 14 16 18 20 22 24 26 28 30 S O2 C o n c . (µ g /m 3) Annual Mean Season Mean
Figure 1. Annual mean and season mean of SO2 Concentration (2007-20014)
Figure 2. Annual mean and season mean of PM10 Concentration (2007-20014)
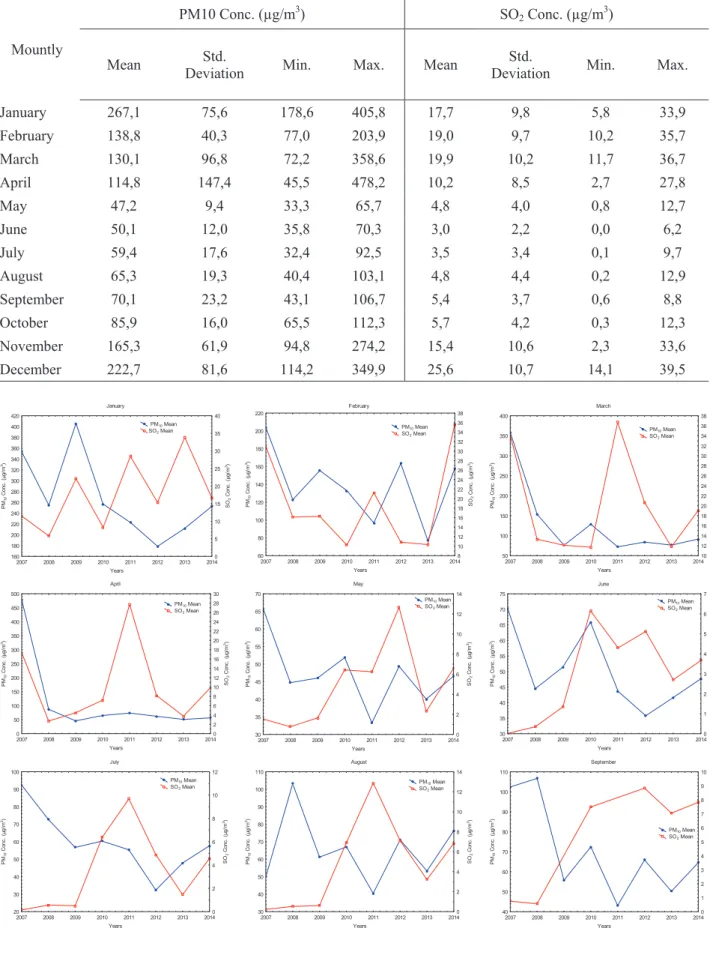
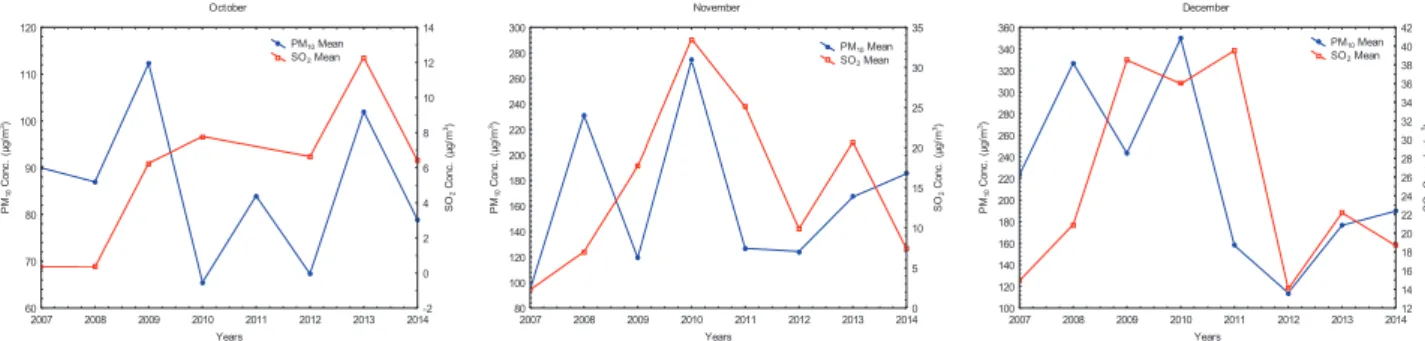
Between 2007-2014, monthly mean variations of SO2 and PM10 values were calculated, and these values are
given in Table 5. Monthly mean values of SO2 and PM10 concentrations by years, are given in Figure 3.
Between 2007-2014, the highest monthly mean SO2 value was observed in December (25 µg/m3) and the lowest
2007 2008 2009 2010 2011 2012 2013 2014 Years 80 100 120 140 160 180 200 220 240 260 280 P M1 0 C o n c . (µ g /m 3) Annual Mean Season Mean
monthly mean concentration was observed in July (3 µg/m3). The highest monthly mean values of PM10 concentration, were observed in January (267 µg/m3); and the lowest monthly mean values of PM10 concentration, were observed in May (47 µg/m3). it was found out that the most alternation of PM10 concentration was observed in april in seven years period. (standard deviation 147 µg/m3)
Table 5. Statistical values of monthly mean of SO2 and PM10 concentrations (2007-2014)
Mountly
PM10 Conc. (µg/m3) SO2 Conc. (µg/m3)
Mean Std.
Deviation Min. Max. Mean
Std.
Deviation Min. Max.
January 267,1 75,6 178,6 405,8 17,7 9,8 5,8 33,9 February 138,8 40,3 77,0 203,9 19,0 9,7 10,2 35,7 March 130,1 96,8 72,2 358,6 19,9 10,2 11,7 36,7 April 114,8 147,4 45,5 478,2 10,2 8,5 2,7 27,8 May 47,2 9,4 33,3 65,7 4,8 4,0 0,8 12,7 June 50,1 12,0 35,8 70,3 3,0 2,2 0,0 6,2 July 59,4 17,6 32,4 92,5 3,5 3,4 0,1 9,7 August 65,3 19,3 40,4 103,1 4,8 4,4 0,2 12,9 September 70,1 23,2 43,1 106,7 5,4 3,7 0,6 8,8 October 85,9 16,0 65,5 112,3 5,7 4,2 0,3 12,3 November 165,3 61,9 94,8 274,2 15,4 10,6 2,3 33,6 December 222,7 81,6 114,2 349,9 25,6 10,7 14,1 39,5 January 2007 2008 2009 2010 2011 2012 2013 2014 Years 160 180 200 220 240 260 280 300 320 340 360 380 400 420 P M 10 C o n c . (µ g /m 3) 0 5 10 15 20 25 30 35 40 S O 2 C o n c . (µ g /m 3) PM10 Mean SO2 Mean April 2007 2008 2009 2010 2011 2012 2013 2014 Years 0 50 100 150 200 250 300 350 400 450 500 PM 1 0 C o n c . (µ g /m 3) 0 2 4 6 8 10 12 14 16 18 20 22 24 26 28 30 SO 2 C o n c . (µ g /m 3) PM10 Mean SO2 Mean July 2007 2008 2009 2010 2011 2012 2013 2014 Years 20 30 40 50 60 70 80 90 100 P M1 0 C o n c . (µ g /m 3) 0 2 4 6 8 10 12 S O2 C o n c . (µ g /m 3) PM10 Mean SO2 Mean February 2007 2008 2009 2010 2011 2012 2013 2014 Years 60 80 100 120 140 160 180 200 220 P M1 0 C o n c . (µ g /m 3) 8 10 12 14 16 18 20 22 24 26 28 30 32 34 36 38 S O2 C o n c . (µ g /m 3) PM10 Mean SO2 Mean May 2007 2008 2009 2010 2011 2012 2013 2014 Years 30 35 40 45 50 55 60 65 70 P M 10 C o n c . (µ g /m 3) 0 2 4 6 8 10 12 14 S O2 C o n c . (µ g /m 3) PM10 Mean SO2 Mean August 2007 2008 2009 2010 2011 2012 2013 2014 Years 30 40 50 60 70 80 90 100 110 P M1 0 C o n c . (µ g /m 3) 0 2 4 6 8 10 12 14 S O2 C o n c . (µ g /m 3) PM10 Mean SO2 Mean March 2007 2008 2009 2010 2011 2012 2013 2014 Years 50 100 150 200 250 300 350 400 P M1 0 C o n c . (µ g /m 3) 10 12 14 16 18 20 22 24 26 28 30 32 34 36 38 S O2 C o n c . (µ g /m 3) PM10 Mean SO2 Mean June 2007 2008 2009 2010 2011 2012 2013 2014 Years 30 35 40 45 50 55 60 65 70 75 P M1 0 C o n c . (µ g /m 3) 0 1 2 3 4 5 6 7 S O2 C o n c . (µ g /m 3) PM10 Mean SO2 Mean September 2007 2008 2009 2010 2011 2012 2013 2014 Years 40 50 60 70 80 90 100 110 P M1 0 C o n c . (µ g /m 3) 0 1 2 3 4 5 6 7 8 9 10 S O2 C o n c . (µ g /m 3) PM10 Mean SO2 Mean
October 2007 2008 2009 2010 2011 2012 2013 2014 Years 60 70 80 90 100 110 120 P M 10 C o n c . (µ g /m 3) -2 0 2 4 6 8 10 12 14 S O2 C o n c . (µ g /m 3) PM10 Mean SO2 Mean November 2007 2008 2009 2010 2011 2012 2013 2014 Years 80 100 120 140 160 180 200 220 240 260 280 300 P M 10 C o n c . (µ g /m 3) 0 5 10 15 20 25 30 35 S O2 C o n c . (µ g /m 3) PM10 Mean SO2 Mean December 2007 2008 2009 2010 2011 2012 2013 2014 Years 100 120 140 160 180 200 220 240 260 280 300 320 340 360 P M 10 C o n c . (µ g /m 3) 12 14 16 18 20 22 24 26 28 30 32 34 36 38 40 42 S O2 C o n c . (µ g /m 3) PM10 Mean SO2 Mean
Figure 3. Mountly means of SO2 Conc. and PM10 conc. (2007-20014)
The variation of AQI by years according to PM10 values of Igdir province, is given In Table 6. Measurements were needed to be done for 2922 days in 7 years but 479 days no measurement has been done. because of that the number of days which have been monitored corresponds to 2443 days. During seven-year period, the number of days with good air quality, was determined as 703 days (78,8%); medium quality, was 836 days (34,2%); the number of days with sensitive air quality, was 646 (26,4%), days with unhealthy air, was 166(6,8%), days with bad air, was 61 (2,5%), and the number of days with dangerous air conditions, was determined as 31 days (1,3%). As it can be seen from the table, the maximum number of days with good air conditions, was observed in 2013 as 105 (32.9%) days. And the maximum number of days with dangerous air conditions, was observed in 2007, as 25 days (9,0%).
Table 6. Air Quality changes by years-PM10 concentration
Years
Good Medium Sensitive Unhealthy Bad Dangerous Total
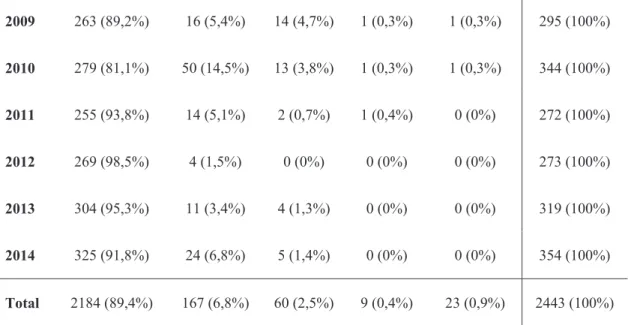
2007 64 (23%) 71 (25,5%) 85 (30,6%) 22 (7,9%) 11 (4%) 25 (9%) 278 (100%) 2008 60 (19,5% 102 (33,1%) 107 (34,7%) 26 (8,4%) 11 (3,6%) 2 (0,6%) 308 (100%) 2009 107 (36,3%) 100 (33,9%) 57 (19,3%) 15 (5,1%) 14 (4,7%) 2 (0,7%) 295 (100%) 2010 80 (23,3%) 123 (35,8%) 76 (22,1%) 50 (14,5%) 14 (4,1%) 1 (0,3%) 344 (100%) 2011 100 (36,8%) 86 (31,6%) 69 (25,4%) 14 (5,1%) 2 (0,7%) 1 (0,4%) 272 (100%) 2012 84 (30,8%) 112 (41%) 73 (26,7%) 4 (1,5%) 0 (0%) 0 (0%) 273 (100%) 2013 105 (32,9%) 112 (35,1%) 87 (27,3%) 11 (3,4%) 4 (1,3%) 0 (0%) 319 (100%) 2014 103 (29,1%) 130 (36,7%) 92 (26%) 24 (6,8%) 5 (1,4%) 0 (0%) 354 (100%) Total 703 (28,8%) 836 (34,2%) 646 (26,4%) 166 (6,8%) 61 (2,5%) 31 (1,3%) 2443 (100%) In Table 7, warning thresholds of 24-hour period measurement means of PM10 concentrations related to Igdir province, were determined in accordance with AQEMR. Accordingly, the number of days in which PM10 values under the warning levels, was 2184 (89,4%). The number of days in which the first warning level was exceeded, was 167 (6,8%); days in which the second warning level was exceeded, was 60 (2,5%); days in which the third warning level was exceeded, was 9 (0,4%), and the number of days in which the fourth warning level was exceeded, was determined as 23 days (0,9%). Warning levels were exceeded in 250 days (10,9%) in total. Table 7. According to the regulations AQEM, 24-hour period-mean of warning threshold limits values- PM10 concentration
Years
Fit Standard Primary Standard Seconder Standard Tertiary Standard Quaternay Standard Total 2007 220 (79,1%) 22 (7,9%) 11 (4%) 4 (1,4%) 21 (7,6%) 278 (100%) 2008 269 (87,3%) 26 (8,4%) 11 (3,6%) 2 (0,6%) 0 (0%) 308 (100%)
2009 263 (89,2%) 16 (5,4%) 14 (4,7%) 1 (0,3%) 1 (0,3%) 295 (100%) 2010 279 (81,1%) 50 (14,5%) 13 (3,8%) 1 (0,3%) 1 (0,3%) 344 (100%) 2011 255 (93,8%) 14 (5,1%) 2 (0,7%) 1 (0,4%) 0 (0%) 272 (100%) 2012 269 (98,5%) 4 (1,5%) 0 (0%) 0 (0%) 0 (0%) 273 (100%) 2013 304 (95,3%) 11 (3,4%) 4 (1,3%) 0 (0%) 0 (0%) 319 (100%) 2014 325 (91,8%) 24 (6,8%) 5 (1,4%) 0 (0%) 0 (0%) 354 (100%) Total 2184 (89,4%) 167 (6,8%) 60 (2,5%) 9 (0,4%) 23 (0,9%) 2443 (100%)
The mean PM10 and SO2 values by years are given in the table 8. SO2 hourly limit value of Turkey in 2014, was
500 µg/m3 and EU limit value was 350 µg/m3. It was observed that, hourly limit values of Igdir province between 2007 and 2014, had not been exceeded. 24-hour period SO2 limit value of Turkey in 2014, was 250
µg/m3. Mean target limit value of Turkey in the winter season, was 125 µg/m3. Limit values had not been exceeded according to these criteria. EU SO2 24-hour period limit value was determined as 125 µg/m3, and it
was pointed out that these values could be exceeded three times at most, within a year. EU SO2 24-hour period
limit value was exceeded just once in 2011. EU limit ecosystem value was 20 µg/m3 and the number of days that exceeded this limit value, was 391 (19,6%).
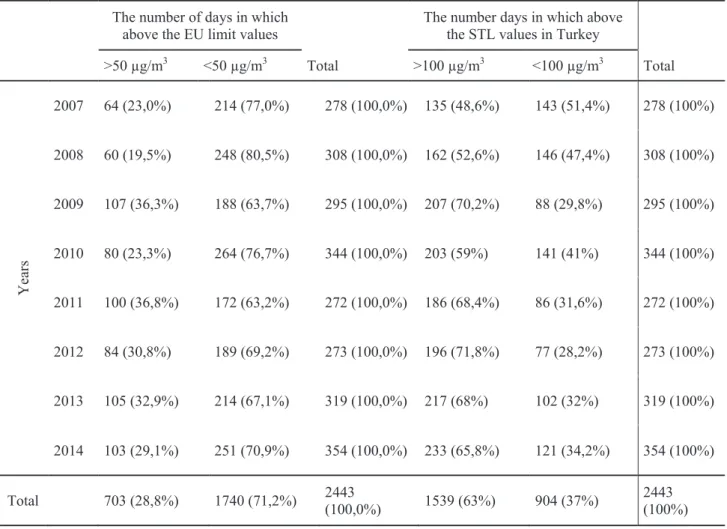
EU annual mean limit value for PM10, was 40 µg/m3. Winter season mean of this value, was 90 µg/m3 and annual mean of LTL value was 60 µg/m3. Accordingly, it was observed that, PM10 was exceeded in all EU annual mean limit values between 2007 and 2014. For PM10 value, EU hourly limit values were 50 µg/m3, and it was foreseen that this value could be exceeded 35 times at most, within a year. PM10 24-hour period STL value in Turkey in 2014, was determined as 100 µg/m3. The number of days in which 24-hour period mean EU limit values of PM10 concentration and STL values of Turkey were exceeded, are given in Table 9. As it can be seen in the table, these limit values were exceeded in each year.
Table 8. The means of PM10 and SO2 values (µg/m3) (2007-2014)
Valid Missing Mean Std. Deviation Minimum Maximum
2007 PM10 278 88 197,9 255,9 14 995 SO2 215 151 11,2 13,3 0 51 2008 PM10 308 58 128,7 108,1 16 640 SO2 139 227 12,7 9,0 0 43 2009 PM10 295 71 109,5 117,8 14 653 SO2 176 190 13,3 15,6 0 61 2010 PM10 344 22 134,8 122,1 18 783 SO2 349 17 12,4 11,5 4 57 2011 PM10 272 94 94,8 85,2 15 598 SO2 222 144 24,2 24,3 0 139 2012 PM10 273 93 88,1 58,8 14 302 SO2 306 60 10,3 8,0 1 42 2013 PM10 319 47 97,3 80,5 17 467 SO2 316 50 11,3 12,6 1 62
2014 PM10 354 12 106,4 89,5 20 485
SO2 276 90 8,8 7,0 2 45
Table 9. PM10 conc. the number of days in which above the 24-hour mean limit
The number of days in which above the EU limit values
The number days in which above the STL values in Turkey >50 µg/m3 <50 µg/m3 Total >100 µg/m3 <100 µg/m3 Total Y ea rs 2007 64 (23,0%) 214 (77,0%) 278 (100,0%) 135 (48,6%) 143 (51,4%) 278 (100%) 2008 60 (19,5%) 248 (80,5%) 308 (100,0%) 162 (52,6%) 146 (47,4%) 308 (100%) 2009 107 (36,3%) 188 (63,7%) 295 (100,0%) 207 (70,2%) 88 (29,8%) 295 (100%) 2010 80 (23,3%) 264 (76,7%) 344 (100,0%) 203 (59%) 141 (41%) 344 (100%) 2011 100 (36,8%) 172 (63,2%) 272 (100,0%) 186 (68,4%) 86 (31,6%) 272 (100%) 2012 84 (30,8%) 189 (69,2%) 273 (100,0%) 196 (71,8%) 77 (28,2%) 273 (100%) 2013 105 (32,9%) 214 (67,1%) 319 (100,0%) 217 (68%) 102 (32%) 319 (100%) 2014 103 (29,1%) 251 (70,9%) 354 (100,0%) 233 (65,8%) 121 (34,2%) 354 (100%) Total 703 (28,8%) 1740 (71,2%) 2443 (100,0%) 1539 (63%) 904 (37%) 2443 (100%) 4. CONCLUSION
Igdir province is situated in Igdir plain. Because Igdir plain is in a position of a basin that is surrounded by mountains, it can be likened to a bowl, and due to its topographic structure, it is exposed to enormous amount of air pollution in winter months. This topographic structure causes adverse effects on many air factors, especially the wind. When the wind speed is low, it prevents the pollutants from diffusing, and leads to air pollution. In this study, air pollution parameters acquired for Igdir province between 2007 and 2014, were analyzed. For that purpose, SO2 and PM10 concentration values and measurement values acquired from the web site of the
ministry of environment and urban planning, were used. PM10 mean for Igdir province between 2007 and 2014, was determined as 119,5 µg/m3 and SO2 mean value was determined as 12,7 µg/m3. For the heating season
between the periods of 1 October 2006 and 31 March 2014, the mean SO2 concentrations were determined as
19,1 µg/m3 and the mean PM10 concentration was determined as 173,3 µg/m3. When the data related to the winter months, received from the provincial directorate of meteorology were analyzed; it was observed that the wind speed in these periods, was low. Pollutants descended on the plain horizontally for a long time, without dispersing around. In these months, inversion layer was composed and this layer prevented the vertical diffusion of the pollutants.
The distribution of AQI by years, was analyzed according to PM10 values of Igdir province. The air quality was determined as good in 703 (78,8%) days, as medium in 836 (34,2%) days, as sensitive in 646 (26,4%) days, as unhealthy in 166 (6,8%) days, as bad in 61 (2,5%) days and as dangerous in 31 (1,3%) days. Warning thresholds related to 24-hour period measurement means of PM10 concentration of Igdir province, were determined in accordance with AQEM. The number of days in which the first warning level was exceeded, was determined as 167 (6,8%), days in which the second warning level was exceeded, was 60 (2,5%), days in which the third level
was exceeded, was 9 (0,4%), and the number of days in which the fourth level was exceeded, was determined 23 days (0,9%).
Between 2007-2014, it was observed that SO2 EU limit value and 24-hour period limit value had not been
exceeded. It was determined that the annual ecosystem limit value was not exceeded, and the number of days that this limit value exceeded, was 391. When SO2 limit values of Turkey in 2014 were analyzed, it was
observed that no limit values were exceeded. And when PM10 limit values of EU and Turkey were analyzed, it was observed that these limit values were all exceeded. In a research carried out, 2009-2010 winter season (October-March) particulate matter (PM10) air quality measurement values were analyzed, and it was observed that the limit values specified by AQEM in Igdir, had been excessed. A ranking was carried out according to PM10 measurement results, and the dirtiest top ten provinces were ranked as; Igdir, Karabuk, Denizli, Corum, Bolu, Batman, Kahramanmaras, Siirt, Van and Mardin, respectively [6].
In Igdir province, particularly due to the high values in PM10 concentration, serious precautions are needed to be taken for the treatment of the air quality. These values will significantly decrease once the use of natural gas is launched in Igdir province. The Provincial Directorate of Environment and Urban Planning is supposed to increase the air pollution inspections and to take necessary precautions in the days when the warning level is exceeded.
References
[1] Environmental Foundation of Turkey in 1998. Turkey's Environmental Problems, EFT Publication No. 131, Ankara.
[2] Anonymous, 1995. Environmental Notes. Ministry of Environment Education and Publication Department, Ankara.
[3] CELIK, F. D., & KIRMACI, H. K. (2011). Trends in Sulfur dioxide and particulate matter levels in Kayseri (Turkey): 1990-2007. Ekoloji, 20(79), 83-92.
[4] Ministry of Environment and Forestry (2010). Clean Air Action Plan(2010-2013), General Directorate of
Environmental Management, [Retrieved march 18, 2015, from
http://www.cygm.gov.tr/CYGM/Files/EylemPlan/Temiz_Hava_Eylem_Plani.pdf ].
[5] T. C. Ministry of Environment and Urbanization, 2014. Igdir county of clean air action plan (2014-2019),
[Retrieved march 18, 2015, from
http://www.csb.gov.tr/db/igdir/editordosya/file/TEM%C3%84%C2%B0Z%20HAVA%20EYLEM%20PLA NI.pdf].
[6] Ozdemir, S., 1997. Basic Ecological Knowledge and Environmental Issues. Hatiboglu Publications, Ankara. [7] Ekinci, E. (1997). National environmental action plan: air pollution from the energy sector. DPT, Ankara. [8] T. C. Ministry of Environment and Urban Planning, National air quality monitoring network, Turkey
[Retrieved march 18, 2015, from http://www.havaizleme.gov.tr/Default.ltr.aspx].
[9] T. C. Ministry of Environment and Urbanization, air quality monitoring stations website / information / air, [Retrieved march 18, 2015, from http://www.havaizleme.gov.tr/hava.html].
[10] Air Quality Guidelines For Europe, 2005. World Health Organization Regular Office for Europe Copenhagen. Second Edition: WHO Regional Publications, European Series. No: 91, Germany [Retrieved march 18, 2015, from http://www.euro.who.int/document/e87950.pdf].
[11] T. C. Ministry of Environment and Urbanization, air quality assessment-General Information, [Retrieved march 18, 2015, from http://www.csb.gov.tr/gm/cygm/index.php?Sayfa=sayfahtml&Id=1493].
[12] Regulation, Air quality assessment and management regulations, (1988). The gazette. Number, 26898, Turkey.
[13] Limit values, [Retrieved march 18, 2015, from