Full Length Research Paper
Antioxidant, phenolic and protein contents of some
medicinal plants
Serap Dogan
1*, Mehmet Emin Diken
1and Mehmet Dogan
2 1Department of Biology, Faculty of Science and Literature Balikesir University 10145 Çağış-Balikesir/Turkey. 2
Department of Chemistry, Faculty of Science and Literature Balikesir University 10145 Çağış-Balikesir/Turkey. Accepted 23 Novermber, 2010
In this study, the antioxidant contents such as α-tocopherol, β-carotene, ferulic acid and gallic acid and, total phenolic and proteine contents of some medicinal plants were determined by High Performance Liquid Chromatography (HPLC) and UV-visible spectrophotometer, respectively. It was found that (i) the contents of antioxidant, phenolic and protein of plants were different according to plant types, (ii) the types, which have the most α-tocopherol, β-carotene, ferulic acid and gallic acid contents, were Rosmarinus officinalis L., Mentha piperita L., Mentha piperita L. and Equisetum hyemale L., respectively, (iii) in general, E. hyemale L. had the most antioxidant content, (iv) there will be a relationship between α-tocopherol and gallic acid contents, and between β-carotene and ferulic acid contents of plants, and (v) Hypericum perforatum L. and Glycrrhiza glabra L. had the most phenolic and protein contents, respectively.
Key words: Medicinal plants, antioxidant, total phenolic content, protein amount, high performance liquid chromatography.
INTRODUCTION
The plant kingdom offers a large range of phenolic pounds, both polar and non polar. These phenolic com-pounds are commonly found in both edible and nonedible plants, and they have been reported to have multiple biological effects, including antioxidant activity. A number of plants are important natural antioxidants. Their anti-oxidant activity has been attributed to the presence of polar phenolic compounds and essential oils. The impor-tance of the antioxidant constituents of plant materials in the maintenance of health and protection from coronary heart disease and cancer is also raising interest among scientists, food manufacturers, and consumers as the trend of the future is moving toward functional food with specific health effects. The antioxidant activity of phenolics is mainly due to their redox properties, which allow them to act as reducing agents, hydrogen donators, and singlet oxygen quenchers. In addition, they have a metal chelation potential (Kahkonen et al., 1999).
*Corresponding author. E-mail: [email protected]. Tel: +90 266 612 10 00/4303. Fax: +90 266 612 12 15.
Antioxidants are secondary constituents or metabolites found naturally in the body and in plants such as fruits and vegetables. An antioxidant can be defined in simple terms as anything that inhibits or prevents oxidation of a susceptible substrate. Plants produce a very impressive array of antioxidant compounds that includes caro-tenoids, flavonoids, cinnamic acids, benzoic acids, folic acid, ascorbic acid, ferulic acid, tocopherols and toco-trienols to prevent the oxidation of the susceptible sub-strate. Common antioxidants include vitamin A, vitamin C, vitamin E, and certain compounds called carotenoids (like lutein and beta-carotene). Antioxidants are usually applied to prevent lipid peroxidation in the food industries. Though synthetic antioxidants in these type processes have been widely used, they have been reassessed for possible toxic and carcinogenic components that may form during degradation (Yen et al., 2003). Due to these health concerns, in recent years, there has been a growing interest in the search for natural antioxidants for three principal reasons: (i) numerous clinical and epide-miological studies have demonstrated that consumption of fruits and vegetables is associated with reduced risks of developing chronic diseases such as cancer, cardio-
vascular disorders and diabetes; (ii) safety consideration regarding the potential harmful effects of the chronic consumption of synthetic antioxidants in foods and beve-rages; and (iii) the public’s perception that natural and dietary antioxidant are safer than synthetic analogues. The result has been an increased interest in spices, aro-matic and medicinal plants as sources of natural antioxidants (Dastmalchi et al., 2008).
Although, a number of studies on the total phenolic and antioxidant contents of plant sources have been reported from different countries, the compositional data are still insufficient, which necessitates the need to investigate more and more materials for the search of credible and beneficial natural antioxidants. There is gap of informa-tion regarding the total phenolic and antioxidant contents of some plants. Therefore, the aim of present study was to examine the total phenolic and protein contents and antioxidant compounds such as β-tocopherol, β-carotene, ferulic acid and gallic acid and quantities a large number of plant materials of Turkish origin in order to find new potential sources of natural antioxidants. These plant types are Equisetum hyemale L., Eruca sativa Miller,
Hypericum perforatum L., Glycyrrhiza glabra L., Anethum graveolens L., Cichorium endivia L., Achillea millefolium
L., Centaurium erythraea Rafn. subsp. erythraea Rafn.,
Rosmarinus officinalis L., Lavandula stoechas L., Lavandula angustifolia Miller, Sideritis congesta
P.H.Davis & Hub.-Mor., Sideritis dichotoma Huter,
Melissa officinalis L. subsp. officinalis, Origanum onites
L., Thymbra spicata L. var. spicata, Mentha piperita L.,
Urtica dioica L., Agropyrum repens L., Zea mays L. In our
previous works, we investigated the characterization of polyphenol oxidase from Thymus type (Dogan and Dogan, 2004), Thymbra (Dogan et al., 2006 and Dogan et al., 2007) and Origanum onites L. (Dogan et al., 2005). The present work would be informative and novel with regard to the quantification of specific antioxidant and plant materials along with their native region.
Such study is valuable for researchers in providing a base line data for future detailed characterization of other phenolics in these and related plants and thus a step towards their potential commercialization as nutra-ceuticals and anti-oxidant applications in the market-place. In the present study, the antioxidant compounds and quantities of different plants have been determined by using a Reverse-Phase High Performance Chroma-tography (RP-HPLC) technique; and the total phenolic content by spectrophotometic method.
MATERIALS AND METHODS Materials
All chemicals and reagents were of HPLC grade and were purchased from Sigma Chemical Co., Aldrich Chemical Co., Merck, J.T. Baker and Lab-Scan. 17 grains of plants used were collected from Balikesir between June and August months in 2008 year and other three (A. repens L., C. endivia L. and E. hyemale L.) from
Trakya region in Turkey.
HPLC measurements
HPLC analyses were performed using PerkinElmer HPLC unit which consisted of a Series 200 pump, a Binary ternary gradient unit, a three channel degasser, and a UV/vis detector set linked to an injection valve with a 20 µl sampler loop. A Macherey-Nagel silica gel (EC 250/4.6 Nucleosil 100-5 C18) column was used. Chromatogram was recorded and peaks from samples were identified by comparing their spectra with those of pure standards. The peak areas were determined by integration. For each extract, quantitative analysis was performed in triplicate.
Construction of the standard curves
Calibration curve of α-tocopherol
Pure α-tocopherol was dissolved into dichloromethan and from this stock solution, we prepared the standart solutions at 50, 100, 150, 200 and 250 ppm concentrations. These solutions were filtered in membrane of 0.45 µm and then, 20 µl of them was injected into HPLC. The calibration curve was constructed by plotting the peak areas of the analyte against the concentration of α-tocopherol at 295 nm. We used methanol:dichloromethan mixture in the ratio of 95:5 as mobile phase. Flow rate was 2 ml/min (Vilasova-Martinez et al., 2008).
Calibration curve of β-carotene
After pure β-carotene was dissolved in tetrahydrofuran, it was prepared with the standard solutions at 50, 100, 150, 200 and 250 ppm concentrations. The solutions were filtered in membrane of 0.45 µm. 20 µl of them was injected into HPLC. It was used acetonitrile:methanol:tetrahydrofuran mixture in the ratio of 55:40:5. The flow rate was 2 ml/min. The calibration curve was constructed by plotting the peak areas of the analyte against the concentration of β-carotene at 450 nm (Singh et al., 2007).
Calibration curve of ferulic acid
For assay of ferulic acid, the stock solution of ferulic acid was prepared at a concentration of 250 mg/L in methanol–citrate buffer (0.01 M and pH 5.4) (88:12). Calibration standard solutions were prepared in the concentration range of 50 to 250 ppm with methanol–citrate buffer. An aliquot of 20 µl standard solution was injected for HPLC analysis. The calibration curve was constructed by plotting the peak areas of the analyte against the concentration of ferulic acid. Flow rate was 1 ml/min. The peaks were monitored to 310 nm (Jankovska et al., 2001).
Calibartion curve of gallic acid
Stock standard solution was prepared by accurately weighing 10 mg of gallic acid reference standard into a 10 ml volumetric flask and dissolving in water with the aid of sonication. Working standard solutions, 25 to 150 ppm, were prepared by dilution with water from the stock standard solutions. These standard solutions were conducted at the flow rate of 1 ml/min at 212 nm using water:methanol:o-phosphoric acid mixture in tha ratio of 79.9:20:0.1. The solutions were filtered in membrane of 0.45 µm before injection. 20 µL of them was injected into HPLC (Wang et al., 2003).
Preparation of plant samples
Plant samples collected were firstly washed several times with distilled water and then it was dried in the dark and room temperature in a place where there is the air flow. Dried plant samples were powdered by ball mill (Retsch PM100). Powdered plant samples were put into glass jars and stored at room temperature.
Methods
Extraction of α-tocopherol
Five grams of powdered dry sample (5 g) were suspended in 50 ml of methanol and extracted for 20 min in an ultrasonic bath (Elma S 60 H Elmasonic). The mixture was then filtered, rinsed with 5 ml of solvent, evaporated under vacuum at 32°C and collected in a freezer. Extract was dissolved with 3 ml of methanol, filtered in membrane of 0.45 µm before injection and then 20 µL of it was injected (Bruni et al., 2002).
Extraction of β-carotene
Ten grams plant samples dried, crushed and homogenaized were extracted with acetone four times in dark environment. Extracts were combined, taken in a separating funnel and added into 100 ml of diethylether and 100 ml of 10% NaCl solution. Phases were separated and washed with saturated Na2SO4 solution. Ether phase
was dried with Na2SO4 to remove water. Ether phase containing
carotenoids was soaped with 100 ml of 20% KOH and 20% methanol solution. After one hour, phases were separated. In order to neutralization, organic phase was washed with distilled water four times and then the solvent was removed at 35°C by evaporation. The remaining solid portion was resolved with 3 ml of tetrahydrofuran, filtered in membrane of 0.45 µm and injected into HPLC (Gama and Sylos, 2005).
Extraction of ferulic acid
2 g of powdered plant samples were mixtured with 25 ml of methanol:formic acid mixture (95/5). Mixture was kept ultrasonic bath for 100 min. Then, it was added with 25 ml of methanol:2% NaHCO3 mixture in the ratio of 95:5. Extract was filtered and filtrate
obtained was re-filtared in membrane of 45 µm. Finally, 20 µl of filtrate was injected into HPLC (Lu et al., 2005).
Extraction of gallic acid
The extraction of gallic acid was performed according to modified method of Wang et al. (Wang et al., 2003). One gram of powdered plant sample was mixtured with 2 ml of pure water and 3 ml of methanol. This mixture was subjected to 40 min in a ultrasounic bath. After the mixture was filtered, the total volume of filtrate was completed to 5 ml by methanol. The sample was filtered in membrane of 0.45 µm before injection and then 20 µl of it was injected.
Determination of total phenolic compound content
Total phenolic concentrations in selected medicinal plants were spectrophotometrically determined using the Folin-Ciocalteu colorimetric method (Singleton and Rossi, 1965). Samples (1 g) were homogenized in 80% aqueous ethanol at room temperature
and centrifuged in the cold at 10000 g for 15 min, and the supernatant was saved. The residue was re-extracted twice with 80% ethanol, and the supernatants were pooled, put into evapo-rating dishes, and evaporated to dryness at room temperature. The residue was dissolved in 5 ml of distilled water. One hundred microliters of this extract was diluted to 3 ml of the water, and 0.5 ml of Folin-Ciocalteu reagent was added. After 3 min, 2 ml of the 20% sodium carbonate was added, and the contents were mixed thoroughly. The color was developed and the absorbance mea-sured at 650 nm in a PerkinElmer Lamda 25 UV-visible spectro-photometer after 60 min using catechol as a standard. The result was expressed as milligram of catechol per 100 g of dried weight material. Data presented are average of three measurements.
Determination of protein content
Protein content was determined according to Bradford’s method using bovine serum albumin as standard.
RESULTS AND DISCUSSION Antioxidant contents of plants
The results obtained for α-tocopherol, β-carotene, gallic acid and ferulic acid contents of plants used in the study have been discussed as follows.
α-tocopherol contents
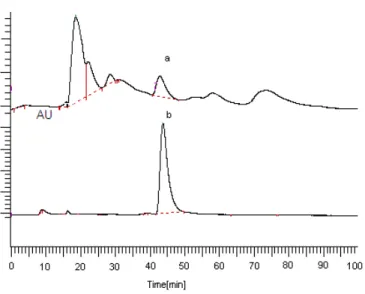
α-tocopherol, which is the most powerful and natural form of vitamin E, expecially being abundant in vegetable oils and nuts, (i) protects unsaturated fats against oto-oxidation, (ii) prevents the effect from these radicals of cell membrane by capturing free radicals, and (iii) forms first line of defense against peroxidation of the multiple unsaturated fatty acids founded in membrane phospholipids. α-tocopherol as seen from the explana-tions above protects the body against negative condiexplana-tions of environment and against free radicals, which form in body. Therefore, foods based plant used in our daily diets represents a major importance. In this study, α-tocopherol contents of different twenty medical plants, which are known as herbal plant among people, were determined by HPLC and the results have been given in Table 1. Figure 1 only shows HPLC graphs of of M.
piperita L. (a) and standard α-tocopherol (b) (others not
shown). As seen in Table 1, α-tocopherol contents of plants show significant differences from plant to plant. The highest quantites of α-tocopherol were found in R.
officinalis L., followed by E. hyemale L. and S. congesta
P.H.Davis and Hub.-Mor. On the other hand, α-tocopherol was not detected in G. glabra L., C. endivia L.,
L. stoechas L. and Z. mays L. plant types. Table 2 has
shown the α-tocopherol contents of some plant types in the literature. Comparing our results with data in the literature, it can be said that α-tocopherol contents of E.
hyemale L., E. sativa Miller, H. perforatum L., C. erythraea Rafn. subsp. erythraea Rafn., R. officinalis L.,
Figure 1. HPLC graps of M. piperita L. (a) and
standardα-tocopherol (b).
L. anqustifolia Miller, S. dichotoma Huter, M. officinalis L. subsp. officinalis, O. onites L., T. spicata L. var. spicata, M. piperita L. and U.dioica L. plant types are relatively
higher than those of plants in Table 2.
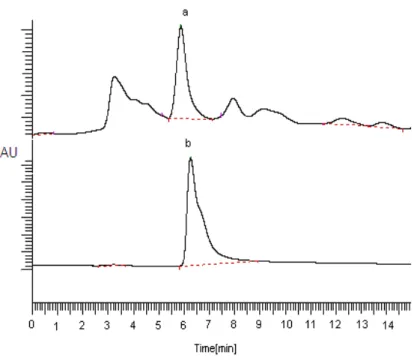
β-Carotene content
β-carotene, which helps to neutralize free radicals, is a powerful antioxidant and provides to struggle of body against infections by supporting the body's immune system. In general, β-carotene, which is an antioxidant based plant, exists in yellow, orange, and dark green vegetables and yellow-orange fruits. β-carotene contents of the plants used in this study have been shown in Table 1. Figure 2 only shows HPLC graphs of M. piperita L. (a) and standard β-carotene (b) (others not shown). As seen in Table 1, β-carotene contents of the plants have changed in the range of 0.15 to14.25 mg per 100 g dry weight. We found that M. piperita L. had the most β-carotene content, followed by U. dioica L., A.graveolens L. and E. sativa Miller. But the plant types such as G.
glabra L., A. repens L. and Z. mays L. had not β-carotene
content. β-carotene contents of some plant types studied in the literature are given in Table 2. When our results compared with data in the literature, it can be said that β-carotene contents of plant types used in this study are higher than those of plant in the literature. The fact that these plant types are daily taken in a diet causes the increasing of our body immune system against free radicals formed in the body. Epidemiological studies have shown that high intakes of caratenoid-rich vegetables and fruits and high blood levels of β-carotene are associated with decreased incidence of some cancers (Slattery et al., 2000).
Ferulic acid content
Ferulic acid is an antioxidant to neutralize free radicals such as superoxide, nitric oxide and hydroxyl radicals, which damage the cell wall and DNA. This feature of it has an important place in the food industry. Table 1 shows the ferulic acid contents of plants used in the study. Figure 3 only shows HPLC graphs of M. piperita L. (a) and standart ferulic acid (b) (others not shown). From Table 1, it has been seen that ferulic acid contents of plants changed as depending on plant types. Moreover,
M. piperita L. is plant type, which has the highest ferulic
acid content among plant types used in the study. On the other hand, we determined that plant types such as E.
hiemale L., H. perforatum L., A. millefolium L., C. erythraea Rafn subsp erythraea Rafn., Sideritis congesta
P.H.Davis and Hub.-Mor., M. officinalis L. subsp.
officinalis and Z. mays L. have not ferulic acid content. As
our results compared with the results in the literature, we can say that ferulic acid contents of plants used in the study are higher than those of plants in the literature (Table 2).
Gallic acid content
Gallic acid, which has fungal, antioxidant and anti-viral effect and obtained from hydrolysis of tannin is an organic acid, which is used in very wide fields for various purposes from the medical and pharmacy until the paint, chemical and food industries. The fact that gallic acid has antioxidant effect makes the plants, which contain it, valuable. Table 1 shows the gallic acid contents of plants used in this study. Figure 4 only shows HPLC graphs of
S. dichotoma Huter (a) and standard gallic acid (b)
(others not shown). As seen from Table 1, except for A.
graveolens L. and U. dioica L. plant types, all of other
plants have contained gallic acid in the different amounts. From the results, it was found that E. hyemale L. had the most gallic acid content. Table 2 has shown the gallic acid contents determined for some plants in the literature. Comparing with the results, it can be said that the plant types studied have relatively higher gallic acid contents.
According to the results above, when E. hyemale L. has both the highest gallic acid content and the highest α-tocopherol content, M. piperita L. has both the highest β-carotene content and the highest ferulic acid content. These results have shown that there will be a relationship between gallic acid and α-tocopherol, and between β-carotene and ferulic acid. Again all plants, which contain α-tocopherol have also contained gallic acid. Moreover, we found that the values were found close to each other. In such a case, it was also observed between β-carotene and ferulic acid. Again, more than half of the plant extracts included in the present study exhibited anti-oxidant activity higher than or comparable to the reference foreign plants. The assessment of antioxidant
Table 1. α-tocopherol, β-carotene, ferulic acid, gallic acid, total phenolic and protein contents of plants used in this study. Plants αα-tocopherol αα (mg/100 g) β β β β-carotene (mg/100 g) Ferulic acid (mg/100 g) Gallic acid (mg/100 g)
Total phenolic content (mg/100 g) Protein content (mg/100 g) E. hyemale L. 119.40 0.45 --- 122.50 2797 560 E. sativa Miller 10.00 3.60 2.75 12.50 609 640 H. perforatum L. 31.65 1.15 --- 5.83 3771 850 G. glabra L. --- --- 1.67 5.83 447 2170 A. graveolens L. 1.00 6.69 3.33 --- 1220 1544 C. endivia L. --- --- 8.33 5.83 1331 527 A. millefolium L. 0.65 0.15 --- 3.33 767 594
C. erythraea Rafn. subsp erythraea Rafn. 32.00 0.45 --- 19.17 2477 382
R.officinalis L. 129.75 2.34 2.50 5.00 2157 1866
L. stoechas L. 0.15 0.15 2.00 3.33 927 1308
L.a angustifolia Miller 16.70 1.05 11.25 3.33 783 1882
S. congesta P.H.Davis and Hub.-Mor. 1.90 0.75 --- 2.50 3669 609
S. dichotoma Huter 62.12 2.25 2.50 22.50 2026 1478
M. officinalis L. subsp officinalis 16.50 2.25 --- 16.70 1411 1419
O. onites L. 6.85 1.05 7.50 5.83 1833 1199
T. spicata L. var. spicata 25.00 1.35 15.00 6.67 1677 1200
M. piperita L. 3.30 14.25 25.00 5.00 1857 1297
U. dioica L. 8.50 11.05 7.50 --- 1026 2088
A. repens L. 0.40 --- 2.22 6.67 743 300
Z. mays L. 0.30 --- --- 5.83 213 999
Table 2. α-tocopherol, β-carotene, ferulic acid and gallic acid contents of some plants in literature.
Plants αααα-tocopherol (mg/100 g) ββββ-carotene
(mg/100 g)
Ferulic acid
(mg/100 g) Gallic acid (mg/100 g) Reference
Nut 24.2–31.4 Taspinar et al., 2008
Moringa oleifera 9.59–74.45 Sanchez–Manchado et al., 2006
Ficus elastica 30.1 Szymanska and Kruk, 2008
Crab 23.3 0.2 Vilasova-Martinez et al., 2008
Brassica vegetable 0.47 0.81 Singh et al., 2007
Fruit and vegetable (melon. potato. grape) 0.12–3.41 0.033–2.589 Kim et al., 2007
Potato 0.042-0.219 Andre, 2007
Papaya and banana 0.232 Wall, 2006
Vegetable 6.3–9.6 Barba et al., 2006
Capsicum annuum L. 0.262 Zuniga et al., 2005
Phaseolus vulgaris L. 13.08-23.47 Ross et al., 2009
Different rye species 90-117 Andreasen et al., 2000
Centaurea pterocoula 25.09 Tekeli et al., 2008
Hamamelis 0.59 %w/w Wang et al., 2003
Figure 2. HPLC graphs of Mentha piperita L. (a) and standart β-carotene (b).
Figure 3. HPLC graphs of M. piperita L. (a) and standart ferulic acid (b).
potential of Turkey medicinal plants provides valuable information about the possible use of the plant extracts as a source of antioxidants to increase individual resis-tance against different diseases accompanied by impaired oxidant/antioxidant balance. We can speculate that Turkey medicinal plants have high health prevention potential and could be considered in the formulation in new food products and dietary recommendations.
Total phenolic contents
Phenolic compounds are important constituents of plants, vegetables, and fruits because of their scavenging ability due to their hydroxyl groups. The phenolic compounds may contribute directly to the antioxidative action. They are easily degraded (e.g., by oxidation or hydrolysis) and may also form covalent products and non-covalent AU
Figure 4. HPLC graphs of S. dichotoma Huter (a) and standart gallic acid (b).
complexes with various types of molecules (Dogan et al., 2005). In addition, it was reported that phenolic com-pounds were associated with antioxidant activity and play an important role in stabilizing lipid peroxidation (Yen and Wu, 1993). The results of total phenolic contents of plants studied in this study are given in Table 1. Total phenolic content of the plants varied from 3771 mg catechol per 100 g dry weight to 213 mg catechol per 100 g dry weight. Considering a large variation in the total phenol-lics, the plants were divided into three groups namely high (>2400 mg catechol per 100 g dry weight), medium (1000 to 2400 mg catechol per 100 g dry weight) and low (<1000 mg catechol per 100 g dry weight). H. perforatum L., S. congesta P.H.Davis and Hub.-Mor., E. hyemale L. and C. erythaea Rafn subsp erythraea Rafn. had the highest total phenolic content, followed by A. graveolens L., C. endivia L., R. officinalis L., S. dichotoma Huter, M.
officinalis L. subsp officinalis, O. onites L., T. spicata L.
var. spicata, M. piperita L. and U. dioica L. The low group was represented by E. sativa Miller, G. glabra L., A.
millefolium L., L. stoechas L., L. angustifolia Miller, A. repens L. and Z. mays L. It was found that the total
phenolic contents of plant types such as fresh turmeric, broccoli, tomato, Indian ground apple, mint, carrot, onion, beet and artichoke in the literature were 176, 88, 68, 92, 400, 350, 349, 323 and 425 mg per 100 g of fresh weight (Dogan et al., 2005). Comparing with the results, it can be said that the total phenolic contents of plants used in the study are higher than those of plants above.
Protein contents
The most important criteria that determine the nutritional
quality of plants, is the nutritional value of the plant. Crude protein contents of plants are influenced by a lot of environmental factors and the protein contents in different organs of plants in general are different. When a large part of the protein contents of plants (70 to 90%) consists of amino acids, the remaining portion and the part called as non-proteins are formed from ammonium and nitrate salts. As can be seen, protein content is an important parameter in the determination of food values of plant nutrients. Protein contents of plant types used in the study was determined spectrophotometrically. The ob-tained experimental data have been given in Table 1. As seen from Table 1, protein contents of plant species have approximately changed in the range of 300 to 2200 mg per 100 g dry weight of plants. This result indicates that the protein contents of plants are high. Again, from Table 1, it can be said that G. glabra L. and M. piperita L. have the highest protein content.
REFERENCES
Andre CM, Oufir M, Guignard C, Hoffmann L, Housman JF, Evers D, Larondelle Y (2007). Antioxidant profiling of native Andean potato tubers (Solanum tuberosum L.) reveals cultivars with high levels of β-carotene, α-tocopherol, chlorogenic acid, and petanin. J. Agr. Food Chem., 55:10839–10849.
Andreasen MF, Christensen PL, Meyer SA Hansen A (2000). Content of phenolic acids and ferulic acid dehydrodimers in 17 rye (Secale cereale L.) varieties. J. Agr Food Chem., 48:2837-2842.
Barba AIO, Hurtado MC, Mata MCS, Ruiz VF (2006). Application of a UV–vis detection-HPLC method for a rapid determination of lycopene and β-carotene in vegetables. Food Chem., 95:328–336.
Bruni R, Medici A, Guerrini A, Scalia S, Poli F, Romagnoli C, Muzolli M, Sachetti G (2002). Tocopherol, fatty acids and sterol distributions in wild ecuadorian Theobroma subincanum (Sterculiaceae) seeds. Food Chem., 77:337-341.
Dastmalchi K, Dorman HJD, Oinonen PP, Darwis Y, Laakso I, Hiltunen R (2008). Chemical composition and in vitro antioxidative activity of a lemon balm (Melissa officinalis L.) extract. LWT-Food Sci. Technol., 41: 391-400.
Dogan S, Dogan M (2004). The determination of kinetic properties of polyphenol oxidase from Thymus (Thymus longicaulis
subsp.chaubardii var. chaubardii). Food Chem., 88:69-77.
Dogan S, Arslan O, Ozen F (2005). Polyphenol oxidase activity of oregano at different stages. Food Chem., 91:341–345.
Dogan S, Turan P, Dogan M (2006). Some kinetic properties of polyphenol oxidase from Thymbra spicata L. var. Spicata. Process Biochem., 41:2379-2385.
Dogan S, Turan P, Dogan M Alkan M, Arslan O, (2007). Partial characterization of peroxidase from the leaves of Thymbra plant (Thymbra spicata L. var. spicata). Eur. Food Res. Technol., 225:865-871.
Dogan S, Turan Y, Ertürk H, Arslan O (2005). Characterization and purification of polyphenol oxidase from artichoke (Cynara scolymus L.). J. Agr. Food Chem., 53:776-785.
Gama JJT, Sylos CM (2005). Major carotenoid composition of Brazilian Valencia orange juice: Identification and quantification by HPLC. Food Res. Int., 38:899–903.
Jankovska P, Copikava J, Sinitsya A (2001). Determination of ferulic acid in Sugar Beet Pulp. Institue of Chemical Techonology, 19:143– 147.
Kahkonen MP, Hopia AI, Vuorela HJ, Raucha JP, Pihlaja K, Kujala TS Heinonen M (1999). Antioxidant activity of plant extracts containing phenolic compounds. J. Agric. Food Chem., 47:3954–3962.
Kim YN, Giraud DW, Driskell JA (2007). Tocopherol and carotenoid contents of selected Korean fruits and vegetables. J. Food Composed Anal., 20:458–465.
Lu GH, Chan K, Leung K, Chan CL, Zhao ZZ , Jiang ZH (2005). Assay of free ferulic acid and total ferulic acid for quality assessment of
Angelica sinensis. J. Chromatogr., 1068:209–219.
Ross KA, Beta T, Arntfield SD (2009). A comparative study on the phenolic acids identified and quantified in dry beans using HPLC as affected by different extraction and hydrolysis methods. Food Chem., 113:336–344.
Sanchez–Manchado DI, Lopez-Servantes J, Vazquez NJR (2006). High-performance liquid chromatography method to measure α- and γ-tocopherol in leaves, flowers and fresh beans from Moringa
oleifera. J. Chromatogr. A., 1105:111–114.
Singh J, Upadhyay AK, Prasad K, Bahadur A, Rai M (2007). Variability of carotenes, vitamin C, E and phenolics in Brassica vegetables. J. Food Compos. Anal., 20:106–112.
Singleton VL, Rossi JA (1965). Colorimetri of total phenolics with phosphomolybdic-phosphotungstic acid reagents. Am. J. Enol., 16: 144-158.
Slattery ML, Benson J, Curtin K, Ma KN, Schaeffer D, Potter JD (2000). Carotenoids and colon cancer. Am. J. Clin. Nutr., 71:575–582. Szymanska R, Kruk J (2008). Tocopherol content and isomers’
composition in selected plant species. Plant Physiol. Biochem., 46:29-33.
Taspinar M, Kurban S, Mehmetoğlu I (2008). Diyete E vitamini eklenmesinin hiperkolesterolemik kisilerde serum lipidleri üzerine olan etkisinin arastırılması. Tıp Arastırmaları Dergisi 6:20-25. Tekeli Y, Sezgin M, Sanda MA (2008). Konya’da yetisen Centaurea
pterocaula Truatv.’ın fenolik yapısı ve antioksidan etkisi. SDU Fen Edebiyat Fakültesi Fen Dergisi (E-Dergi) 3:35-41.
Vilasova-Martinez M, Calaza-Ramos C, Lopez-Hernandez J, Lage-Yusty MA, Losada PP, Rodrigez-Bernaldo QA (2008). Determination of vitamin E and carotenoid pigments by high performance liquid chromatography in shell of Chionoecetes opilio. Anal. Chim. Acta., 617:225-229.
Wall MM (2006). Ascorbic acid, vitamin A, and mineral composition of banana (Musa sp.) and papaya (Carica papaya) cultivars grown in Hawaii. J. Food Compos. Anal., 19:434–445.
Wang H, Provan GJ, Helliwell K (2003). Determination of hamamelitannin, catechins and gallic acid in witch hazel bark, twig and leaf by HPLC. J. Pharmaceut. Biomed., 33:539-544.
Yen GC, Wu JY (1993). Antioxidant and radical scavenging properties of extracts from Ganoderma tsuage. Food Chem., 65:375–379. Yen GC, Chang YC, Su SW (2003). Antioxidant activity and active
compounds of rice koji fermented with Aspergillus candidus. Food Chem., 83:49-54.
Zuniga OC, Jimenez GF, Gordillo RM (2005). Comparative study of carotenoid composition in three mexican varieties of Capsicum