See discussions, stats, and author profiles for this publication at: https://www.researchgate.net/publication/313268472
Histone H3.3 regulates mitotic progression in mouse embryonic fibroblasts
Article in Biochemistry and Cell Biology · February 2017DOI: 10.1139/bcb-2016-0190 CITATIONS 0 READS 146 9 authors, including:
Some of the authors of this publication are also working on these related projects:
Anticancer activity of natural productsView project
Aysegul Ors Bilkent University
2PUBLICATIONS 52CITATIONS
SEE PROFILE
Christophe Papin
Institut de Génétique et de Biologie Moléculaire et Cellulaire
28PUBLICATIONS 275CITATIONS
SEE PROFILE Bertrand Favier
Université Grenoble Alpes
48PUBLICATIONS 1,361CITATIONS
SEE PROFILE
Mehmet Ozturk Dokuz Eylul University
164PUBLICATIONS 7,519CITATIONS
SEE PROFILE
All content following this page was uploaded by Christophe Papin on 29 September 2017. The user has requested enhancement of the downloaded file.
ARTICLE
Histone H3.3 regulates mitotic progression in mouse
embryonic fibroblasts
Aysegul Ors, Christophe Papin, Bertrand Favier, Yohan Roulland, Defne Dalkara, Mehmet Ozturk,
Ali Hamiche, Stefan Dimitrov, and Kiran Padmanabhan
Abstract: H3.3 is a histone variant that marks transcription start sites as well as telomeres and heterochromatic sites on the genome. The presence of H3.3 is thought to positively correlate with the transcriptional status of its target genes. Using a conditional genetic strategy against H3.3B, combined with short hairpin RNAs against H3.3A, we essentially depleted all H3.3 gene expression in mouse embryonic fibroblasts. Following nearly complete loss of H3.3 in the cells, our transcriptomic analyses show very little impact on global gene expression or on the localization of histone variant H2A.Z. Instead, fibroblasts displayed slower cell growth and an increase in cell death, coincident with large-scale chromosome misalignment in mitosis and large polylobed or micronuclei in interphase cells. Thus, we conclude that H3.3 may have an important under-explored additional role in chromosome segregation, nuclear structure, and the maintenance of genome integrity.
Key words: H3.3, transcription, mouse embryonic fibroblasts, RNA-seq, mitosis.
Résumé : H3.3 est un variant d’histone qui marque les sites d’initiation de la transcription de même que les télomères et les sites hétérochromatiques du génome. La présence de H3.3 est présumée corréler positivement avec l’état transcriptionnel de ses gènes cibles. En utilisant une stratégie génétique conditionnelle contre H3.3 combinée a` un petit ARN en épingle a` cheveux dirigé contre H3.3, les auteurs ont essentiellement éteint toute expression génique de H3.3 dans des fibroblastes embryonnaires de souris. À la suite de la perte quasiment complète de H3.3 dans les cellules, leurs analyses transcriptomiques montrent un très faible impact sur l’expression génique globale de même que sur la localisation du variant d’histone H2A.Z. Les fibroblastes présentent plutôt une croissance cellulaire plus lente et un accroissement de la mort cellulaire en étroite concordance avec un mauvais alignement chromosomique a` grande échelle lors de la mitose et de grandes structures nucléaires polylobées et des micronoyaux dans les cellules en interphase. Ils concluent ainsi que H3.3 pourrait aussi jouer un rôle important sous-exploré dans la ségrégation des chromosomes, la structure nucléaire et le maintien de l’intégrité du génome.
Mots-clés : H3.3, transcription, fibroblastes embryonnaires de souris, RNA-seq, mitose.
Introduction
The replacement of canonical histones (core constituents of chromatin) by their variants drives chromatin dynamics and al-lows for the functional and structural regulation of key cellular mechanisms (Boulard et al. 2007;Henikoff 2008). In contrast with dependent (RD) histones, the deposition of replication-independent (RI) histones occurs in a cell cycle replication-independent manner (Henikoff et al. 2004). There are RI variants for all the RD histones except for histone H4 (Hake et al. 2005;Pusarla and
Bhargava 2005). The histone H3 variant H3.3 differs from its RD
counterparts H3.1 and H3.2 by only 5 or 4 amino-acids, respec-tively (Szenker et al. 2011). Murine H3.3 is coded by 2 genes; H3f3a on chromosome 1 and H3f3b on chromosome 17, which despite variable mRNA sequences encode identical proteins (Krimer et al.
1993).
H3.3-containing nucleosomes, especially when associated with the histone H2A variant H2A.Z, may be promoting a less stable chromatin structure, favorable for an active transcription state
(Jin and Felsenfeld 2007;Jin et al. 2009). Accordingly,
genome-Received 22 September 2016. Accepted 22 January 2017.
Abbreviations: TSS, transcription start sites; MEF, mouse embryonic fibroblasts; ESC, embryonic stem cells; KO, knock-out; Kd, knock-down; ERV,
endogenous retroviral elements; LTR, long terminal repeats; LINE and SINE, long and short interspersed nuclear element; qPCR, quantitative polymerase chain reaction; RNA-seq, ribonucleic acid sequencing; RT–qPCR, reverse transcription quantitative polymerase chain reaction; rRNA, ribosomal RNA; SEM, standard error of the mean; PI, propidium iodide; WT, wild-type.
A. Ors.* Université de Grenoble Alpes, Institute for Advanced Biosciences, INSERM U1209/CNRS 5309, 38700 La Tronche, France; Department of Molecular
Biology and Genetics, Faculty of Science, Bilkent University, 06800 Ankara, Turkey.
C. Papin* and A. Hamiche. Université de Strasbourg, Institut de Génétique et Biologie Moléculaire et Cellulaire (IGBMC), CNRS, INSERM, Equipe
labélisée Ligue contre le Cancer, 1 rue Laurent Fries, B.P. 10142, 67404 Illkirch Cedex, France.
B. Favier. Université de Grenoble Alpes, Team GREPI, Etablissement Français du Sang, EA 7408, BP35, 38701 La Tronche, France.
Y. Roulland, D. Dalkara, and S. Dimitrov. Université de Grenoble Alpes, Institute for Advanced Biosciences, INSERM U1209/CNRS 5309, 38700 La Tronche,
France.
M. Ozturk. Izmir Biomedicine and Genome Center, Faculty of Medicine, Dokuz Eylül University, Izmir, Turkey.
K. Padmanabhan. Université de Lyon, Institut de Génomique Fonctionnelle de Lyon, CNRS UMR 5242, Ecole normale supérieur de Lyon, Université Claude
Bernard Lyon 1, 46 Allée d’Italie, F-69364 Lyon, France.
Corresponding authors: Kiran Padmanabhan (email:[email protected]), Stefan Dimitrov (email:[email protected]), Ali Hamiche (email:[email protected]).
*These authors contributed equally to this paper.
Copyright remains with the author(s) or their institution(s). Permission for reuse (free in most cases) can be obtained fromRightsLink.
Biochem. Cell Biol. Downloaded from www.nrcresearchpress.com by 130.79.79.217 on 09/29/17
wide localization studies have mapped H2A.Z and H3.3 at pro-moter regions and TSS, and H3.3 density positively correlates with active transcription. However, H3.3 was also found to be associ-ated with repressed genes and heterochromatic sites such as peri-centric sites, telomeres, and retroviral elements (Drané et al. 2010;
Goldberg et al. 2010;Bargaje et al. 2012;Kraushaar et al. 2013;
Elsässer et al. 2015). The difference in distribution may reflect
distinct targeting chaperone complexes. While the histone chap-erone HIRA/Ubinuclein (UBN1) targets H3.3 localization to TSS, the death domain associated protein (DAXX) together with its chro-matin remodeling partner Alpha Thalassemia/mental retardation syndrome X-Linked (ATRX) are responsible for H3.3 deposition at pericentric heterochromatin and telomeres (Drané et al. 2010;
Goldberg et al. 2010;Szenker et al. 2011;Ricketts et al. 2015).
Owing to its presence at promoters and its higher enrichment at TSS and gene bodies of highly expressed genes (Goldberg et al. 2010), H3.3 has been strongly associated with a role in active tran-scription. It would thus be expected that transcription levels be highly impacted in the absence of H3.3. Intriguingly, however, studies in the developing embryo have shown that H3.3 depletion appears to have limited effect on gene transcription; instead, it seems to play an important role in the maintenance of genomic integrity (Bush et al. 2013;Jang et al. 2015). There is an increase in mitotic defects and consequent aneuploidy as well as DNA dam-age in H3.3B knock-out mouse embryonic fibroblasts (MEF) (Bush
et al. 2013) and H3.3 depleted embryonic stem cells (ESCs)
(Banaszynski et al. 2013), which is indicative of chromosome
struc-ture dysfunction. Heterochromatin at telomeric, centromere, and pericentromeric repeat sequences presents a more open structure in the absence of H3.3, indicating a role for H3.3 in chromatin compaction (Jang et al. 2015).
Using a conditional gene-targeting strategy, we knocked out the histone H3f3b gene in MEFs, and then, using short hairpin RNAs against H3.3A mRNA in these cells, we derived cell lines that were essentially completely depleted of H3.3 expression. Deep RNA se-quencing identified a set of nearly 800 genes that were mildly either up- or down-regulated in H3.3-depleted fibroblasts. Our re-sults indicate that the loss of H3.3 has minimal impact on H2A.Z localization at the TSS and overall transcriptional rates. Impor-tantly, H3.3 knockout cells display serious defects in mitotic pro-gression, including chromatin bridges in anaphase and misaligned chromosomes in metaphase, and also limits cell proliferation.
Materials and methods
Mouse strains
The FH-H3.3B mutant mouse line was established at the Phenomin-iCS (Phenomin – Institut Clinique de la Souris, Illkirch, France;http://www.ics-mci.fr/en/). The targeting vector was con-structed as follows. A 0.5 kb fragment encompassing exon 2 was amplified by PCR (from 129S2/SvPas ES cells genomic DNA) and subcloned in an iCS proprietary vector. This iCS vector contains a LoxP site as well as a floxed and flipped Neomycin resistance cassette. A DNA element encoding the FLAG–FLAG–HA epitope sequence was inserted in frame with the N terminus of H3.3B. A 4.5 kb fragment (corresponding to the 5= homology arm) and 3.5 kb fragment (corresponding to the 3= homology arms) were amplified by PCR and subcloned. The linearized construct was electroporated in 129S2/SvPas mouse embryonic stem (ES) cells. After selection, targeted clones were identified by PCR using ex-ternal primers and further confirmed by Southern blot with 5= and 3= external probes. Two positive ES clones were injected into C57BL/6N blastocysts, and the male chimaeras derived gave germ-line transmission. Mice were housed in the mouse facility of the Plateforme de haute Technologie Animale (PHTA, Grenoble, France; agreement number C 38 516 10001, registered protocol no. 321 at ethical committee C2EA-12).
Cell culture
Mouse embryonic fibroblasts (MEFs) were derived from E13.5 embryos. Heads and internal organs were removed, and the torso was minced into chunks of tissue. Cells were cultured in high glucose Dulbecco’s modified Eagle medium (DMEM), with sodium pyruvate, Glutamax (Gibco), 10% fetal bovine serum (FBS), and penicillin–streptomycin in a humidified incubator at 37 °C and a 5% CO2atmosphere. Cells were maintained in culture using the
3T3 protocol (Xu 2005). H3f3bfl/flMEFs were infected with adenovi-rus expressing Cre recombinase (Ad-CMV-iCre, Vector Biolabs, Philadelphia, Pennsylvania, USA) to disrupt the endogenous H3f3b allele. Virus was diluted in serum-free DMEM at a multiplicity of infection of 500. Infection medium was replaced with fresh com-plete medium the next day, and the cells were analyzed for knock-out efficiency after 3 days.
Virus production and infections
293T cells were co-transfected with pLP1, pLP2, pLP3, and pLKO.1-shRNA vectors at a ratio of 1:0.5:0.6:2, respectively, using Lipofectamine 2000 reagent (Invitrogen). We used shRNA against H3.3A mRNA (Dharmacon GE, TRCN0000012026) to knock-down H3.3A or a scrambled control shRNA as the control (shControl). Transfection medium was replaced the next day with fresh complete medium. Viral supernatant was collected 48 h post-transfection and filtered through 0.45m filters. H3.3B-KO MEFs at ⬃70% conflu-ence were infected with the viral supernatant. Infection medium was replaced the next day, and cells were selected with 3g/mL puromycin. Cells were analyzed for knock-down efficiency 3 days later.
RT– qPCR
For gene expression analysis, total RNA was extracted with TRI-zol (Life Technologies) and reverse-transcribed with Superscript II (Invitrogen) and random hexamer mix. Ribosomal protein S9 was used as the reference gene. TaKaRa SYBR qPCR Premix Ex Taq (Tli RNaseH Plus) and a LightCycler 480 (Roche) real-time system were used. RT–qPCR cycling conditions were as follows: 3 min at 95 °C, 10 s at 95 °C, 30 s at 60 °C, repeated ×40.
The gene-specific primers used were as follows: Rps9_F, 5=-TTGTCGCAAAACCTATGTGACC-3=; Rps9_R, 5=-GCCGCCTTACG-GATCTTGG-3=; H3f3a_F, 5=-ACAAAAGCCGCTCGCAAGAG-3=; H3f3a_R, 5=-ATTTCTCGCACCAGACGCTG-3=; H3f3b_F, 5=-TGGCTCTGA-GAGAGATCCGTCGTT-3=; H3f3b_R, 5=-GGATGTCTTTGGGCATGATGG-TGAC-3=; Gadd45a_F, 5=-TGCTGCTACTGGAGAACGAC-3=; Gadd45a_R, 5=-TCCATGTAGCGACTTTCCCG-3=; PDGFb_F, 5=-GAG-TCGGCATGAATCGCTG-3=; PDGFb_R, GCCCCATCTTCATC-TACGGA-3=; Edn1_F, CCCACTCTTCTGACCCCTTT-3=; Edn1_R, 5=-GGCTCTGCACTCCATTCTCA-3=; Gas2_F, 5=-GCCGAGATT-TGGGAGTTGAT-3=; Gas2_R, 5=-GCTTTATCAGACCAGGAGGC-3=; Seh1l_F, ATGACGGCTGTGTTAGGTTGT-3=; Seh1l_R, 5=-TACTCAGCTGTGCTTTCTGCT-3=; Smad6_F, 5=-GCCACTGGATCTGTC-CGATT-3=; Smad6_R, 5=-GGTCGTACACCGCATAGAGG-3=.
Western blot
Cells were plated in 6-well plates and collected in 200L of 2× Laemmli sample buffer (4% sodium dodecyl sulfate (SDS), 20% glycerol, 125 mmol/L Tris–HCl (pH 6.8), 10%-mercaptoethanol, 0.02% bromophenol blue). After brief sonication to fragment the DNA, 20L of sample was loaded and separated on 15% SDS gels for polyacrylamide gel eletrophoresis (SDS–PAGE). Proteins were detected using anti-FLAG (Sigma–Aldrich F3165; 1:2000) and anti-H4 (Abcam ab10158; 1:5000).
RNA-seq
After isolation of total cellular RNA from subconfluent MEFs using TRIzol reagent, libraries of template molecules suitable for strand-specific high-throughput DNA sequencing were created us-ing a TruSeq Stranded Total RNA with Ribo-Zero Gold Prep Kit
492 Biochem. Cell Biol. Vol. 95, 2017
Published by NRC Research Press
Biochem. Cell Biol. Downloaded from www.nrcresearchpress.com by 130.79.79.217 on 09/29/17
(RS-122-2301; Illumina). Briefly, starting with 300 ng of total RNA, the cytoplasmic and mitochondrial ribosomal RNA (rRNA) were removed using biotinylated, target-specific oligos combined with Ribo-Zero rRNA removal beads. Following purification, the RNA was fragmented into small pieces using divalent cations under elevated temperature. The cleaved RNA fragments were copied into first-strand cDNA using reverse transcriptase and random primers, followed by second-strand cDNA synthesis using DNA Polymerase I and RNase H. The double-stranded cDNA fragments were blunted using T4 DNA polymerase, Klenow DNA polymerase, and T4 PNK. A single “A” nucleotide was added to the 3= ends of the blunt DNA fragments using a Klenow fragment (3= to 5= exo minus) enzyme. The cDNA fragments were ligated to double-stranded adapters using T4 DNA Ligase. The ligated products were enriched by PCR amplification (30 s at 98 °C; followed by 10 s at 98 °C, 30 s at 60 °C, 30 s at 72 °C, repeated for ×12 cycles; then 5 min at 72 °C. Then, surplus PCR primers were removed by purification using AMPure XP beads (Agencourt Biosciences Corporation). Fi-nal cDNA libraries were checked for quality, and quantified using a 2100 Bioanalyzer (Agilent). The libraries were loaded in the flow cell at a concentration of 7 pmol/L, and clusters were generated in the Cbot and sequenced in the Illumina Hiseq 2500 as single-end 50 base reads following Illumina’s instructions. Image analysis and base calling were performed using RTA 1.17.20 and CASAVA 1.8.2. Reads were mapped onto the mm9 assembly of the mouse genome using Tophat (Trapnell et al. 2009) and the bowtie aligner
(Langmead et al. 2009). Quantification of gene expression was
performed using HTSeq (Anders et al. 2015) and gene annotations from Ensembl release 67. Read counts have been normalized across libraries with the statistical method proposed by Anders and Huber (Anders et al. 2010) and implemented in the DESeq Bioconductor library. Resulting P-values were adjusted for multiple testing by using the Benjamini and Hochberg method (Hochberg
and Benjamin 1990).
The RNA-seq datasets (raw data as well as processed expression datasets) obtained in MEFs have been deposited in the Gene Ex-pression Omnibus (GEO) under the accession number GSE84308. Repeat analysis
Repeat analyses of RNA-seq datasets were performed as follows. Reads were aligned to repetitive elements in 2 passes. In the first pass, reads were aligned to the non-masked mouse reference
ge-nome (NCBI37/mm9) using BWA version 0.6.2 (Li and Durbin
2009). Positions of the reads uniquely mapped to the mouse ge-nome were cross-compared with the positions of the repeats ex-tracted from UCSC (RMSK table in UCSC database for mouse genome mm9), and reads overlapping a repeat sequence were annotated with the repeat family. In the second pass, reads not mapped or multimapped to the mouse genome in the previous pass were aligned to RepBase version 18.07 (Jurka et al. 2005) repeat sequences for rodent. Reads mapped to a unique repeat family were annotated with their corresponding family name. Finally, we summed up the read counts per repeat family of the two annotation steps. Data were normalized based upon library size. Difference of repeat read counts between samples was ex-pressed as the log2-ratio (shH3.3A/shControl). The statistical
sig-nificance of the difference between samples was assessed using the Bioconductor package DESeq. Processed datasets were re-stricted to repeat families with more than 100 mapped reads per RNA sample to avoid over- or under-estimating fold enrichments due to low sequence representation.
Chromatin immunoprecipitation
Chromatin immunoprecipitation (ChIP) experiments were per-formed from 15 cm dishes of subconfluent MEFs.
For H2A.Z ChIP, cells were crosslinked with 1% paraformalde-hyde for 7 min at room temperature. The reaction was stopped by adding glycine to a final concentration of 0.125 mol/L for 5 min.
Input chromatin was diluted 1:10 for a final ChIP buffer composi-tion of 20 mmol/L Tris (pH 8.0), 150 mmol/L NaCl, 2 mmol/L EDTA, 0.1% SDS, 1% Triton-X. Then, 5g of anti-immunoglobulin G (IgG) control (Abcam ab46540) or polyclonal anti-H2A.Z antibodies were added and incubated over-night on a rotary shaker at 4 °C. A mix of 8L of magnetic protein A and 8 L magnetic protein G beads (Dynabeads, Lifetechnology) were washed in ChIP buffer, resuspended in the original volume, and added to the ChIP sam-ples for 4–6 h (rotary shaker, 4 °C). The magnetic beads were collected on a magnetic rack and washed for 5 min with ChIP buffer, 5 min with Wash buffer II (20 mmol/L Tris (pH 8.0), 500 mmol/L NaCl, 2 mmol/L EDTA, 0.1% SDS, 1% Triton-X) and 5 min with Wash Buffer III (10 mmol/L Tris–HCl (pH 8.0), 1 mmol/L EDTA, 0.25 mol/L LiCl, 1% NP-40, 1% sodium-deoxycholate (Na-DOC)). Immunoprecipitated material was eluted twice in 100 L of elution buffer (SDS 1%, 0.1 mol/L NaHCO3) for 15 min at room temperature, and crosslinks were reversed by incubating at 65 °C overnight.
For HA-H3.3 ChIP, 100g of nuclei were digested with 2 U of Micrococcal nuclease S7 (Roche 10107921001) in digestion buffer (10 mmol/L Tris–HCl (pH 7.5), 3 mmol/L CaCl2, 1× protease
inhibi-tors) for 12 min at 37 °C. Then, 20g of input chromatin was diluted in native ChIP buffer at a final concentration of 10 mmol/L Tris–HCl (pH 7.5), 80 mmol/L NaCl, 1 mmol/L EDTA, 0.5% Triton-X. Thereafter, 20L of anti-HA affinity matrix (Roche 118150160001) was added and incubated at 4 °C overnight. Chromatin-isolated form wild-type MEFs with no HA epitope were used as the negative control. Bead-immunoprecipitated material was washed on ro-tary shaker with 10 mmol/L Tris–HCl (pH 7.5), 80–150 mmol/L NaCl, 1 mmol/L EDTA, and 0.5% Triton-X prior to elution and qPCR analysis.
Primers used for TSS analysis by qPCR were as follows: Gadd45a-TSS_F, 5=-TTTCCGCTCAACTCTGCCTT-3=; Gadd45a-TSS_R, 5=-ACTCTGCACTGCTGCCTC-3=; Pdgfb-TSS_F, 5=-AGCTCTGCGCTT-TCTGATCT-3=; Pdgfb-TSS_R, 5=-GATGGTTCGTCTTCACTCGC-3=; Edn1-TSS_F, 5=-AACTAATCTGGTTCCCCGCC-3=; Edn1-TSS_R, 5=-GAG-GTGGGGCTGATCATTGT-3=; Gas2-TSS_F, 5=-GTTACTAGAAAGCTCATG-CCACT-3=; Gas2-TSS_R, 5=-CCCAAACACTAAGCTAAGACAGA-3=; Seh1l-TSS_F, 5=-TCATCACTGACTGCTGCTTC-3=; Seh1l-TSS_R, 5=-CTT-AGGAATGATGGGGACGC-3=; Smad6-TSS_F, 5=-ATATCCTTCTGGGTC-TTGCCA-3=; Smad6-TSS_R, 5=-GCTCAAGGGTGTCAGCAAAA-3=. Immunofluorescent staining
Cells were fixed in formalin solution (Sigma–Aldrich) for 15 min at 37 °C, permeabilized with 0.2% Triton-X, and incubated with Lamin-B antibody (Santa-Cruz; sc-6217) diluted 1:300 in 10% goat serum – phosphate buffered saline (PBS). Anti-goat IgG coupled with Cyanine 3 (Jackson 705-165-147) was used as a secondary an-tibody. DNA was stained with the Hoechst 33342 (Invitrogen; H3570) intercalating dye. All microscopy was performed on fixed cells with a Zeiss Axio Imager Z1 microscope with a Plan-Apochromat ×63 objective. Z-stacks images were acquired with a Zeiss Axiocam camera piloted with the Zeiss Axiovision 4.8.10 software. All image treatment was performed using Fiji (ImageJ 2.0.0-rc14) (Schindelin
et al. 2012,2015).
FACS analysis
Cells were trypsinized and fixed in cold 70% ethanol overnight. After washing with PBS, cells were stained with PI solution con-taining 5g/L PI (Sigma–Aldrich) and 200 g/mL RNase A at 37 °C for 30 min. Approximately 100 000 cells per condition were ana-lyzed using an Accuri C6 (BD Biosciences). The percentage of cells in each phase of the cell cycle was determined using ModFit 4.1 software.
Biochem. Cell Biol. Downloaded from www.nrcresearchpress.com by 130.79.79.217 on 09/29/17
Results
A combined genetic and shRNA strategy allows nearly complete depletion of H3.3 expression in mouse embryonic fibroblasts
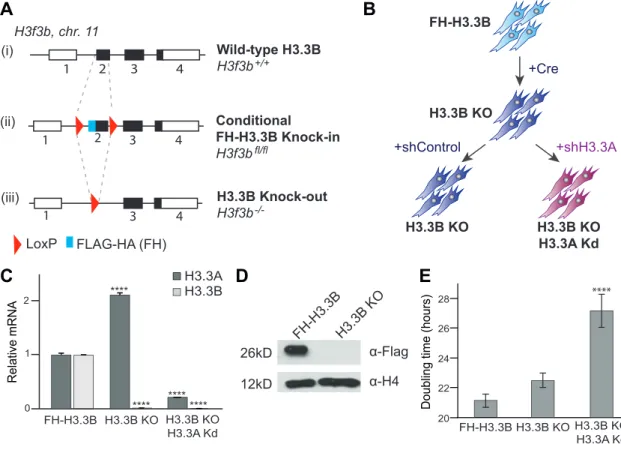
Figure 1Adescribes the strategy used to generate the transgenic
knock-in epitope-tagged FLAG-FLAG-HA-H3.3B (FH-H3.3B) mouse line. Pregnant transgenic knock-in animals were sacrificed on day 13.5 post-fertilization, and isolated embryos were used to derive mouse embryonic fibroblasts (MEFs) using the 3T3 protocol (Xu
2005) (Fig. 1B). Cells were treated with a Cre expressing adenovirus
to generate H3.3B knockout (H3.3B-KO) cells in culture. Single cells were selected and clonally expanded and genotyped to con-firm the deletion of the H3f3b gene. Loss of H3.3B expression was verified by RT–qPCR as well as by immunoblotting for the Flag epitope (Figs. 1Cand1D). H3.3B-KO MEFs were then subsequently stably transfected with a scrambled control shRNA (shControl) or an shRNA targeting the coding sequence of H3.3A mRNA (shH3.3A). H3.3B-KO cells transduced with control shRNA (shControl) dis-played a fold-increase in H3.3A mRNA levels, whereas cells treated with shRNA against H3.3A (shH3.3A) showed a near complete knock-down (Kd) of H3.3A mRNA expression (Fig. 1C). All of the cells displayed fibroblast-like behavior, and H3.3 depleted cell
lines (H3.3B-KO/H3.3A-Kd) were slower to grow in culture, as shown by the increase in their doubling time (Fig. 1E).
H3.3 depletion has a mild effect on the global transcriptome
We then isolated total RNA from control shRNA treated H3.3B-KO cells and from H3.3B-KO/H3.3A-Kd MEFs, and carried out Ribozero RNA-seq analysis. RNA-seq analysis was carried out on pooled datasets from duplicate biological experiments. As seen in the RT–qPCR experiments (Fig. 1C), H3.3A expression was sig-nificantly reduced in the H3.3B-KO/H3.3A-Kd MEF cells (Fig. 2A). A large fraction of the expressed genome does not change at the transcriptomic level in H3.3-depleted cells. Around 4% of the tran-scribed genes in MEFs (800 genes in total) are mildly misregulated in H3.3-depleted cells, with⬃400 of them displaying up-regulated expression and another 400 with down-regulated expression with respect to the control cells (P < 0.05 cutoff) (Fig. 2B).
H3.3 was recently implicated in the maintenance of the silent state of ERVs in the mouse genome (Elsässer et al. 2015). However, no significant changes could be seen in the global transcription of DNA repeats such as retro-elements (including LTR, ERV, LINE and SINE) or tandem repeats (including major satellites, telomeres, Fig. 1. Generation of H3.3 mouse embryonic fibroblast (MEF) models and H3.3 expression. A. (i) Wild-type H3f3b gene structure. The open reading frame is indicated by black boxes. (ii) A DNA element encoding the FLAG–FLAG–HA amino acids was inserted in frame with the N terminus of H3.3B. In addition, a loxP site was inserted on both ends of Exon 2. A mouse line was derived from embryonic stem (ES) cells carrying the modified H3f3bfl/flallele. (iii) Structure of the H3.3B knock-out (KO), after Cre recombinase expression, which deletes exon 2 and
generates loss of function (KO) allele, H3f3b−/−. B. The FH-H3.3B MEFs isolated from H3f3bfl/flembryos at 13.5 dpf. Immortalized MEFs were
infected with Cre recombinase expressing adenovirus to generate loss of function allele. H3f3b−/−MEFs were further infected with either a scrambled control shRNA (shControl) or one targeting the H3.3A mRNA (shH3.3A) to produce H3.3B-KO/H3.3A knock-down (Kd) MEFs. C. Relative H3.3 RNA expression in MEFs. RT–qPCR mRNA profiles normalized to ribosomal protein S9 (Rps9) mRNA and relative to the values obtained for the control FH-H3.3B MEFs set at 1.0 ± SEM. One-way ANOVA gave P < 0.001 for FH-H3.3B compared with H3.3B-KO, and P < 0.01 for FH-H3.3B compared with H3.3B-KO/H3.3A-Kd; n = 4. D. Western blot analysis of the loss of FH-H3.3B expression after Cre expression. E. Average doubling times in MEFs: 25 000 cells of each cell type were plated and counted at different times to calculate the doubling time. Error bars represent the standard deviation; one-way ANOVA gave P < 0.001 for FH-H3.3B compared with H3.3B-KO/H3.3A-Kd; n = 4. [Colour online] LoxP FLAG-HA (FH) +Cre +shControl +shH3.3A FH-H3.3B H3.3B KO H3.3B KO H3.3A Kd H3.3B KO FH-H3.3B α-Flag α-H4 H3.3B KO 12kD 26kD
D
B
A
E
H3.3B KO H3.3B KO H3.3A Kd FH-H3.3B 20 28 26 24 22Doubling time (hours)
****
C
FH-H3.3B H3.3B KO H3.3B KO H3.3A Kd H3.3A H3.3B 0 1 2 Relative mRNA **** **** **** **** (i) 1 2 3 4 Conditional FH-H3.3B Knock-in H3f3b (ii) 1 3 4 H3.3B Knock-out H3f3b (iii) H3f3b, chr. 11 Wild-type H3.3B H3f3b 1 2 3 4 +/+ fl/fl-/-494 Biochem. Cell Biol. Vol. 95, 2017
Published by NRC Research Press
Biochem. Cell Biol. Downloaded from www.nrcresearchpress.com by 130.79.79.217 on 09/29/17
and microsatellites), which account for more than 40% of the mouse genome (Fig. 2C). Functional clustering of differentially expressed genes indicated significant down-regulation of genes implicated in lipid and sterol processing while factors involved in cell adhesion and motility were up-regulated (Fig. 2D). There was
also dysregulation in the expression of genes involved in cell cycle progression (Fig. 2E). We compared our gene expression profile with that of the H3.3 null embryos in a p53-null background (Jang
et al. 2015) and to H3.3B-KO/H3.3A-Kd ESCs (Banaszynski et al.
2013). Even though all 3 studies indicate very little impact on Fig. 2. Genome-wide transcriptome analysis of mouse embryonic fibroblasts (MEFs) in the absence of H3.3. A. Bar graph representing H3.3A expression in control H3.3B knock-out (KO) and H3.3A knock-down (Kd)/H3.3B-KO/H3.3A-Kd MEFs. B. Scatter plots comparing gene expression profiles of control (shControl) and H3.3B-KO/H3.3A-Kd (shH3.3A) MEFs. Red dots indicate differentially expressed genes (P < 0.05 and
|log2fc| > 1). C. Scatter plots comparing global transcription of repeat families in H3.3B-KO and H3.3B-KO/H3.3A-Kd MEFs. D. Functional annotation clustering of differentially expressed genes. E. List of the differentially expressed genes implicated in mitosis. F. Comparative analysis of the differentially expressed genes in H3.3-deficient embryos (Jang et al. 2015) and in H3.3-depleted embryonic stem cells
(Banaszynski et al. 2013). Lists of genes that show similar patterns of up- or down-regulation in transcription are indicated.[Colour online]
A
B
E
C
D
104 102 1 1 102 104 P < 0.05 and |log2 fc| > 1 P > 0.05 or |log2 fc| < 1 Down-regulated genes, n=401 Up-regulated genes, n=449H3.3B KO (normalized read counts)
H3.3B KO/H3.3A
Kd
(normalized read counts)
Annotation cluster Enrichment score P value
Secreted/glycoprotein 17.57 1,10E-22
Microsome 10.41 3,90E-16
Polysaccharide binding 6.94 1,80E-06
Complement/immune response 6.56 1,50E-16
Steroid metabolic process 4.94 8,40E-05
High-density lipoprotein 4.9 2,00E-08
Secreted/glycoprotein 8.5 1,40E-08
Contractile fiber 8.37 1,50E-08
Cell adhesion 7.47 9,60E-06
Down Up read counts (rpkm) 0 500 1000 1500 2000 2500 3000 H3.3B KO H3.3A Kd H3.3B KO P < 10-20 101 102 103 104 105 106 107 101 102 103 104 105 106 107 H3.3B KO (normalized read counts)
P < 0.05 and |log2 fc| > 1 P > 0.05 or |log2 fc| < 1
H3.3B KO/H3.3A
Kd
(normalized read counts)
Prox1 Gas1 Gas2 Seh1l Smad6 Ereg Cdk6 Tubb3 Pdgfb Edn1 Cdkn1a Gadd45a -2.53 -1.35 -1.34 -1.35 -1.23 1.13 1.31 1.84 1.88 2.00 2.16 2.23 4.11E-04 8.29E-06 5.36E-05 1.78E-05 1.72E-04 7.62E-03 8.00E-05 1.17E-04 1.41E-03 8.52E-06 2.17E-05 3.22E-09
Gene name Log2 ratio P value
F
Downregulated in H3.3A Kd/H3.3B KO MEFs Upregulated in H3.3 KO embryos Jang et al. Downregulated in H3.3A Kd/H3.3B KO MEFs Upregulated in H3.3A Kd/H3.3B KO ESCs Banaszynski et al. 1 common downregulated gene H3f3a Downregulated inH3.3 KO embryos Jang et al.
Downregulated in H3.3A Kd/H3.3B KO ESCs Banaszynski et al. Upregulated in H3.3A Kd/H3.3B KO MEFs Upregulated in H3.3A Kd/H3.3B KO MEFs
Biochem. Cell Biol. Downloaded from www.nrcresearchpress.com by 130.79.79.217 on 09/29/17
global transcription, an overlap between the datasets was essen-tially non-existent and limited to 9 genes by comparison with the depleted embryos, and 6 genes compared with the H3.3-depleted ESCs (Fig. 2F).
H2A.Z variant dynamics are not affected at differentially expressed genes in H3.3-depleted cells
We then selected 6 genes that were either up- or down-regulated in H3.3B-KO compared with H3.3B-KO/H3.3A-Kd fibro-blasts, and validated their gene expression levels by RT–qPCR analysis (Fig. 3A). While the change in gene expression was about 50% for the selected genes (as seen in the RNA-seq analysis), with the exception of Gadd45a, which was up-regulated nearly 7-fold, most other genes (Pdgfb, Edn1) showed a change in expression of 2- to 3-fold. To determine the extent to which H3.3 is present at the TSS of these 6 candidate genes, we isolated chromatin from FH-H3.3B MEFs and performed native ChIP experiments using an antibody against the HA tag. ChIP on isolated mononucleosomes indicated that H3.3 was highly enriched relative to input DNA at all of the selected candidate TSS regions (Fig. 3B). Mononucleo-somes from wild-type mouse fibroblasts, used as a control for ChIP to rule out non-specific interaction with the antibody, showed essentially no enrichment at the TSS. Thus, while the presence of H3.3 at the transcription start sites is thought to positively corre-late with transcription, its depletion from cells has a muted im-pact on overall transcription rates.
Histone variant H2A.Z also marks the TSS of genes and the presence of dual H3.3-H2A.Z variant nucleosomes is thought to positively regulate inducible transcription (Jin and Felsenfeld
2007;Henikoff 2008;Jin et al. 2009;Obri et al. 2014). We then
tested whether the deposition of the histone variant H2A.Z at the TSS of these selected candidate genes was affected by the deple-tion of H3.3 from the fibroblasts. Crosslinked and sonicated chro-matin was generated from either wild-type, H3.3B-KO cells, or from H3.3-depleted (H3.3B-KO/H3.3A-Kd) cells, and H2A.Z deposi-tion was determined relative to a control IgG (Fig. 3C). At all the TSS examined, loss of H3.3 did not have a significant impact on H2A.Z deposition, regardless of the transcriptional changes of the corresponding genes.
H3.3 depletion results in defective mitotic progression Following the shRNA-mediated depletion of H3.3A, and in stark comparison with the control cells, we observed an increase in the rate of cell doubling time in culture as well as increased rates of cell death. Depletion of H3.3 from fibroblasts resulted in cells with larger nuclei, increased number of micronuclei, and polylobed nuclear structures in interphase cells (Figs. 4A and4B). Loss of H3.3B alone led to a doubling of the number of interphase nuclear defects, whereas complete depletion of H3.3 led to a near 3-fold increase in the appearance of polylobed nuclei and micronuclei
(Fig. 4C). Although there was a ca. 50% reduction in the number of
cells entering mitosis in H3.3-depleted fibroblasts, these cells dis-played marked defects in chromosome alignment at the meta-phase plate and lagging chromosomes in anameta-phase, as well as telophase bridges, indicating chromosome structure dysregula-tion (Figs. 4B,4D, and4E). Finally, FACS analyses indicated that
compared with wild-type or control FH-H3.3B cells, H3.3B-KO and H3.3A-Kd/H3.3B-KO depleted cells showed progressively increased residence time in G0/G1 phase of the cell cycle, and relatively fewer cells in S-phase or mitosis (Fig. 4E).
Discussion and conclusions
Recent research by Jang et al. on H3.3 function in the develop-ing embryo have surprisdevelop-ingly shown that the loss of H3.3 function has very little impact on global transcription, with most affected genes being up- or down-regulated not much greater than 2-fold
(Jang et al. 2015). In this study, we extend our analysis to mouse
embryonic fibroblasts, and intriguingly, observed very similar re-sults to the study by Jang et al.; i.e., little to no effect on global transcription. Using a novel transgenic “conditional knock-in/ knock-out” mouse model for H3.3B, we generated mouse fibro-blasts that yielded H3.3B knockout cells upon Cre expression. Further expression of a specific and efficient shRNA against H3.3A resulted in almost complete depletion of H3.3 expression from fibroblasts. We then performed genome-wide transcriptome anal-ysis and found very few genes (⬃4% of transcribed genes) showing significant changes in gene expression. While this result is similar to what was described in embryos, the ensemble of the affected transcriptome shows little to no overlap between the 2 experi-mental studies. Furthermore, our results suggest that the changes at the transcriptional level in H3.3 knockout cells do not impact histone variant H2A.Z presence at the TSS of the selected genes. Thus, despite the positive correlation between the transcriptional rate of genes and H3.3 accumulation at their corresponding TSS, the global effect on transcription observed upon H3.3 depletion is suggestive of a facilitative role rather than that of an essential positive regulatory factor. This also correlates with what has been observed in the past in mouse embryos as well as stem cells (Wong
et al. 2010;Banaszynski et al. 2013;Jang et al. 2015). Recent data
have demonstrated a silencing role for H3.3 by localization at ERVs in ESCs (Elsässer et al. 2015). Our study has not revealed any impact on ERV transcription upon H3.3 depletion in MEFs. The role of H3.3 in retrotransposon silencing may therefore be specific to pluripotent cells, and replaced by other mechanisms during differentiation.
Thus, our study supports an understudied key role of H3.3 in the maintenance of genome integrity. H3.3 knockout ES cells and mouse fibroblasts show dramatic defects in mitosis with a 3- to 4-fold increase in the number of defects such as lagging chromo-somes and anaphase bridges, while the total number of cells en-tering mitosis is much lower in H3.3 null cells. We also observed significant changes to the nuclear matrix structure in interphase cells, with the appearance of many polylobed nuclei and micro-nuclei in H3.3 depleted cells. Unlike Jang et al., wherein the im-pact of H3.3 loss was studied in a p53-null background, our cells are completely depleted for H3.3B, and H3.3A is knocked-down with greater than 90% efficiency. However, the similarity of the results indicates a key role for H3.3 in regulating faithful chromo-some segregation during mitosis and perhaps in maintaining nu-clear architecture in interphase.
Fig. 3. H3.3 and H2A.Z enrichment at the transcription start sites (TSS) of genes showing differential mRNA expression. A. RT–qPCR assay for gene expression in H3.3B knock-out (KO) and H3.3B KO/H3.3A knock-down (Kd) mouse embryonic fibroblasts (MEFs). RNA values are
normalized to ribosomal protein S9 (Rps9) mRNA and are relative to the H3.3B-KO value set at 1.0 ± SEM; 2-tailed t tests gave P < 0.05 for Sehl1, P < 0.01 for Gadd45a, Pdgfb, Gas2, and Smad 6, and P < 0.001 for Edn1; n = 4. B. H3.3B enrichment at TSS of differentially transcribed genes by ChIP-quantitative PCR assay (ChIP–qPCR). Values are expressed in percent of enrichment relative to input ± SEM. Chromatin from wild-type (WT) MEFs containing no HA-tag were used as a negative immunoprecipitation control. The TSS of examined genes were significantly enriched in H3.3B compared with the negative control; 1-tailed t tests (n = 4) gave P < 0.01 for Pdgfb and Smad6, P < 0.001 for Edn1 and Seh1l, and P < 0.0001 for Gadd45a and Gas2. C. H2A.Z enrichment at TSS of differentially transcribed genes. ChIP–qPCR assay. Values are the enrichment relative to input ± SEM. Rabbit IgG was used as the control. The TSS of examined genes were significantly enriched in H2A.Z compared with the negative control; 1-tailed t tests gave P < 0.05; n = 3. ChIP–qPCR graphs are representative of 3 separate experiments. H2A.Z enrichment at the studied TSS did not vary significantly between samples (1-way ANOVA gave P > 0.05; n = 3).
496 Biochem. Cell Biol. Vol. 95, 2017
Published by NRC Research Press
Biochem. Cell Biol. Downloaded from www.nrcresearchpress.com by 130.79.79.217 on 09/29/17
B
A
Relative gene expressionC
H2A.Z ChIPPdgfb H3.3B KO H3.3A KdH3.3B KO Relative mRNA 3 0 1.5 ** Edn1 H3.3B KO H3.3A KdH3.3B KO Relative mRNA 0 2.5 5 *** Gas2 H3.3B KO H3.3A KdH3.3B KO Relative mRNA 0 0.5 1 ** Seh1l H3.3B KO H3.3A KdH3.3B KO Relative mRNA 0.5 0 1 * Smad6 H3.3B KO H3.3A KdH3.3B KO Relative mRNA 0 0.5 1 ** FH-H3.3B ChIP (α-HA) Gadd45a TSS WT FH-H3.3B Chromatin IP % of Input 3 1.5 0 **** Gadd45a Relative mRNA H3.3B KO H3.3A KdH3.3B KO 0 4 8 ** Edn1 TSS Chromatin IP % of Input WT FH-H3.3B *** 3.5 7 0 Gas2 TSS Chromatin IP % of Input WT FH-H3.3B **** 5 2.5 0 Seh1l TSS Chromatin IP % of Input *** 4 2 0 WT FH-H3.3B Smad6 TSS Chromatin IP % of Input WT FH-H3.3B ** 6 3 0 Chromatin IP % of Input
Gadd45a TSS IgG H2A.Z
Chromatin IP % of Input
Edn1 TSS IgG H2A.Z
Gas2 TSS IgG H2A.Z
Seh1l TSS Chromatin IP % of Input IgG H2A.Z Smad6 TSS Chromatin IP % of Input IgG H2A.Z WT H3.3B-KO H3.3B-KO H3.3A-Kd 1.2 0 0.6 Chromatin IP % of Input IgG H2A.Z 0 1.5 3 WT H3.3B-KO H3.3B-KO H3.3A-Kd Pdgfb TSS Chromatin IP % of Input 3 1.5 0 WT FH-H3.3B ** Pdgfb TSS 0 3 1.5 WT H3.3B-KO H3.3B-KO H3.3A-Kd 1 Chromatin IP % of Input 0 0.5 0 1 2 0 1.5 3 WT H3.3B-KO H3.3B-KO H3.3A-Kd WT H3.3B-KO H3.3B-KO H3.3A-Kd WT H3.3B-KO H3.3B-KO H3.3A-Kd
Biochem. Cell Biol. Downloaded from www.nrcresearchpress.com by 130.79.79.217 on 09/29/17
In conclusion, we depleted H3.3 expression in mouse embry-onic fibroblasts combining genetic and shRNA strategies. This near-complete depletion of H3.3 from mammalian fibroblasts af-fected transcription at a handful of genes, while global transcrip-tion rates were altered only about 2-fold, with no effect seen at all on expression of retroviral repeat elements. Instead, we showed that H3.3 plays an important role in faithful completion of the cellular mitotic program and maintaining genomic integrity.
Acknowledgements
This work was supported by institutional funds from the Uni-versité de Strasbourg (UDS), the UniUni-versité de Grenoble Alpes (UGA), the Centre National de la Recherche Scientifique (CNRS), the Institut National de la Santé et de la Recherche Médicale (INSERM; Plan Cancer), and by grants from: the ATIP AVENIR pro-gram (K.P.), the Institut National du Cancer (INCA; INCa_4496, INCa_4454, and INCa PLBIO15-245), the Fondation pour la Recher-che Médicale (FRM; DEP20131128521), and the Université de Stras-bourg Institut d’Etudes Avancées (USIAS-2015-42), the Association pour la Recherche sur le Cancer, and La Ligue Nationale contre le Cancer (Équipe labellisée) to A.H. A.O. was awarded the European Molecular Biology Organization (EMBO) short-term fellowship, Scientific and Technological Research Council of Turkey (TUBITAK) 2214/A doctoral research grant, and French Ministry of Foreign Af-fairs scholarship. Sequencing was performed by the IGBMC Microar-ray and Sequencing platform, a member of the France Génomique consortium (ANR-10-INBS-0009).
References
Anders, S., Huber, W., Nagalakshmi, U., Wang, Z., Waern, K., Shou, C., et al. 2010. Differential expression analysis for sequence count data. Genome Biol. 11(10): R106. doi:10.1186/gb-2010-11-10-r106. PMID:20979621.
Anders, S., Pyl, P.T., and Huber, W. 2015. HTSeq-A Python framework to work with high-throughput sequencing data. Bioinformatics, 31(2): 166–169. doi: 10.1093/bioinformatics/btu638. PMID:25260700.
Banaszynski, L.A., Wen, D., Dewell, S., Whitcomb, S.J., Lin, M., Diaz, N., et al. 2013. Hira-dependent histone H3.3 deposition facilitates PRC2 recruitment at developmental loci in ES cells. Cell, 5: 107–120. doi:10.1016/j.cell.2013.08.061. PMID:24074864.
Bargaje, R., Alam, M.P., Patowary, A., Sarkar, M., Ali, T., Gupta, S., et al. 2012. Proximity of H2A.Z containing nucleosome to the transcription start site influences gene expression levels in the mammalian liver and brain. Nucleic Acids Res. 40(18): 8965–8978. doi:10.1093/nar/gks665. PMID:22821566. Boulard, M., Bouvet, P., Kundu, T.K., and Dimitrov, S. 2007. Histone variant
nucleosomes: . Subcell. Biochem. 41: 71–89. doi:10.1007/1-4020-5466-1_4. PMID: 17484124.
Bush, K.M., Yuen, B.T., Barrilleaux, B.L., Riggs, J.W., O’Geen, H., Cotterman, R.F., and Knoepfler, P.S. 2013. Endogenous mammalian histone H3.3 exhibits chromatin-related functions during development. Epigenetics Chromatin, 6(1): 7. doi:10.1186/1756-8935-6-7. PMID:23570311.
Drané, P., Ouararhni, K., Depaux, A., Shuaib, M., and Hamiche, A. 2010. The death-associated protein DAXX is a novel histone chaperone involved in the replication-independent deposition of H3.3. Genes Dev. 24(12): 1253–1265. doi:10.1101/gad.566910. PMID:20504901.
Elsässer, S.J., Noh, K.-M., Diaz, N., Allis, C.D., and Banaszynski, L.A. 2015. Histone H3.3 is required for endogenous retroviral element silencing in embryonic stem cells. Nature, 522(7555): 240–244. doi:10.1038/nature14345. PMID:25938714. Goldberg, A.D., Banaszynski, L.A., Noh, K.M., Lewis, P.W., Elsaesser, S.J.,
Stadler, S., et al. 2010. Distinct factors control histone variant H3.3 localiza-tion at specific genomic regions. Cell, 140(5): 678–691. doi:10.1016/j.cell.2010. 01.003. PMID:20211137.
Hake, S.B., Garcia, B.A., Kauer, M., Baker, S.P., Shabanowitz, J., Hunt, D.F., and Allis, C.D. 2005. Serine 31 phosphorylation of histone variant H3.3 is specific
Fig. 4. Mitotic defects in H3.3-deficient mouse embryonic fibroblasts (MEFs). A. Representative images of control nuclei. B. Representative image of nuclear abnormalities with micronuclei and polylobed nuclei, mitotic abnormalities with chromatin bridges, and misaligned and lagging chromosomes observed in H3.3-deficient MEFs. Defects are indicated by yellow arrows. C. Nuclear abnormalities in control FH-H3.3B and H3.3-deficient MEFs. One-way ANOVA gave P < 0.05 for FH-H3.3B compared with H3.3B knock-out (KO) and P < 0.001 for FH-H3.3B compared with H3.3B-KO/H3.3A knock-down (Kd) MEFs; n = 4. D. Mitotic abnormalities in control FH-H3.3B and H3.3-deficient MEFs; 125 mitotic events were scored for each line and experiment. Error bars represent the standard deviation between experiments on the total number of abnormalities. One-way ANOVA gave P < 0.01 for FH-H3.3B compared with H3.3B-KO, and P < 0.0001 for FH-H3.3B compared with Kd MEFs; n = 3. E. Flow cytometric analysis of cell cycles for wild-type (Wt), FH-H3.3B, H3.3B-KO, and double H3.3B-KO/H3.3A-Kd cells treated with propidium iodide. Approximately 100 000 cells per condition were analyzed per experiment. Error bars represent the standard deviation between experiments (1-way ANOVA gave P < 0.01 for Wt compared with H3.3B-KO/H3.3A-Kd; n = 3). [Colour online]
Misaligned Lagging Bridge
FH-H3.3B
FH-H3.3B H3.3B KO H3.3AH3.3B KO Kd FH-H3.3B H3.3B KO Nuclear Defects (%) Mitotic Defects (%)H3.3A Kd / H3.3B KO
20 10 0 20 10 0Interphase Metaphase Anaphase Micronuclei Polylobed
nuclei Misaligned chromosome Lagging chromosome Chromatin bridge
A
B
C
D
E
H3.3B KO H3.3A Kd FH-H3.3B Wt H3.3B KO % of cells in population H3.3B KO H3.3A Kd 0 50 100 G0/G1 S G2/M ** *** ** ** **** * ***498 Biochem. Cell Biol. Vol. 95, 2017
Published by NRC Research Press
Biochem. Cell Biol. Downloaded from www.nrcresearchpress.com by 130.79.79.217 on 09/29/17
to regions bordering centromeres in metaphase chromosomes. Proc. Natl. Acad. Sci. U.S.A. 102(18): 6344–6349. doi:10.1073/pnas.0502413102. PMID:15851689. Henikoff, S. 2008. Nucleosome destabilization in the epigenetic regulation of
gene expression. Nat. Rev. Genet. 9(1): 15–26. doi:10.1038/nrg2206. PMID: 18059368.
Henikoff, S., Furuyama, T., and Ahmad, K. 2004. Histone variants, nucleosome assembly and epigenetic inheritance. Trends Genet. 20(7): 320–326. doi:10. 1016/j.tig.2004.05.004. PMID:15219397.
Hochberg, Y., and Benjamin, Y. 1990. More powerful procedures for multiple significance testing. Stat. Med. 9(7): 811–818. doi:10.1002/sim.4780090710. PMID:2218183.
Jang, C.-W., Shibata, Y., Starmer, J., Yee, D., and Magnuson, T. 2015. Histone H3. 3 maintains genome integrity during mammalian development. Genes Dev. 1: 1377–1392. doi:10.1101/gad.264150.115. PMID:26159997.
Jin, C., and Felsenfeld, G. 2007. Nucleosome stability mediated by histone variants H3.3 and H2A.Z. Genes Dev. 21(12): 1519–1529. doi:10.1101/gad.1547707. PMID: 17575053.
Jin, C., Zang, C., Wei, G., Cui, K., Peng, W., Zhao, K., and Felsenfeld, G. 2009. H3.3/H2A.Z double variant-containing nucleosomes mark “nucleosome-free regions” of active promoters and other regulatory regions. Nat. Genet. 41(8): 941–945. doi:10.1038/ng.409. PMID:19633671.
Jurka, J., Kapitonov, V.V., Pavlicek, A., Klonowski, P., Kohany, O., and Walichiewicz, J. 2005. Repbase Update, a database of eukaryotic repetitive elements. Cytogenet. Genome Res. 110(1–4): 462–467. doi:10.1159/000084979. PMID:16093699.
Kraushaar, D.C., Jin, W., Maunakea, A., Abraham, B., Ha, M., and Zhao, K. 2013. Genome-wide incorporation dynamics reveal distinct categories of turnover for the histone variant H3.3. Genome Biol. 14(10): R121. doi: 10.1186/gb-2013-14-10-r121. PMID:24176123.
Krimer, D.B., Cheng, G., and Skoultchi, A.I. 1993. Induction of H3.3 replacement histone mRNAs during the precommitment period of murine erythroleuke-mia cell differentiation. Nucleic Acids Res. 21(12): 2873–2879. doi:10.1093/nar/ 21.12.2873. PMID:8332496.
Langmead, B., Trapnell, C., Pop, M., and Salzberg, S. 2009. Ultrafast and
memory-efficient alignment of short DNA sequences to the human genome. Genome Biol. 10(3): R25. doi:10.1186/gb-2009-10-3-r25. PMID:19261174.
Li, H., and Durbin, R. 2009. Fast and accurate short read alignment with Burrows-Wheeler transform. Bioinformatics, 25(14): 1754–1760. doi:10.1093/ bioinformatics/btp324. PMID:19451168.
Obri, A., Ouararhni, K., Papin, C., Diebold, M.-L., Padmanabhan, K., Marek, M., et al. 2014. ANP32E is a histone chaperone that removes H2A.Z from chroma-tin. Nature, 505(7485): 648–653. doi:10.1038/nature12922. PMID:24463511. Pusarla, R.-H., and Bhargava, P. 2005. Histones in functional diversification:
Core histone variants. FEBS J. 272(20): 5149–5168. doi:10.1111/j.1742-4658.2005. 04930.x. PMID:16218948.
Ricketts, M.D., Frederick, B., Hoff, H., Tang, Y., Schultz, D.C., Singh, Rai, T., et al. 2015. Ubinuclein-1 confers histone H3.3-specific-binding by the HIRA histone chaperone complex. Nat. Commun. 6: 7711. doi:10.1038/ncomms8711. PMID: 26159857.
Schindelin, J., Arganda-Carreras, I., Frise, E., Kaynig, V., Longair, M., Pietzsch, T., et al. 2012. Fiji: an open-source platform for biological-image analysis. Nat. Methods, 9(7): 676–682. doi:10.1038/nmeth.2019. PMID:22743772.
Schindelin, J., Rueden, C.T., Hiner, M.C., and Eliceiri, K.W. 2015. The ImageJ ecosystem: An open platform for biomedical image analysis. Mol. Reprod. Dev. 82(7–8): 518–529. doi:10.1002/mrd.22489. PMID:26153368.
Szenker, E., Ray-Gallet, D., and Almouzni, G. 2011. The double face of the histone variant H3.3. Cell Res. 21(3): 421–434. doi:10.1038/cr.2011.14. PMID:21263457. Trapnell, C., Pachter, L., and Salzberg, S.L. 2009. TopHat: discovering splice junc-tions with RNA-Seq. Bioinformatics, 25(9): 1105–1111. doi:10.1093/bioinformatics/ btp120. PMID:19289445.
Wong, L.H., Mcghie, J.D., Sim, M., Anderson, M.A., Ahn, S., Hannan, R.D., et al. 2010. ATRX interacts with H3. 3 in maintaining telomere structural integrity in pluripotent embryonic stem cells. Genome Res. 20(3): 351–360. doi:10.1101/ gr.101477.109.20. PMID:20110566.
Xu, J. 2005. Preparation, culture, and immortalization of mouse embryonic fibro-blasts. Curr. Protoc. Mol. Biol. Chapter 28: Unit 28.1. doi:10.1002/0471142727. mb2801s70. PMID:18265366.
Published by NRC Research Press