http://journals.tubitak.gov.tr/biology/ © TÜBİTAK
doi:10.3906/biy-1701-26
Exploration of the binding pocket of histone deacetylases: the design of potent and
isoform-selective inhibitors
Abdullahi İbrahim UBA1,2, Kemal YELEKÇİ1,*
1Department of Bioinformatics and Genetics, Faculty of Engineering and Natural Sciences, Kadir Has University, İstanbul, Turkey 2Center for Biotechnology Research, Bayero University Kano, Nigeria
1. Introduction
The human genome is packaged into chromatin inside the nucleus of the cell. The basic structural unit of chromatin is nucleosome, containing approximately 146 base pairs of DNA wrapped around a histone octamer: two copies each of histones H2A, H2B, H3, and H4. The lysine and arginine residues of histone protein are subject to an array of posttranslational modifications including acetylation, methylation, phosphorylation, and ubiquitination. The N-terminal region of the histones (“the histone tails”) plays a major role in transcriptional regulation upon acetylation and deacetylation of various lysine residues within these regions. The acetylation state of histones is reversibly regulated by two classes of enzymes, histone acetyltransferases (HATs) and histone deacetylases (HDACs) (Roth et al., 2001; Richmond and Davey, 2003; Khorasanizadeh, 2004; Kouzarides, 2007). There are 18 genes encoding HDAC family members in the human genome. These are grouped into four classes based on their homology to yeast. Classes I, II, and IV are Zn2+-dependent, whereas Class III contains NAD+
(nicotinamide adenine dinucleotide)-dependent enzymes.
Class I consists of HDACs 1, 2, 3, and 8 isoforms. They share sequence homology with yeast reduced potassium dependency-3 (RPD3) and are localized in the nucleus of the cells (Gregoretti et al., 2004; Yang et al., 2005; Li et al., 2007; Bannister and Kouzarides, 2011; Zentner and Henikoff, 2013). Class II HDACs share sequence homology with the yeast histone deacetylases 1 (Hda1) and are further divided into Class IIa (HDACs 4, 5, 7, and 9) and Class IIb (HDACs 6 and 10). Class II HDACs are primarily localized in the cytoplasm, but can be shuttled between the cytoplasm and nucleus depending on the phosphorylation status. Class IV consists of only HDAC11, localized in the nucleus. Class III comprises seven members, SIRT1 through SIRT7, sharing sequence homology with yeast silent information regulator-2 (Sir2) protein (Fischle et al., 2001; Verdin et al., 2003; Yang and Grégoire, 2005).
HDACs are promising therapeutic targets in anticancer drug design and development due to their roles in the pathogenesis of various cancers. Aberrant expressions of HDACs in diverse cancer cell lines and tumor tissues have been reported (Bolden et al., 2006). HDAC1 was
Abstract: Histone deacetylases (HDACs) are enzymes that act on histone proteins to remove the acetyl group and thereby regulate the
chromatin state. HDACs act not only on histone protein but also nonhistone proteins that are key players in cellular processes such as the cell cycle, signal transduction, apoptosis, and more. “Classical” HDACs have been shown to be promising targets for anticancer drug design and development. However, the selectivity of HDAC inhibitors for HDAC isoforms remains the motivation of current research in this field. Here, we explored Class I HDACs and HDAC6 by sequence alignment and structural superimposition, catalytic channel extraction, and identification of critical residues involved in HDAC catalysis. Based on the general pharmacophore features of known HDAC inhibitors, we developed a library of compounds by scaffold hopping on a fragment hit identified via structure-based virtual screening of the molecular fragment library retrieved from the Otava database. Molecular docking assay revealed five of these compounds to have increased potency and selectivity for HDACs 1 and 2. Furthermore, their predicted absorption, distribution, metabolism, elimination, and toxicity (ADMET) properties were consistent with those of drug-like compounds. With further modeling-based and experimental investigations, we believe that these findings may offer additional potential HDAC inhibitors with improved selectivity.
Key words: Scaffold hopping, molecular docking, ADMET analysis, potent and isoform-selective HDAC inhibitors, anticancer agents Received: 09.01.2017 Accepted/Published Online: 16.09.2017 Final Version: 18.12.2017
overexpressed in prostate (Halkidou et al., 2004) and breast cancers (Zhang et al., 2005), hepatocellular carcinoma via systemic regulation of mitotic effectors (Xie et al., 2012), and impaired spermatogenesis and testicular cancer (Cacan et al., 2014). Despite functional redundancy between HDACs 1 and 2, HDAC2 was shown to be independently implicated in various types of human cancers. The upregulation of tumor-promoting genes, such as those of tyrosine kinases, mediators of cell cycle progression and angiogenic factors, by HDAC2 mutant cells in human cancer has been reported (Ropero et al., 2008). HDAC2 inhibition in pancreatic cancer cell lines induced apoptosis by sensitization of the tumor necrosis factor-related apoptosis-inducing ligand (TRAIL) (Schüler et al., 2010). HDAC3 and other class I HDACs are highly expressed in colon cancer (Wilson et al., 2006; Godman et al., 2008; Spurling et al., 2008; Rajendran et al., 2011). HDAC6 was found to be expressed more in low-grade and high-low-grade ovarian carcinomas (Bazzaro et al., 2008) and oral squamous cell carcinoma (Sakuma et al., 2006). Both HDAC6 and HDAC8 were found to be highly expressed and implicated in the invasion and progression of breast cancer cells (Park et al., 2011). HDAC8 has been implicated in neuroblastoma, T-cell lymphoma, and acute myeloid leukemia (Oehme et al., 2009). Global loss of monoacetylation at lysine number 16 of histone H4 is the common hallmark of human cancer cells (Fraga et al., 2005).
Thus, a number of HDAC inhibitors are in clinical trials after the FDA’s approval of vorinostat, a pan-HDAC inhibitor for the treatment of cutaneous T-cell lymphoma, in 2006; romidepsin, also for peripheral T-cell lymphoma in 2011; belinostat, for the treatment of patients with relapsed or refractory peripheral T-cell lymphoma, in 2014 (Bolden et al., 2006); and, recently, panobinostat, for the treatment of multiple myeloma, in 2015. Mocetinostat is another HDAC inhibitor with remarkable potency against HDAC1 compared with HDACs 2, 3, and 11, currently in clinical trial for the treatment of leukemia or myelodysplastic syndromes (Garcia-Manero et al., 2008). Entinostat and tacedinaline show high selectivity for
Class I HDACs 1–3 and moderate selectivity for HDAC8 and are in clinical trials for the treatment of advanced solid tumors (Prakash et al., 2001; Pili et al., 2011). Other selective HDAC inhibitors are in different stages of trials for the treatment of various solid and nonsolid cancers. For example, MRLB-223 is in preclinical trial as a selective inhibitor of HDACs 1 and 2 (Newbold et al., 2013). BG45 is also in preclinical trial as a selective inhibitor of HDAC3 (McConkey et al., 2012). Tubacin and rocilinostat (ACY-1215) are in preclinical and phase IIa trials, respectively, as HDAC6 selective inhibitors (Haggarty et al., 2003; Cosenza et al., 2014). PCI-34051 is in preclinical trial as a selective inhibitor of HDAC8.
HDAC inhibitors are potent inducers of cell cycle arrest in transformed cells and their subsequent death via apoptotic, autophagic, and reactive oxygen species (ROS)-mediated pathways. They are also found to decrease cell migration and angiogenesis by targeting nonhistone proteins including transcription factors (p53, E2F c-Myc, NF-κB), retinoblastoma protein (pRb), estrogen receptor alpha (ER α), androgen receptor (AR), hypoxia-inducible factor 1 alpha (HIF-1α), signaling mediators (Stat3, Smad7), MyoD, chaperons (HSP90), α-tubulin, β-catenin, DNA repair proteins (Ku70) and many more (Singh et al., 2010; Kim and Bae, 2011; Peng and Seto, 2011).
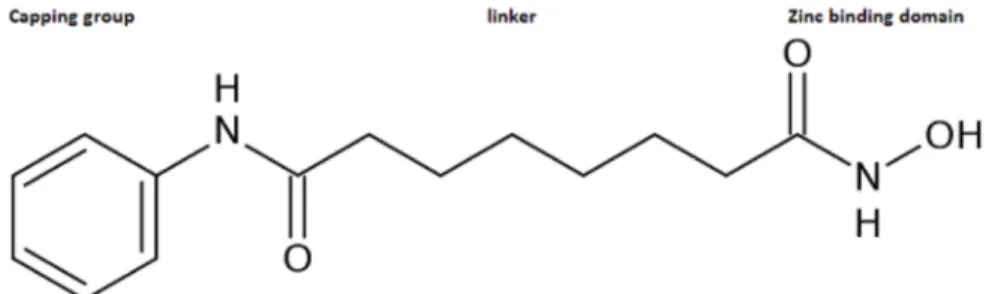
Generally, HDAC inhibitors have their pharmacophore containing three features: a capping group for surface recognition, a hydrocarbon linker, and a zinc binding domain, as shown in Figure 1 (Mottamal et al., 2015). In an attempt to discover more potent and selective inhibitors, researchers vary one or all of these features to achieve desired potency and selectivity. A computer-aided scaffold replacement method can be used, wherein a portion of the molecule could be replaced, or a group might be added to achieve a particular polar or steric interaction that might enhance the binding affinity (Langdon et al., 2010). In addition, novel inhibitors can be predicted in silico by probing a database of a large chemical library. For instance, both structure-based and ligand-based virtual screenings have been applied for identification of selective HDAC inhibitors (Liu et al., 2010; Park et al., 2010; Wang et al.,
Figure 1. Structure of vorinostat (SAHA) showing the general pharmacophore features of
2013) with the most recent study by Huang et al. (2016), in which virtual screening and experimental validation of HDAC8 inhibitors was performed. Other modeling approaches including pharmacophore modeling (Chen et al., 2008), flexible docking, and three-dimensional QSAR (3D-QSAR) (Nair et al., 2012) have been used for the identification of selective HDAC inhibitors. Here, we attempted to design potent and isoform-selective HDAC inhibitors by a combined approach of structure-based virtual screening, scaffold hopping, ADMET prediction, and molecular docking. We believe that subtle differences in the HDAC active site amino acids could be exploited to achieve isoform selectivity.
2. Materials and methods 2.1. Protein setup
The following crystal structures of human histone deacetylases were retrieved from the Protein Data Bank (PDB): 4BKX (“The structure of HDAC1 in complex with
the dimeric ELM2-SANT domain of MTA1 from the NuRD complex”) (Millard et al., 2013); 4LXZ (“Structure of human HDAC2 in complex with SAHA”) (Lauffer et al., 2013); 4A69 (“Structure of HDAC3 bound to corepressor and inositol tetraphosphate”) (Watson et al., 2012); 5EDU (“Crystal structure of human histone deacetylase 6 catalytic domain 2 in complex with trichostatin A); and 1T64 (“HDAC8 in complex with the inhibitor TSA”) (Somoza et al., 2004). All water molecules and cocrystallized ligands were removed from enzyme structures. The noninteracting ions were also removed, leaving Zn2+, as it is critical for the
catalytic activity of the enzymes. Missing hydrogen atoms were added on the basis of the protonation state of the titratable residues at a pH of 7.4 using the Biovia Discovery Studio 4.0 molecular modeling program.
2.2. Sequence alignment and structural superimposition
From the PDB crystal structure, amino acid sequences of Class I HDACs and HDAC6 were aligned using Biovia Discovery Studio 4.0 (Figures 2A and 2B) and
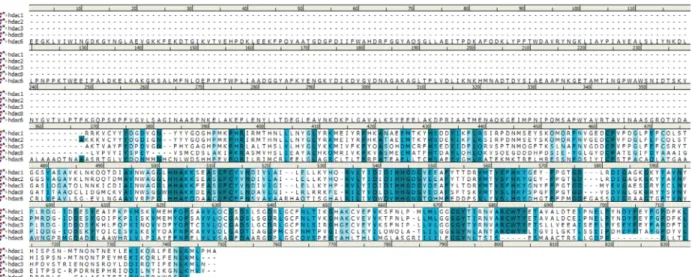
Figure 2A. Multiple sequence alignment of Class I HDACs and HDAC6. The degree of sequence conservation is indicated in
the intensity of blue coloration. Identity is indicated in dark blue, similarity in moderate and light blue, and difference in white. The amino acids in the catalytic channels of these isoforms are similar even though the overall sequence identity was 7.2% and sequence similarity 15.6%. HDAC6 has additional structural motif aligned to the gap.
Figure 2B. Multiple sequence alignment of class I HDACs. The degree of sequence conservation is indicated in the intensity of blue
coloration. Identity is indicated in dark blue, similarity in moderate and light blue, and difference in white. The amino acids in the catalytic channels of Class I isoforms are similar; the overall sequence identity is 33.1% and sequence similarity is 57.8%. HDAC8 shows slight sequence variation compared with the rest of the class members.
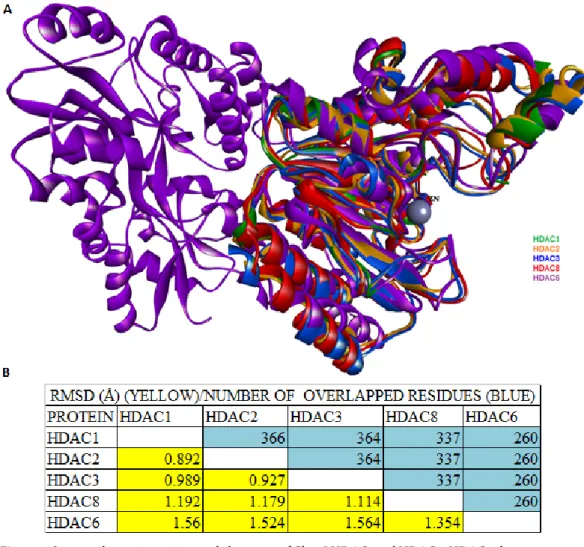
their corresponding 3D structures were superimposed (Figure 3A). Calculated from the structural alignment, root mean square displacement (RMSD) values and number of overlapped residues (NRES) with one another are compared in Figure 3B. In addition, the conserved amino acid residues that are involved in HDAC catalysis were also aligned (Table 1). Moreover, to gain insight into the evolutionary relationship among these isoforms, phylogenetic trees were constructed from multiple sequence alignment using Basic Local Alignment Search Tool (BLAST), available via the National Center for Biotechnology Information (NCBI) database (Figure 4).
2.3. Structure-based virtual screening and ligand setup
Virtual screening is a process of screening a large library of compounds to identify pharmacologically active compounds. It is automated to quickly evaluate a series of compounds based on their biological activity
against a target protein. It is usually used to identify an initial compound (hit) for further optimization. In this study, structure based-virtual screening of the molecular fragment library retrieved from the Otava database was conducted using the AutoDock Vina (PyRx) program. The highest scoring fragment (Otava id: 5683342) showed desirable activity against HDAC3. The library was screened against HDAC3 because, according to our phylogenetic analysis of the HDAC isoforms under study, HDAC3 shares sequence similarity with Class I HDACs and, to a relatively low extent, with HDAC6. Based on the general pharmacophore features of HDAC inhibitors, structural modifications were made by scaffold hopping in which various synthetically feasible groups were added and the core structure replaced to achieve particular polar, hydrophobic, or steric interactions around the entrance and deep catalytic channels (Figure 5). These interactions
Figure 3. Structural superimposition and alignment of Class I HDACs and HDAC6. HDAC6 shares a conserved
catalytic domain with Class I HDACs; HDAC6 has an additional structural motif aligned to the gap (purple) (A). RMSD and the number of overlapped residues (NRES) with respect to one another are indicated in yellow and blue colors, respectively (B).
were targeted to enhance the binding affinity and selectivity considering the subtle difference in the amino acids at the highly conserved active sites of the HDAC isoforms. Their 3D geometries were optimized and saved in pdb format in the Biovia Discovery Studio program.
2.4. Drug-likeness and ADMET prediction
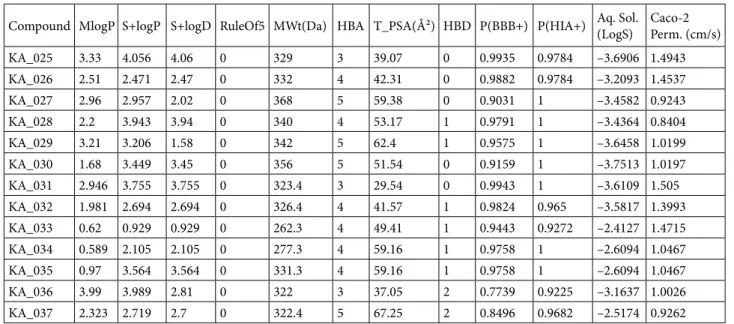
ADMET properties constitute the pharmacokinetic profile of a drug molecule and are very essential in evaluating its pharmacodynamic activities. For a compound to be drug-like it has to pass the ADMET test. Nowadays, these ADMET properties can be predicted in silico based on the structure of a compound. In this study, the ADMET properties were calculated using ADMET Predictor (Simulation Plus). These are: S+logP (octanol-water partition coefficient, log P); S+logD (octanol-water distribution coefficient, log D); MlogP (Moriguchi model of log P); RuleOf5 (“computational filter for oral absorption in human identical to Lipinski’s ‘Rule of Five’”) (Owens and Lipinski, 2003; Lipinski, 2004; Ridder et al., 2011); molecular weight (mw); number of hydrogen bond donors (HBD) and acceptors (HBA); and topological polar surface area (TPSA). Other ADMET properties, which include probability of crossing the blood– brain barrier P(BBB+), probability for human intestinal absorption P(HIA+), Caco-2 permeability, and aqueous solubility (Aq. Sol.), were predicted using the admetSAR server (Cheng et al., 2012) (Table 2).
Table 1. Superimposition of common residues among class I
HDACs and HDAC6 that are components of the charge-relay system of HDAC catalysis.
HDAC1 HDAC2 HDAC3 HDAC8 HDAC6 HIS140 HIS145 HIS134 HIS142 HIS573 HIS141 HIS146 HIS135 HIS143 HIS574 HIS178 HIS183 HIS172 HIS180 HIS614 ASP176 ASP181 ASP170 ASP178 ASP610 PHE205 PHE210 PHE200 PHE208 ASP612 ASP264 ASP266 ASP259 ASP267 ASP706 TYR303 TYR308 TYR298 TYR306 TYR745
Histone deacetylase 8 [Homo sapiens]
Histone deacetylase 3 [Homo sapiens] Histone deacetylase 2 [Homo sapiens] Histone deacetylase 1 [Homo sapiens] Histone deacetylase 4 [Homo sapiens] Histone deacetylase 9 [Homo sapiens] Histone deacetylase 5 [Homo sapiens] Histone deacetylase 7 [Homo sapiens]
Histone deacetylase 6 [Homo sapiens] Histone deacetylase 10 [Homo sapiens]
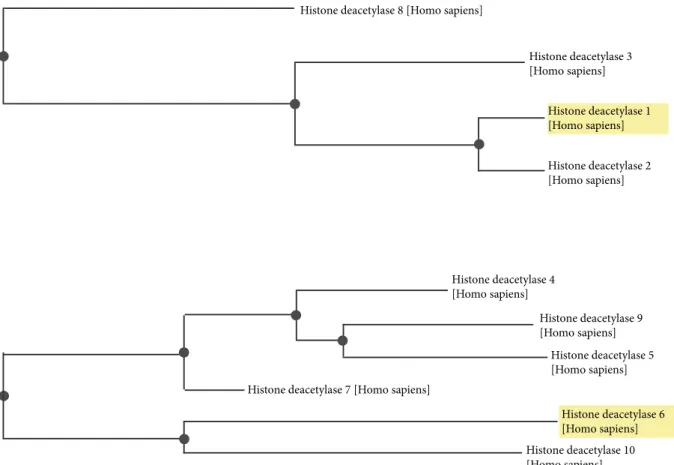
Figure 4. Phylogenetic tree constructed using NCBI BLAST for HDAC1 relatives. The tree shows that the closest relative of
HDAC1 is HDAC2; HDAC3 shares ancestral origin with HDACs 1 and 2, while HDAC8 is a distant relative of HDACs 1 and 2 with 2 nodes and shares an evolutionary relationship with HDAC3 at a distance of 1 node. The closest relative of HDAC6 is HDAC10; HDAC6 also shares ancestral origin with HDACs 4, 5, 7, and 9.
Fig ur e 5. Th e desig ne d co m po un ds KA_025 thr oug h KA_037 by sc aff old ho pp in g on a co mm on m ole cu la r f ra gm en t (o ta va id: 5683342) iden tif ie d vi a str uc tur e-b as ed vir tu al scr eenin g.
2.5. Molecular docking assay
The AutoDockTool (ADT) program (version 1.5.6rc3) was used to generate the molecular docking input files. Gasteiger partial charges were assigned to each atom to generate a grid parameter file (gpf) and a docking parameter file (dpf). The program uses an Amber-based semiempirical force field with a molecular mechanics model for enthalpic contributions (van der Waals and hydrogen bonding) and an empirical force field model for changes in entropy on binding (Weiner et al., 1984; MacKerell and Banavali, 2000; de Magalhães et al., 2004).
For validation purposes, and to assess the quality of the prepared protein structures, a series of known HDAC inhibitors were docked into the catalytic channels of the HDAC enzymes under study. These established inhibitors include the approved drugs (vorinostat and belinostat, romidepsin) and those in clinical trials (mocetinostat, entinostat, tacedinaline). Their estimated free energy of binding and the inhibition constant were consistent with the experimental values reported in the literature, except for HDAC8, against which the binding affinities of entinostat and tacedinaline were not well reproduced in this study. Energy grid boxes with dimensions of 55, 55, and 55 Å for HDACs 1, 2, and 8 and 65, 65, and 65 Å for HDACs 3 and 6 were centered near Zn2+ and covered the entire binding
site and its neighboring residues. A Lamarckian genetic algorithm was used to search for ligand conformation in the catalytic channel of the enzymes. For each ligand, 20 independent runs were performed and the distinct ligand conformers generated were docked randomly into the binding pocket of these HDAC enzymes. The program
randomly assigned torsion angles to rotatable bonds. For each docking, 15 million energy evaluations were allowed.
3. Results
3.1. Sequence and structural analysis
The whole sequence alignment revealed that amino acid residues in the catalytic channels of Class I HDACs and HDAC6 were similar even though the overall sequence identity is 7.2% and sequence similarity 15.6%. The low percentage of sequence identity and similarity resulted from a structural element present in HDAC6 in addition to the conserved catalytic domain it shares with Class I HDACs. Class I HDACs share 33.1% sequence identity and 57.8% sequence similarity. The HDACs’ active site is conserved, especially among Class I HDACs 1–3, with sequence identity and similarity of 60.5% and 81.7%, respectively. HDACs 1 and 2 share the highest sequence identity of 93.5% and similarity 97.8% .
3.2. Binding affinity
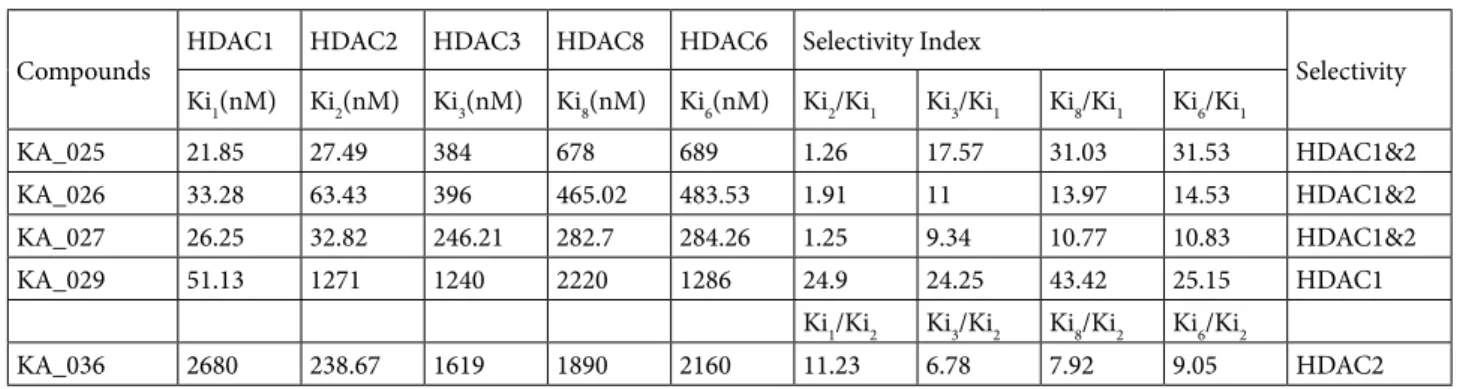
The potency and selectivity of our designed compounds, denoted KA_025 through KA_037, are compared with those of known HDAC inhibitors in Table 3 and the selectivity index of the selective compounds among them is given in Table 4. KA_025, KA_026, and KA_027 were found to have the highest binding affinity among the designed inhibitors and showed selectivity for HDACs 1 and 2. KA_029 was selective for HDAC1 only and KA_036 showed modest selectivity for HDAC2 only. KA_028, KA_030 through KA_035, and KA_037 showed selectively for neither a specific isoform nor a particular group of HDACs. KA_025, KA_026, and KA_027 were as selective
Table 2. Predicted drug-like and ADMET properties using ADMET Predictor program and AdmetSAR server.
Compound MlogP S+logP S+logD RuleOf5 MWt(Da) HBA T_PSA(Ų) HBD P(BBB+) P(HIA+) Aq. Sol. (LogS) Caco-2 Perm. (cm/s) KA_025 3.33 4.056 4.06 0 329 3 39.07 0 0.9935 0.9784 –3.6906 1.4943 KA_026 2.51 2.471 2.47 0 332 4 42.31 0 0.9882 0.9784 –3.2093 1.4537 KA_027 2.96 2.957 2.02 0 368 5 59.38 0 0.9031 1 –3.4582 0.9243 KA_028 2.2 3.943 3.94 0 340 4 53.17 1 0.9791 1 –3.4364 0.8404 KA_029 3.21 3.206 1.58 0 342 5 62.4 1 0.9575 1 –3.6458 1.0199 KA_030 1.68 3.449 3.45 0 356 5 51.54 0 0.9159 1 –3.7513 1.0197 KA_031 2.946 3.755 3.755 0 323.4 3 29.54 0 0.9943 1 –3.6109 1.505 KA_032 1.981 2.694 2.694 0 326.4 4 41.57 1 0.9824 0.965 –3.5817 1.3993 KA_033 0.62 0.929 0.929 0 262.3 4 49.41 1 0.9443 0.9272 –2.4127 1.4715 KA_034 0.589 2.105 2.105 0 277.3 4 59.16 1 0.9758 1 –2.6094 1.0467 KA_035 0.97 3.564 3.564 0 331.3 4 59.16 1 0.9758 1 –2.6094 1.0467 KA_036 3.99 3.989 2.81 0 322 3 37.05 2 0.7739 0.9225 –3.1637 1.0026 KA_037 2.323 2.719 2.7 0 322.4 5 67.25 2 0.8496 0.9682 –2.5174 0.9262
for HDAC1 as they were for HDAC2 and are therefore termed HDAC1- and HDAC2-selective.
3.3. Binding mode analysis
KA_025, KA_026, and KA_027 spanned the catalytic channels of HDACs 1 and 2 in a similar manner. Although fewer interactions were observed with HDAC2, the predominant interactions (π-stacked, π-π T-shaped, π-alkyl, van der Waals, hydrogen bond) were common in
both isoforms’ complexes. Another selective compound, KA_029 has an additional interaction (metal-acceptor) between Zn2+ and oxygen of the sulfonyl group coupled
with -π sulfur interactions between the same parties. However, such interactions were not observed with HDAC2 despite catalytic channel similarity between these isoforms. This might be due to conformational differences that allowed for binding of this same compound in a
Table 4. Selectivity index of the potential selective inhibitors of HDACs 1 and 2 compared to HDACs 3, 6, and 8.
Compounds HDAC1 HDAC2 HDAC3 HDAC8 HDAC6 Selectivity Index Selectivity Ki1(nM) Ki2(nM) Ki3(nM) Ki8(nM) Ki6(nM) Ki2/Ki1 Ki3/Ki1 Ki8/Ki1 Ki6/Ki1
KA_025 21.85 27.49 384 678 689 1.26 17.57 31.03 31.53 HDAC1&2 KA_026 33.28 63.43 396 465.02 483.53 1.91 11 13.97 14.53 HDAC1&2 KA_027 26.25 32.82 246.21 282.7 284.26 1.25 9.34 10.77 10.83 HDAC1&2 KA_029 51.13 1271 1240 2220 1286 24.9 24.25 43.42 25.15 HDAC1
Ki1/Ki2 Ki3/Ki2 Ki8/Ki2 Ki6/Ki2
KA_036 2680 238.67 1619 1890 2160 11.23 6.78 7.92 9.05 HDAC2
Table 3. Estimated free energy of binding of KAs against Class I HDACs and HDAC6 compared with known HDAC
inhibitors. The compounds are color-coded: known HDAC inhibitors (blue); HDACs 1 and 2 selective (green); HDAC1-selective (yellow); HDAC2-HDAC1-selective (orange); and nonHDAC1-selective inhibitors (light purple).
HDAC1 HDAC2 HDAC3 HDAC8 HDAC6
Compound ΔG (kcal/mol) ΔG (kcal/mol) ΔG (kcal/mol) ΔG (kcal/mol) ΔG (kcal/mol)
Vorinostat –8.45 –8.64 –8.32 –8.42 –8.55 Belinostat –9.62 –8.89 –9.44 –8.68 –8.02 Romidepsin –8.22 –8.76 –8.44 –7.99 –7.34 Entinostat –9.82 –9.86 –10.62 –7.16 –7.65 Tacedinaline –8.62 –8.10 –9.08 –7.36 –7.82 Mocetinostat –9.89 –9.44 –9.76 –6.44 –7.32 KA_025 –10.45 –10.31 –8.99 –8.53 –8.46 KA_026 –10.20 –9.82 –8.88 –8.64 –8.62 KA_027 –10.34 –10.21 –9.01 –8.93 –8.93 KA_028 –9.72 –9.52 –8.87 –8.39 –7.94 KA_029 –9.95 –8.02 –8.1 –7.71 –8.00 KA_030 –9.18 –8.41 –8.29 –7.90 –7.94 KA_031 –9.41 –8.98 –9.09 –8.43 –8.6 KA_032 –9.05 –8.35 –8.82 –7.66 –8.29 KA_033 –8.23 –8.14 –8.15 –7.70 –7.72 KA_034 –8.60 –7.79 –8.01 –8.22 –7.56 KA_035 –8.12 –7.33 –7.60 –7.72 –7.22 KA_036 –7.60 –9.03 –7.9 –7.81 –7.73 KA_037 –7.92 –8.11 –8.13 –7.81 –8.08
different mode. Interestingly, KA_036 fit in the catalytic channels of HDACs 1 and 2 with different orientations despite repeated docking runs to ascertain the lowest energy conformations of the compound. Consequently, their set of interactions differed and so did binding affinity, being higher with HDAC2.
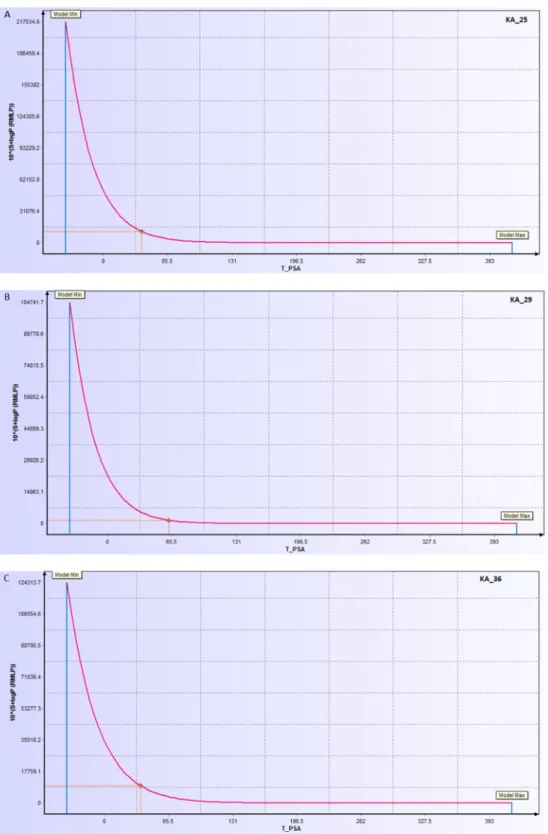
3.4. ADMET analysis
According to ADMET prediction, these compounds were drug-like, having passed “the rule of 5” and other pharmacokinetic tests. All the indices were found to be within the acceptable range for drug candidacy. An important measure of drug-likeness, TPSA is an index that shows the likelihood of transporting a molecule through cell membranes. It allows for the prediction of human intestinal absorption and blood–brain barrier penetration, among others. The descriptor sensitivity curves of S+logP in response to the TPSA of KA_025, KA_029, and KA_36 are shown is shown in Figure 6. The slope of the curve was correlated with the feasible value reflecting the hydrophilicity/hydrophobicity of the compounds. All of the compounds were predicted to have TPSA < 100, indicating their likelihood of crossing the lipid bilayer. Other ADMET properties estimated including aqueous solubility (LogSw) and Caco-2 (human epithelial colorectal adenocarcinoma) permeability were within the normal range of a drug-like molecule. Aqueous solubility of a drug molecule is a very important ADMET property influencing absorption and transport of a drug molecule in the body. The quantitative structure property relationship (QSPR) has been successfully applied to relate 150 drug and organic molecules to their respective aqueous solubility (Ghasemi and Saaidpour, 2007). Caco-2 permeability is another crucial property reflecting gastrointestinal permeability by measuring the rate of transport of a drug molecule across the Caco-2 cell line. It has been studied in vitro (van Breemen and Li, 2005; Volpe et al., 2007; Volpe, 2011) and in silico (Nordqvist et al., 2004; Ponce et al., 2005; Akamatsu et al., 2009; Paixão et al., 2010; Singh et al., 2015). The predicted Caco-2 permeability and aqueous solubility of our designed compounds were in agreement with the widely-followed “Jorgensen Rule-of-Three”, which states that “the aqueous solubility measured as logS should be greater than –5.7, the apparent Caco-2 cell permeability should be faster than 22 nm/s and the number of primary metabolites should be less than 7; these limits are based on the properties of 90% of 1700 oral drugs” (Di and Kerns, 2016).
4. Discussion
Our designed selective inhibitors, particularly KA_025, KA_026, and KA_027, showed improved potency and selectivity compared with all the known HDAC inhibitors used in this study. Compared with the approved
nonselective HDAC inhibitors, vorinostat, belinostat, and romidepsin, and well-studied HDAC inhibitors in clinical trials, entinostat, tacedinaline, and mocetinostat, both the potency and selectivity were improved in silico, with the exception of entinostat, which showed higher binding affinity for HDAC3 (∆G = –10.62 kcal/mol) (Table 3). Entinostat binds selectively to the Class I HDACs 1–3 and with a relatively moderate affinity to HDAC8, with significant antitumor efficacy, currently in clinical development for treatment of human colorectal cancer lines (Bracker et al., 2009). Similarly, tacedinaline is another selective inhibitor of Class I HDACs 1–3 with modest activity against HDAC8, shown to inhibit the growth of lung and breast cancers, lymphoblastic leukemia, and more (Mottamal et al., 2015). This moderate selectivity of both entinostat and tacedinaline for HDAC8 was not well reproduced in our study; therefore, the binding affinities of these inhibitors for HDAC8 presented in Table 3 should be considered with caution. Mocetinostat is 2- to 10-fold more selective for HDAC1 than HDACs 2, 3, and 11 (Boumber et al., 2011). These known selective inhibitors were used as reference compounds to guide the selection of our potent and selective inhibitors. The thresholds for potency and selectivity index were >9.00 kcal/mol and ≥7, respectively. The increased potency of KA_025, KA_026, and KA_027 may be in part attributed to the carbonyl oxygen presence in their linker group involved in hydrogen bond interactions, specifically with TYR for HDAC1 and HIS for HDAC2.
Generally, deacetylation of substrate occurs through a “charge-relay system” consisting of two adjacent histidine residues, two aspartic residues, and one tyrosine residue in the deep catalytic pocket of HDACs (Table 1). When a cation binds near the bottom of the pocket, it is coordinated by two additional aspartates and one histidine and also by a water molecule (Finnin et al., 1999). HDAC inhibitors function by chelating the Zn2+, making the charge-relay
system dysfunctional. In the complexes of HDAC1 with KA_025, KA_026, and KA_027, zinc was involved in metal-acceptor interaction via the carbonyl oxygen of the linker group; however, such interaction was not observed in the complexes of HDAC2 with these compounds, rather, van der Waals interaction was seen. Moreover, the two adjacent histidine residues (HIS140 and HIS141 for HDAC1 and HIS145 and HIS146 for HDAC2) and two aspartic acid residues (ASP176 and ASP264 for HDAC1) and one (ASP183 in HDAC2) were found to be involved in interactions with KA_025, KA_026, and KA_027. These findings were consistent with a study by Fournel et al. (2002), in which sulfonamide anilides were shown to have antiproliferative activity against human tumor without chelating zinc from the active site of HDACs. Here, although it is not clear what exactly brought about the selectivity of
KA_025, KA_026, and KA_027 for HDACs 1 and 2 given their similarity in structure with the other nonselective inhibitors, we speculate that their unique carbonyl group
near the cap might have changed the set of interactions in the deep active site of the enzymes, consequently leading to their selectivity for HDACs 1 and 2 (Figures 7–9).
Figure 6. Sensitivity curve of exponential of S+LogP versus topological surface area of compounds
Of all the selective inhibitors designed here, KA_029 interacted with HDAC1 in the typical way that HDAC inhibitors bind zinc-containing HDACs. Zinc was chelated by one sulfonyl oxygen via metal-acceptor interaction and the catalytically essential amino acid residues, HIS140, HIS141, HIS178, ASP176, ASP264, and TR303, also interacted mainly with the sulfonyl group (Figure 10). This result is partly in agreement with findings by Noor et al. (2015), in which zinc was shown to be chelated via sulfonyl oxygen of Class I selective inhibitor.
In the HDAC2-KA_036 complex, various noncovalent interactions including van der Waals, π-sulfur, π-alkyl, π-π stacked, and 4 hydrogen bonds were formed. Interestingly,
the oxygen bridge of the linker group engaged TRY308 via one hydrogen bond interaction (Figure 11). TRY308 is a component of the charge-relay system of HDAC2 catalysis. These interactions added up to contribute to the overall stability of the complex.
These findings are especially important given the lack of specificity of the many HDAC inhibitors in clinical use and trials. It is particularly challenging to achieve isoform selectivity among Class I HDACs 1–3 due to their highly conserved active site. It is believed that the continued identification of isoform-specific inhibitors will remain a major challenge to HDAC inhibitor development. Theoretically, the isoform-specific HDAC inhibitors might
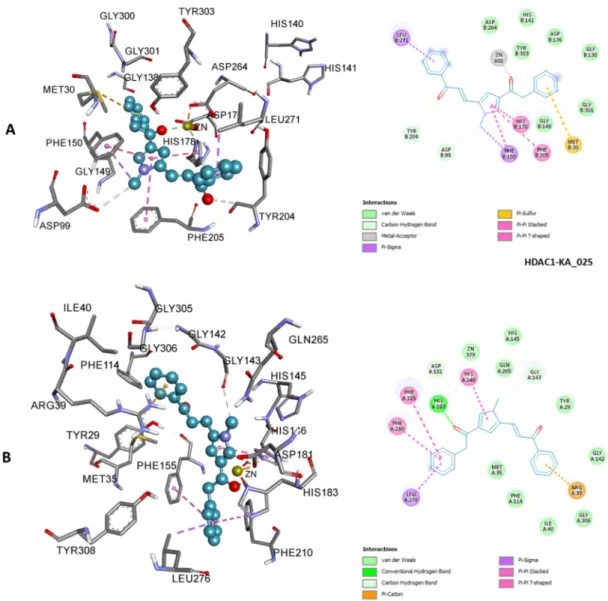
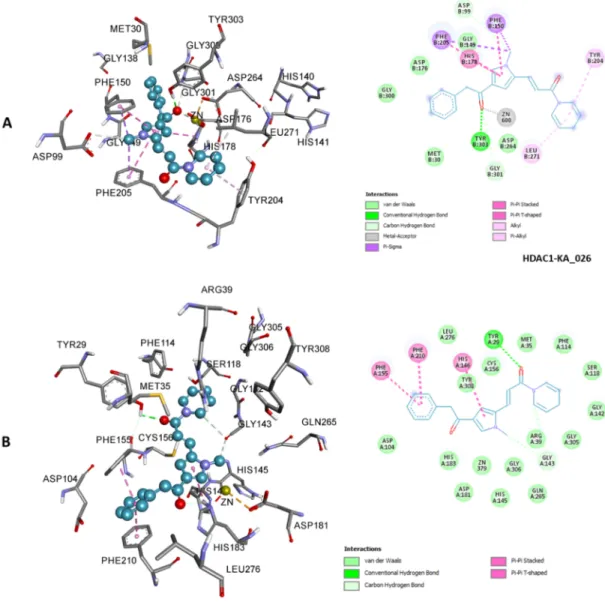
Figure 7. 3D (left) and 2D (right) representations of HDAC1 active site containing KA_025; zinc ion interacted
with carbonyl oxygen via metal-acceptor interaction (A). 3D (left) and 2D (right) representations of HDAC2 active site containing KA_025 (B). KA_025 bound HDACs 1 and 2 with different binding modes and yet showed similar affinity. Other types of nonbond interactions are indicated in their respective colors in the 2D scheme.
be more effective if the specific HDAC is a component of a repressive complex that is crucial for tumorigenesis (Lane and Chabner, 2009). In this study, Class I HDACs and HDAC6 were targeted considering findings that histone acetylation is thought to be primarily regulated by HDACs 1–3, whereas the acetylation of tubulin and Hsp90 is specifically regulated through HDAC6 (Newbold et al., 2013). These provide strong rationales for the selective inhibition of these individual isoforms in cancer. The search for isoform-selective HDAC inhibitors is being carried out using both computational and experimental approaches. Computational procedures are indispensable components of rational drug design. Thus, we believe
that these predicted HDAC inhibitors can be potentially isoform-selective, warranting further modeling-based and experimental studies towards validation of their bioactivity.
In conclusion, potent and selective inhibitors of HDACs 1 and 2 were designed by a combination of structure-based virtual screening and scaffold hopping using pharmacophore information of known HDAC inhibitors. Their binding affinities and modes were examined by molecular docking assay. They were also found to be drug-like according to ADMET prediction using two independent ADMET prediction tools. We therefore believe that these findings may offer additional
Figure 8. 3D (left) and 2D (right) representations of HDAC1 active site containing KA_026; zinc ion interacted
with sulfonyl oxygen via metal-acceptor interaction (A). 3D (left) and 2D (right) representations of HDAC2 active site containing KA_026 (B). KA_026 bound HDACs 1 and 2 with similar binding modes and binding affinity. Other types of nonbond interactions are indicated in their respective colors in the 2D scheme.
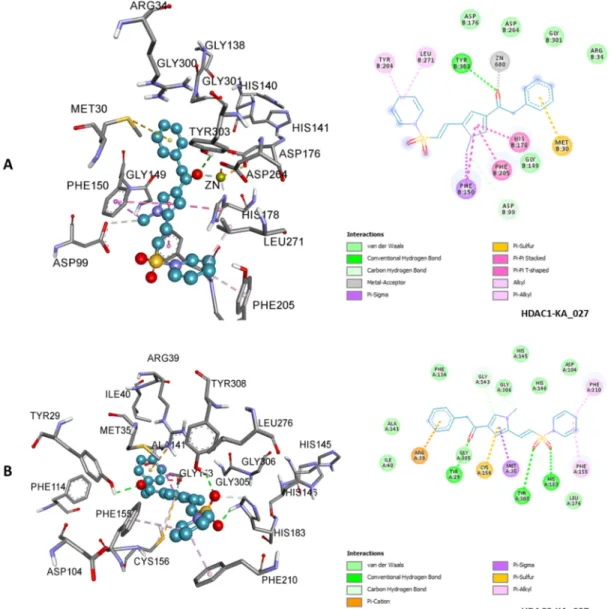
Figure 9. 3D (left) and 2D (right) representations of HDAC1 active site containing KA_027; zinc ion interacted
with carbonyl oxygen via metal-acceptor interaction (A). 3D (left) and 2D (right) representations of HDAC2 active site containing KA_027 (B). KA_027 bound HDACs 1 and 2 with similar binding modes and binding affinity. Unique π-sigma interaction with HDAC1 and π-cation interaction with HDAC2 were observed. Other types of nonbond interactions are indicated in their respective colors in the 2D scheme.
Figure 10. 3D (upper) and 2D (lower) representations of HDAC1 active site
containing KA_029. The types of nonbond interactions are indicated in their respective colors in the 2D scheme; zinc ion (in ash spheres) interacted with sulfonyl oxygen via metal-acceptor interaction.
Figure 11. 3D (upper) and 2D (lower) representations of HDAC2 active site containing
KA_036. The types of nonbond interactions are indicated in their respective colors in the 2D scheme.
potential HDAC inhibitors with isoform selectivity or provide scaffolds for further optimization towards the discovery of selective HDAC inhibitors for cancer therapy.
Acknowledgments
AİU was supported by Bayero University, Kano, under a “Needs Assessment Grant” for PhD fellowship number
BUK/PME&DC/NA/ST&D/2. All the molecular modeling procedures were carried out using software available at the Bioinformatics and Genetics Laboratory of Kadir Has University. We appreciate the suggestions offered by Asst Prof Dr Hatice Bahar Şahin of the department during the course of writing this manuscript.
References
Akamatsu M, Fujikawa M, Nakao K, Shimizu R (2009). In silico prediction of human oral absorption based on QSAR analyses of PAMPA permeability. Chem Biodivers 6: 1845-1866. Bannister AJ, Kouzarides T (2011). Regulation of chromatin by
histone modifications. Cell Res 21: 381-395.
Bazzaro M, Lin Z, Santillan A, Lee MK, Wang MC, Chan KC, Bristow RE, Mazitschek R, Bradner J, Roden RBS (2008).Ubiquitin proteasome system stress underlies synergistic killing of ovarian cancer cells by bortezomib and a novel HDAC6 inhibitor. Clin Cancer Res 14: 7340-7347.
Böhm HJ, Flohr A, Stahl M (2004). Scaffold hopping. Drug Discov 1: 217-224.
Bolden JE, Peart MJ, Johnstone RW (2006). Anticancer activities of histone deacetylase inhibitors. Nat Rev Drug Discov 5: 769-784.
Boumber Y, Younes A, Garcia-Manero G (2011). Mocetinostat (MGCD0103): a review of an isotype-specific histone deacetylase inhibitor. Expert Opin Investig Drugs 20: 823-829. Bracker TU, Sommer A, Fichtner I, Faus H, Haendler B,
Hess-Stumpp H (2009). Efficacy of MS-275, a selective inhibitor of class I histone deacetylases, in human colon cancer models. Int J Oncol 35: 909-920.
Cacan E, Ali MW, Boyd NH, Hooks SB, Greer SF (2014). Inhibition of HDAC1 and DNMT1 modulate RGS10 expression and decrease ovarian cancer chemoresistance. PLoS One 9: 87455. Cheng F, Li W, Zhou Y, Shen J, Wu Z, Liu G, Lee PW, Tang Y
(2012). AdmetSAR: A comprehensive source and free tool for assessment of chemical ADMET properties. J Chem Inf Model 52: 3099-3105
Cosenza M, Civallero M, Pozzi S, Marcheselli L, Sacchi S (2014). Preclinical screening of the HDAC6 inhibitor rocilinostat (ACY-1215) combined with bendamustine in lymphoma cell lines. Blood 124: 3124.
de Magalhães CS, Barbosa HJC, Dardenne LE (2004). A genetic algorithm for the ligand-protein docking problem. Genet Mol Biol 27: 605-610.
Di L, Kerns EH (2008). Drug-Like Properties: Concepts, Structure Design and Methods: From ADME to Toxicity Optimization. 1st ed. Burlington, MA, USA: Academic Press.
Dong CY, Jiang YJ, Zhou JW, Yu, Sen YQ, You QD (2008). Identification of ligand features essential for HDACs inhibitors by pharmacophore modeling. J Mol Graph Model 26: 1160-1168.
Finnin MS, Donigian JR, Cohen A, Richon VM, Rifkind RA, Marks PA, Breslow R, Pavletich NP (1999). Structures of a histone deacetylase homologue bound to the TSA and SAHA inhibitors. Nature 401: 188-193.
Fischle W, Kiermer V, Dequiedt F, Verdin E (2001). The emerging role of class II histone deacetylases. Biochem Cell Biol 79: 337-348. Fournel M, Bonfils C, Hou Y, Yan PT, Trachy-Bourget MC, Kalita
A, Lu AH, Zhou NZ, Robert MF, Gillespie J et al. (2008). MGCD0103, a novel isotype-selective histone deacetylase inhibitor, has broad spectrum antitumor activity in vitro and in vivo. Mol Cancer Ther 7: 759-768.
Fraga MF, Ballestar E, Villar-Garea A, Boix-Chornet M, Espada J, Schotta G, Bonaldi T, Haydon C, Ropero S, Petrie K et al. (2005). Loss of acetylation at Lys16 and trimethylation at Lys20 of histone H4 is a common hallmark of human cancer. Nat Genet 37: 391-400.
Garcia-Manero G, Assouline S, Cortes J, Estrov Z, Kantarjian H, Yang H, Newsome WM, Miller WH Jr, Rousseau C, Kalita A et al. (2008). Phase 1 study of the oral isotype specific histone deacetylase inhibitor MGCD0103 in leukemia. Blood 112: 981-989.
Ghasemi J, Saaidpour S (2007). QSPR prediction of aqueous solubility of drug-like organic compounds. Chem Pharm Bull 55: 669-674.
Godman CA, Joshi R, Tierney BR, Greenspan E, Rasmussen TP, Wang H, Shin D, Rosenberg DW, Giardina C (2008). HDAC3 impacts multiple oncogenic pathways in colon cancer cells with effects on Wnt and vitamin D signaling. Cancer Biol Ther 7: 1570-1580.
Gregoretti IV, Lee YM, Goodson HV (2004). Molecular evolution of the histone deacetylase family: functional implications of phylogenetic analysis. J Mol Biol 338: 17-31.
Haggarty SJ, Koeller KM, Wong JC, Grozinger CM, Schreiber SL (2003). Domain-selective small-molecule inhibitor of histone deacetylase 6 (HDAC6)-mediated tubulin deacetylation. P Natl Acad Sci USA 100: 4389-4394.
Halkidou K, Gaughan L, Cook S, Leung HY, Neal DE, Robson CN (2004). Upregulation and nuclear recruitment of HDAC1 in hormone refractory prostate cancer. Prostate 59: 177-189. Huang YX, Zhao J, Song QH, Zheng LH, Fan C, Liu TT, Bao YL,
Sun LG, Zhang LB, Li YX (2016). Virtual screening and experimental validation of novel histone deacetylase inhibitors. BMC Pharmacol Toxicol 17: 32.
Khorasanizadeh S (2004). The nucleosome: from genomic organization to genomic regulation. Cell 116: 259-272.
Kim HJ, Bae SC (2011). Histone deacetylase inhibitors: molecular mechanisms of action and clinical trials as anti-cancer drugs. Am J Transl Res 3: 166-179.
Kouzarides T (2007). Chromatin modifications and their function. Cell 128: 693-705.
Langdon SR, Ertl P, Brown N (2010). Bioisosteric replacement and scaffold hopping in lead generation and optimization. Mol Inform 29: 366-385.
Lauffer BE, Mintzer R, Fong R, Mukund S, Tam C, Zilberleyb I, Flicke B, Ritscher A, Fedorowicz G, Vallero R et al. (2013). Histone deacetylase (HDAC) inhibitor kinetic rate constants correlate with cellular histone acetylation but not transcription and cell viability. J Biol Chem 288: 26926-26943.
Li B, Carey M, Workman JL (2007). The role of chromatin during transcription. Cell 128: 707-719.
Lipinski CA (2004). Lead- and drug-like compounds: the rule-of-five revolution. Drug Discov Today Technol 1: 337-341.
Liu XH, Song HY, Zhang JX, Han BC, Wei XN, Ma XH, Cui WK, Chen YZ (2010). Identifying novel type ZBGs and nonhydroxamate HDAC inhibitors through a SVM based virtual screening approach. Mol Inform 29: 407-420.
MacKerell AD, Banavali NK (2000). All-atom empirical force field for nucleic acids: II. Application to molecular dynamics simulations of DNA and RNA in solution. J Comp Chem 21: 105-120.
McConkey DJ, White M, Yan W (2012). HDAC inhibitor modulation of proteotoxicity as a therapeutic approach in cancer. Adv Cancer Res 116: 131-163.
Millard CJ, Watson PJ, Celardo I, Gordiyenko Y, Cowley SM, Robinson CV, Fairall L, Schwabe JW (2013). Class I HDACs share a common mechanism of regulation by inositol phosphates. Mol Cell 51: 57-67.
Mottamal M, Zheng S, Huang T, Wang G (2015). Histone deacetylase inhibitors in clinical studies as templates for new anticancer agents. Molecules 20: 3898-3941.
Nair SB, Teli MK, Pradeep H, Rajanikant GK (2012). Computational identification of novel histone deacetylase inhibitors by docking based QSAR. Comput Biol Med 42: 697-705.
Newbold A, Matthews GM, Bots M, Cluse LA, Clarke CJP, Banks KM, Cullinane C, Bolden JE, Christiansen AJ, Dickins RA et al. (2013). Molecular and biologic analysis of histone deacetylase inhibitors with diverse specificities. Mol Cancer Ther 12: 2709-2721.
Nordqvist A, Nilsson J, Lindmark T, Eriksson A, Garberg P, Kihlén M (2004). A general model for prediction of Caco-2 cell permeability. QSAR Comb Sci 23: 303-310.
Noureen N, Kalsoom S, Rashid H (2010). Ligand based pharmacophore modelling of anticancer histone deacetylase inhibitors. Afr J Biotechnol 9: 3923-3931.
Oehme I, Deubzer HE, Wegener D, Pickert D, Linke JP, Hero B, Kopp-Schneider A, Westermann F, Ulrich SM, Deimling AV et al. (2009). Histone deacetylase 8 in neuroblastoma tumorigenesis. Clin Cancer Res 15: 91-99.
Ouyang H, Ali YO, Ravichandran M, Dong A, Qiu W, MacKenzie F, Dhe-Paganon S, Arrowsmith CH, Zhai RG (2012). Protein aggregates are recruited to aggresome by histone deacetylase 6 via unanchored ubiquitin C termini. J Biol Chem 287: 2317-2327.
Owens J, Lipinski CA (2003). Chris Lipinski discusses life and chemistry after the Rule of Five. Drug Discov Today 8: 12-16. Paixão P, Gouveia LF, Morais JAG (2010). Prediction of the in vitro
permeability determined in Caco-2 cells by using artificial neural networks. Eur J Pharm Sci 41: 107-117.
Park H, Kim S, Kim YE, Lim SJ (2010). A structure-based virtual screening approach toward the discovery of histone deacetylase inhibitors: identification of promising zinc-chelating groups. ChemMedChem 5: 591-597.
Park SY, Jun JA, Jeong KJ, Heo HJ, Sohn JS, Lee HY, Park CG, Kang J (2011). Histone deacetylases 1, 6 and 8 are critical for invasion in breast cancer. Oncol Rep 25: 1677-1681.
Peng L, Seto E (2011). Deacetylation of nonhistone proteins by HDACs and the implications in cancer. Handbook of Experimental Pharmacology 206: 39-56.
Pili R, Salumbides B, Zhao M, Altiok S, Qian D, Zwiebel J, Carducci MA, Rudek MA (2011). Phase I study of the histone deacetylase inhibitor entinostat in combination with 13-cis retinoic acid in patients with solid tumours. Br J Cancer 106: 77-84.
Ponce YM, Perez MAC, Zaldivar VR, Sanz MB, Mota DS, Torrens F (2005). Prediction of intestinal epithelial transport of drug in (Caco-2) cell culture from molecular structure using in silico approaches during early drug discovery. J Mol Des 4: 124-150. Prakash S, Foster BJ, Meyer M, Wozniak A, Heilbrun LK, Flaherty
L, Zlupski M, Radulovic L, Valdivieso M, LoRusso PM (2001). Chronic oral administration of CI-994: a phase 1 study. Invest New Drugs 19: 1-11.
Rajendran P, Delage B, Dashwood WM, Yu T, Wuth B, Williams DE, Ho E, Dashwood RH (2011). Histone deacetylase turnover and recovery in sulforaphane-treated colon cancer cells: competing actions of 14-3-3 and Pin1 in HDAC3/SMRT corepressor complex dissociation/reassembly. Mol Cancer 10: 68.
Richmond TJ, Davey CA (2003). The structure of DNA in the nucleosome core. Nature 423: 145-150.
Ridder L, Wang H, de Vlieg J, Wagener M (2011). Revisiting the rule of five on the basis of pharmacokinetic data from rat. ChemMedChem 6: 1967-1970.
Roth SY, Denu JM, Allis D (2001). Histone acetyltransferases. Annu Rev Biochem 70: 81-120.
Sakuma T, Uzawa K, Onda T, Shiiba M, Yokoe H, Shibahara T, Tanzawa H (2006). Aberrant expression of histone deacetylase 6 in oral squamous cell carcinoma. Int J Oncol 29: 117-124.
Schüler S, Fritsche P, Diersch S, Arlt A, Schmid RM, Saur D, Schneider G (2010). HDAC2 attenuates TRAIL-induced apoptosis of pancreatic cancer cells. Mol Cancer 9: 80.
Singh BN, Zhang G, Hwa YL, Li J, Dowdy SC, Jiang SW (2010). Nonhistone protein acetylation as cancer therapy targets. Expert Rev Anticancer Ther 10: 935-954.
Singh KP, Gupta S, Basant N (2015). In silico prediction of cellular permeability of diverse chemicals using qualitative and quantitative SAR modeling approaches. Chemometr Intell Lab 140: 61-72.
Somoza JR, Skene RJ, Katz BA, Mol C, Ho JD, Jennings AJ, Luong C, Arvai A, Buggy JJ, Chi E (2004). Structural snapshots of human HDAC8 provide insights into the class I histone deacetylases. Structure 12: 1325-1334.
Spurling CC, Godman CA, Noonan EJ, Rasmussen TP, Rosenberg DW, Giardina C (2008). HDAC3 overexpression and colon cancer cell proliferation and differentiation. Mol Carcinog 47: 137-147.
Sundarapandian T, Shalini J, Sugunadevi S, Woo LK (2010). Docking-enabled pharmacophore model for histone deacetylase 8 inhibitors and its application in anti-cancer drug discovery. J Mol Graph Model 29: 382-395.
Thangapandian S, John S, Sakkiah S, Lee KW (2010). Ligand and structure based pharmacophore modeling to facilitate novel histone deacetylase 8 inhibitor design. Eur J Med Chem 45: 4409-4417.
Van Breemen RB, Li Y (2005). Caco-2 cell permeability assays to measure drug absorption. Expert Opin Drug Metab Toxico 1: 175-185.
Verdin E, Dequiedt F, Kasler HG (2003). Class II histone deacetylases: versatile regulators. Trends Genet 19: 286-293.
Volpe DA (2011). Drug-permeability and transporter assays in Caco-2 and MDCK cell lines. Future Med Chem 3: Caco-2063-Caco-2077. Volpe DA, Faustino PJ, Ciavarella AB, Asafu-Adjaye EB, Ellison CD,
Yu LX, Hussain AS (2007). Classification of drug permeability with a Caco-2 cell monolayer assay. Clin Res Reg Affairs 24: 39-47.
Wang T, Sepulveda M, Gonzales P, Gately S (2013). Identification of novel HDAC inhibitors through cell based screening and their evaluation as potential anticancer agents. Bioorg Med Chem Lett 23: 4790-4793.
Watson PJ, Fairall L, Santos GM, Schwabe JWR (2012). Structure of HDAC3 bound to co-repressor and inositol tetraphosphate. Nature 481: 335-340.
Weiner SJ, Kollman PA, Case DA, Singh UC, Ghio C, Alagona G, Profeta S, Weinerl P (1984). A new force field for molecular mechanical simulation of nucleic acids and proteins. J Am Chem Soc 106: 765-784.
Wilson AJ, Byun DS, Popova N, Murray LB, L’Italien K, Sowa Y, Arango D, Velcich A, Augenlicht LH, Mariadason JM (2006). Histone deacetylase 3 (HDAC3) and other class I HDACs regulate colon cell maturation and p21 expression and are deregulated in human colon cancer. J Biol Chem 281: 13548-13558.
Xiang Y, Hou Z, Zhang Z (2012). Pharmacophore and QSAR studies to design novel histone deacetylase 2 inhibitors. Chem Biol Drug Des. 79: 760-70.
Xie HJ, Noh JH, Kim JK, Jung KH, Eun JW, Bae HJ, Kim MG, Chang YG, Lee JY, Park H et al. (2012). HDAC1 inactivation induces mitotic defect and caspase-independent autophagic cell death in liver cancer. PLoS One 7: 34265.
Yang XJ, Grégoire S (2005). Class II histone deacetylases: from sequence to function, regulation, and clinical implication. Mol Cell Biol 25: 2873-2884.
Zhang Z, Yamashita H, Toyama T, Sugiura H, Ando Y, Mita K, Hamaguchi M, Hara Y, Kobayashi S, Iwase H (2005). Quantitation of HDAC1 mRNA expression in invasive carcinoma of the breast. Breast Cancer Res Treat 94: 11-16. Zentner GE, Henikoff S (2013). Regulation of nucleosome dynamics