Optimal Sizing and Siting of EV Charging Stations
in a Real Distribution System Environment
İbrahim Şengör Electrical and Electronics
Engineering Department İzmir Katip Çelebi
University İzmir, Turkey [email protected]
Ayse Kübra Erenoğlu, Ozan Erdinç
Electrical Engineering Department Yildiz Technical University
İstanbul, Turkey {erenayse,oerdinc}@yildiz.edu.tr
Akın Taşcıkaraoğlu Electrical and Electronics
Engineering Department Muğla Sıtkı Koçman
University Muğla, Turkey [email protected]
İbrahim Can Taştan, Ali Fuat Büyük Smart Systems, R&D Osmangazi Electricity Distribution Co.
Eskişehir, Turkey
{ibrahim.tastan,ali.buyuk}@oedas.com.tr
Abstract— Fully electric vehicles have started to gain more importance due to the idea of allowing increased use of electricity in the transportation sector in recent years. However, high penetration of electric vehicles into the existing power systems may cause significant challenges especially for the distribution systems due to their charging demand. This study covers a mixed-integer linear programming model with the aim of optimal locating and dimensioning for electric vehicle charging stations in a distribution system. The proposed model is tested in the distribution system of a region in Turkey managed by the Osmangazi Electricity Distribution Company. Besides, the study considers the power flow between the regions via linear approximation of losses. Therefore, the propounded model includes power flow restrictions due to the power limitation of the grid, transformers, and the transmission capacity of branches. To show the efficacy of the model, simulations are conducted by using measured load data along with the actual electric vehicle data.
Keywords—charging station, distribution system, electric vehicles, siting, sizing.
NOMENCLATURE
This section shows the details on the used abbreviations in the text, along with referred sets, parameters, and variables throughout the mathematical background of the proposed model. A. Abbreviations CS Charging station DG Distributed generation. DS Distribution system EV Electric vehicle EVCS EV charging station GA Genetic algorithm.
MILP Mixed-integer linear programming PSO Particle swarm optimization. SoE State-of-energy SOS2 Special Order Sets of Type 2.
B. Sets
Set of branches.
Set of nodes.
Set of charging stations.
Set of EVs.
Set of points in SOS2 approach.
Period of the day index in time units [min].
C. Parameters
Charging efficiency of EV .
Charging capacity of CS [kW].
Power transmission capacity of branch [kW]. Sufficiently large positive number.
, Power capacity of generator located at node
[kW].
, _ Power demand of other loads at node for the period [kW]. , , Desired SoE of EV in the region fed by node at the departure time [kWh]. , , Initial SoE of EV in the region fed by node [kWh]. , , Maximum SoE of EV in the region fed by node [kWh]. , , Minimum SoE of EV in the region fed by node [kWh]. , Arrival time period of EV in the region fed by node . , Departure time period of EV in the region fed by node .
Y-Coordinate of point used in SOS2. X-Coordinate of point used in SOS2.
Time granularity [mins].
D. Variables
, Approximate value of the square of the power flow on branch in period [kW ]. , Active power flow on branch in period [kW].
. Total number of CSs located in the distribution system.
, Power drawn from the grid during period [kW].
,,
Active power provided by substation at node during period to cover the demand [kW].
, , Charging power of EV in the region fed by node during period [kW]. , _ _ The total power demand of EVs in node i during period t [kW].
, Power losses of branch in period [kW]. , , SoE of EV in the region fed by node during period [kWh]. , Binary variable. If CS is located in node then 1, otherwise 0.
, ,, , , Binary variables for determining the charging transactions of each EV. , , SOS2 variables that are used to approximate the power losses.
I
.
INTRODUCTIONA. Motivation and Background
The idea of replacing gasoline and diesel fueled vehicles with electric powered vehicles has come into question more prominently in the last decade to cope with the global environmental problems such as urban air pollution and fossil fuel dependency. To this end, the number of electric vehicles (EVs) on the roads has gradually increased over the recent years, reaching a number of over 5.1 million worldwide in 2018 [1]. Along with this increase, the share of EVs in the global vehicle sales grew to 1.8% in the first quarter of 2019 [1]; however, the EV market is still below expectations as this share represents a very small portion of all the cars in the world. The main barriers that hinder the more exploitation of their market acceptance are generally recognized as their limited range and unavailability of EV charging stations (EVCSs) for all possible routes between an origin and a destination [2]. Besides, the long waiting times in available CSs for charging of EVs, especially when all the charging units are occupied, might affect their large-scale adoption. Transferring the EVs to one of the nearby CSs might save time under certain conditions. Nevertheless, it is also likely to wait for almost the same time or even more in another CS depending on charging queuing and CS capacity [3].
In order to overcome these problems, the deployment of more CSs in a given area might be an effective solution; however, high investment costs of these stations and also their impact on electric distribution networks generally limit their expansion. In order to support the interest on EVs, therefore, it is crucial to determine the most appropriate location and capacity of CSs by taking the different objectives into account. These objectives can be gathered into three groups according to the literature based on: (i) minimization of infrastructure and planning costs, (ii) meeting charging demands, and (iii) minimization of power losses on distribution lines.
B. Relevant Background
With the objective of minimizing relevant construction and operation costs, Ren et al. [4] proposed a model based on genetic algorithm (GA) to select the quantity and location of CSs, and examined the factors that might influence this selection. An approach combining GA and particle swarm optimization (PSO) was used for the optimal placement of CSs in [5] by considering operation and maintenance costs, cost of equipment installed in CS and land cost. Another planning approach for EVCSs on a freeway was proposed in [6], comprising of a spatial-temporal model which provides the EV charging points, a second model which determines the optimum EVCS locations according to the spatial distribution of EVCSs, and a third model which calculates the number of chargers in each CS for reducing waiting and charger costs. Still for the minimization of the total installation cost of EVCSs, Wang et al. [7] studied on the placement of EVCS at selected bus stops for public bus systems through the cases with and without the battery size constraint of the electric bus. A mixed-integer linear programming (MILP) model was proposed by Zhang et al. [8] for optimal planning of highway EVCSs in which transportation constraints, distribution line current and nodal voltage limits, Kirchhoff’s law constraints and budget constraint were considered for the purpose of reducing the
investment costs. Also, Ma and Zhang [9] developed a method to determine the size and location of EVCSs by predicting the size and optimizing the locations of CSs in different years, which regarded the minimization of total charging infrastructure cost as the objective function. Recently, Yang et al. [10] presented a planning approach for determining the number of chargers and waiting spaces in CSs based on charge characterization of EV demand in order to maximize the CS profit by taking the charging service profit, waiting costs and maintenance costs into account.
As for the studies focusing on charging demands, appropriate allocation of EVCSs along a highway network was studied in [11] by examining the supply (road network) and demand (EV flows) for the purpose of calculating their number and correct place. Andrenacci et al. [12] studied on determining the optimal layout for charging infrastructures by considering actual vehicle usage data and the estimated charging energy requirement of different areas. Also, in order to maximize the flows of the EVs served, siting and sizing problem was investigated in [13] under a fixed budget.
Regarding the last objective which has been widely considered in the literature of optimal sizing and siting of EVCSs, Hung et al. [14] presented an analytical approach for optimal sizing of workplace CSs which are powered by photovoltaic units with the objective of reducing energy losses through reactive power support to distribution network. Besides, a Grasshopper optimization algorithm based fuzzy approach was used for optimum sizing and siting of both EVCSs and distributed generation (DG) units for reducing active power losses and improving voltage profile [15]. Considering two different objectives separately, which are to minimize the grid losses and to maximize the total EVCS capacity, a methodology was proposed in [16] for determining the optimum size of EVCSs as well as DGs and electric energy storage systems.
In addition to the studies aiming at deriving the optimum solution for the sizing and siting problem of EVCSs by mainly considering a sole objective, several studies have defined more than one objective function for this problem. For an instance, the technique for order of preference by similarity to ideal solution approach and geographic information system were applied in [17] to select the most appropriate sites for EVCSs by considering environmental, geographical and urbanity criteria in addition to the economic ones such as EV ownership in the area and land cost. A method based on GA and PSO was developed for simultaneous determination of siting and sizing of EVCSs and renewable energy systems in order to reduce various costs such as EV battery cost and charging and demand supplying costs, and to improve power system operation by reducing active losses and voltage fluctuations [18]. Apart from the infrastructures and maintenance costs, various environmental criteria such as air quality and waste discharge, and social criteria such as population density and traffic convenience were taken into account in a Bayesian network model in [19] for optimal site selection problem. Similarly, in order to minimize the investment and operation costs of EVCSs while maximizing the traffic flow captured annually, various load models for different modes such as EV charging mode and battery swapping mode were identified, and a planning model was then developed based on these models [20]. Besides, a multi-objective function based on GA and PSO algorithms was developed in [21] for
the determination of site and capacity of both EVCSs and DGs to minimize EV charging costs, battery-related costs, voltage fluctuations and power losses. Also, Shaaban et al. [22] presented a mixed integer non-linear programming based model which specifies optimal siting and sizing of EVCSs and DG units in microgrids with the objective of finding a compromise solution between two different objectives, namely, deployment and operation costs, and greenhouse gas emissions.
C. Contributions and Organization
Motivated by the more realistic results obtained in the aforementioned studies, this study considers the minimization of the total CS capacity in a distribution system while still meeting the demand of EV owners by determining the optimal sizing and siting of EVCSs in the mentioned distribution system. More specifically, the optimal number of CSs to be connected to the buses in a distribution system is examined by considering the mentioned objective function with power flow and other conceptual constraints.
The main contributions of the proposed study can be summarized as follows:
• The optimal sizing and siting problem is solved by minimizing the number of CSs while still meeting the demand of a given number of EVs for the first time in the literature. The mentioned objective function is selected in order to supply the charging needs of EVs with minimum number of EVs and accordingly minimized investment requirements in a specific area under planning oriented analysis.
• The performance of the system is evaluated under the conventional power flow constraints. Also, the data collected from a real distribution system are used to evaluate the system performance under realistic conditions.
The rest of this paper is organized as follows: Section II indicates the details on the methodology of the proposed model. Section III describes the evaluated distribution system with the relevant input data. Moreover, the simulation results are discussed in this section. Finally, concluding remarks of the study are highlighted in Section IV.
II
.
METHODOLOGYA MILP based model is propounded for the optimal sizing and siting of CSs in a distribution system in this study. Furthermore, the proposed model takes into consideration the power flow among the busses with the aid of linear approximation of the losses on the branches.
A. Objective Function
The main objective of the devised model is to minimize the total CSs in the system for the fulfillment of the charging necessity of EVs, as stated in (1).
. = , (1)
B. The Distribution System Constraints
Equation (2) describes the overall power balance of the
system for each period. The term , _ represents the
other loads fed at the related node for the period t. The total power consumption of EVs connected to each node for the
period t is expressed by , _ _ . The summation of both
quantities has to be equal to the power flowing to the related node on the branches during the period t. It is worth to underline that the power flow in this model is assumed as from generator to the loads in a single direction as the DG availability is not considered in this study. Besides, the power transmission capacity of each branch is determined by (3). Also, the power balance for the substation node is described in (4). In this equation, total power demand of the other loads, EVs and active power losses are to be met by the
provided power by substation at node during period .
Moreover, the power limit of generator needs to be determined as it is in (5). ,, + , ∀ : ∈ − , ∀ : ∈ = , _ _ + , _ , ∀ ∈ , ∀ ∈ (2) , ≤ ∀ ∈ , ∈ (3) , = ,, + , ∈ ∀ ∈ , ∀ ∈ (4) 0 ≤ , ≤ ∀ ∈ , ∀ ∈ , (5)
C. Linear Approximation of the Losses
Equation (6) expresses the total power losses as a second-order function of power flow in the lines with the constant value of and . However, this expression has a nonlinear
term ( , ) that has to be linearized. To serve this purpose, a
well-known linearization method, named Special Order Sets of Type 2 (SOS2), is included so as to obtain convenient approximation into the MILP framework. Equation (7) is written for denoting the SOS2 variables while the power flow in the branches is approximated by using these variables and constraints in (8) and (9).
, = ∙ , + ∙ , , ∀ ∈ , ∀ ∈ (6) , , ∈ = 1 , ∀ ∈ , ∀ ∈ (7) , = ∈ ∙ , , , ∀ ∈ , ∀ ∈ (8) , = ∈ ∙ , , , ∀ ∈ , ∀ ∈ (9)
D. EV Charging Limitations and battery constraints
The total power demand of EVs in node i during period t is equal to the summation of the power demand of each EV charging from the CS located in the related node, as stated in (10). The power consumption of an EV cannot exceed the power capacity of the CS, as provided in (11). It should be underlined that the model considers a single type of CS as power capacity. Equation (12) describes the state-of-energy (SoE) changes of the related EV during the charging period,
in which , , represents the previous SoE level of the
EV and , ,. . stands for the energy charged during
period t. Furthermore, equations (13), (14), and (15) determine the initial SoE level of the EV when it is plugged in, the desired SoE level of the EV at the departure period,
and the boundaries for the SoE of the EV battery, respectively. Finally, the SoE and the charging power values of each EV must not take any value in the periods that it is not plugged-in any CS, as provided in (16).
, _ _ = , , , ∀ , ∀ (10) , , ≤ ∙ , ,, ∀ , ∀ , ∀ ∈ [ , , , ] (11) , , = , , + , , ∙ ∙ , ∀ , ∀ , ∀ ∈ [ , , , ] (12) , , = , , , ∀ , ∀ , = , (13) , , = , , ∀ , ∀ , = , (14) , , ≤ , , ≤ , , , ∀ , ∀ , ∀ (15) , , = 0, , , = 0, ∀ , ∀ , ∀ ∉ [ , , , ] (16)
E. Additional Logical Constraints
In order to perform the charging transactions of each EV properly with the purpose of minimizing the number of CS to be located in the system, some additional constraints are implemented into the devised model. A CS can be located into a single node thanks to the binary variable stated in (17). Equation (18) prevents the total number of EVs in charging state within each period t to exceed the number of CS in the
related node as , , denotes which CSs are active at each
time period. Constraints in (19) and (20) determine the matching of EVs to a CS. Herein, if an EV is started to charged, there cannot be any new EV to be plugged-in at the same CS until the current EV reaches to the desired SoE
level as , , is 0 when SoE of EV is lower than the desired
SoE level and this prevents the change of the value of , ,
between consecutive time periods.
, ≤ 1, ∀ (17)
, , ≤ , , ∀ , ∀ (18)
, , ≥ , , . , , , ∀ , ∀ , ∀ (19)
, , − , , ≤ , , , ∀ , ∀ , ∀ (20)
III.TEST AND RESULTS
A. Input Data
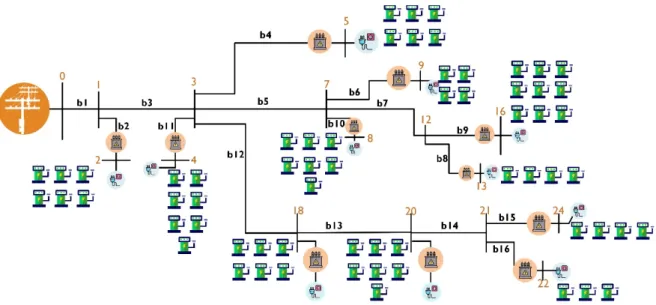
The MILP model propounded for optimal the sizing and siting of CSs within a distribution system has been tested using the model of a real distribution system portion managed by Osmangazi Electricity Distribution Company (OEDAŞ). Figure 1 shows the single line diagram of the evaluated distribution system model. As can be seen in the
demonstration, it is a radial type 24-bus network with eleven of the 24-bus are equipped with a transformer.
During the simulations, a hundred identical EVs are considered, and the technical specification of the EV is given in Table I. Furthermore, each EV has a different initial SoE level when it is started to charge, as shown in Fig. 2. It should be stated that the uncertainty related to EV behavior, such as locations, initial SoE levels, and arrival time of EVs, is not evaluated in the scope of the study. Therefore, the region of EVs is determined randomly.
In the considered distribution system, there are eleven transformers, which have different rated powers, to feed the other load demand of those regions. Besides, the daily power consumption of those regions is measured from the substations and Fig. 3 demonstrates the power profile of Bus 4. It also needs to be highlighted that only one of them is shown for the sake of clarity.
B. Simulation Results
The proposed model is simulated in GAMS v.24.1.3 and has been solved by commercial solver of CPLEX v.12. Table II includes the number of EVs in each region fed by the buses and the result of simulations conducted to find the number of CSs on each bus. Furthermore, Fig. 4 visualizes the number of CSs on each bus on the single line diagram of the distribution system.
Fig. 1. Single line diagram of the evaluated distribution system. TABLE I. ELECTRICAL CHARACTERISTICS OF THE EV Model Charging rate [kW] Charging Efficiency [%] Max. Capacity [kWh] Min. Capacity [kWh] Reanult ZoE 22 0.95 41 4
Fig. 2. The initial SoE levels of the evaluated EVs in the whole system.
Fig. 4. Demonstration of the located CSs in the evaluated DS. TABLE II. RESULTS FOR LOCATED NUMBER OF CSS
Bus Number EVs Number of CSs Bus Number EVs Number of CSs
Main Bus 0 0 Bus-13 8 4
Bus-1 0 0 Bus-14 0 0 Bus-2 10 6 Bus-15 0 0 Bus-3 0 0 Bus-16 12 9 Bus-4 10 7 Bus-17 0 0 Bus-5 8 6 Bus-18 8 6 Bus-6 0 0 Bus-19 0 0 Bus-7 0 0 Bus-20 12 7 Bus-8 12 7 Bus-21 0 0 Bus-9 8 4 Bus-22 4 3 Bus-10 0 0 Bus-23 0 0 Bus-11 0 0 Bus-24 8 4 Bus-12 0 0 Total: 100 63
As seen from Table II and Fig. 4, the optimal CS number is obtained based on the arrival times and initial SoE levels of EVs for each region. Figure 5 shows the comparison of the power demand for other loads and EVs’ demand during the charging process for Bus 4. It can be seen from the mentioned figure that the power consumption of the other loads is fairly higher than the EVs’ charging demand. Similarly, Fig. 6 represents the power consumption profiles for both other loads and EVs separately for Bus 16. Herein, EVs’ power demands are much higher than the other loads fed from the transformers in some periods. In the comparison of EVs demands in both Fig. 5 and Fig. 6, it can be concluded that there might be much EVs charging or the energy gap of EVs to reach maximum capacity in Bus 16 is higher than the EVs in Bus 4.
To reveal the validity of the tested model, Fig. 7 is demonstrated in which the power flows on the branches b7, b8, and b9 are shown. If the single line diagram of the distribution system is considered, the power flow on branch b7 is expected to be equal to the summation of the power flow on branch b8 and b9 because of the radial extension of b7. It is obviously seen from the figure that the power flow on b7 is equal to the summation of powers b8 and b9 for each time period of the day. Figure 8 demonstrates the variation of the power consumption profile in Bus 4 after EVs are included in the system. The objective of minimizing the total number of CSs also has a positive impact on shifting the power demand to the valley of the power curve, as seen
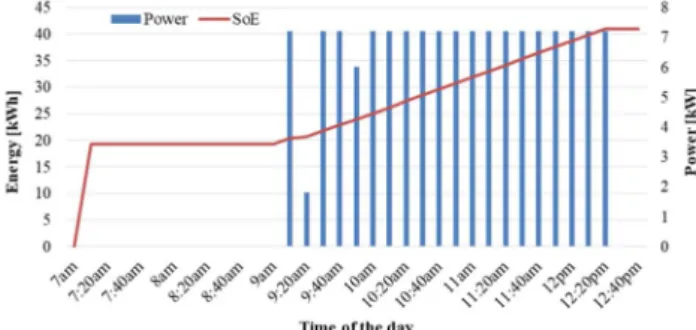
in the figure. Also, Fig. 9 displays the SoE variation of an EV during the charging process at the CS located in Bus 18. The charging process of the EV is not started as soon as it comes since it is waited for a CS to be available. Finally, the battery of that EV reached its maximum capacity before the departure time.
Fig. 5. The power demand profile of Bus 4.
Fig. 6. The power demand profile of Bus 16.
Fig. 8. The change of power consumption in Bus 4 after EVs included.
Fig. 9. The SoE variation of an EV with respect to charging power.
IV
.
CONCLUSIONIn this study, optimal dimensioning and locating of the EVCSs were investigated in a distribution system via a MILP framework. The total CS number minimization oriented study under network and EV demand constraints provided a new approach compared to competitive existing studies to the best knowledge of the Authors. Moreover, the devised model was tested in a real distribution system model. The power flow among the regions was taken into consideration by using a linear approximation. Also, other loads fed by transformers in the distribution system were measured, and considered during the simulations. To sum up, the use of the devised model can prevent unnecessary high investment costs for CSs. Moreover, the different models of EVs and the different CS types based on their charging capacity can be taken into account in an extended version of this work.
ACKNOWLEDGMENT
This work was supported by Energy Market Regulatory Authority of Turkey (EPDK) R&D Funds (project “The Investigation of the Effects of Electric Vehicles and Charging Stations on Power Grid and Development of Required National Software to Optimize These Loads”) and The Scientific and Technological Research Council of Turkey (TUBITAK) under project Grant No.119E215.
REFERENCES
[1] IEA Outlook, “Global EV outlook - scaling up the transition to electric mobility,” Paris, France, 2019.
[2] L. Rubino, C. Capasso, and O. Veneri, “Review on plug-in electric vehicle charging architectures integrated with distributed energy sources for sustainable mobility,” Applied Energy, vol. 207, pp. 438-464, Dec. 2017.
[3] J. Yang, J. Dong, and L. Hu, “A data-driven optimization-based approach for siting and sizing of electric taxi charging stations,” Transportation Research Part C: Emerging Technologies, vol. 77, pp. 462-477, April 2017.
[4] X. Ren, H. Zhang, R. Hu, and Y. Qiu, “Location of electric vehicle charging stations: A perspective using the grey decision-making model,” Energy, vol. 173, pp. 548-553, April 2019.
[5] A. Awasthi, K. Venkitusamy, S. Padmanaban, R. Selvamuthukumaran, F. Blaabjerg, and A. K. Singh, “Optimal planning of electric vehicle charging station at the distribution system using hybrid optimization algorithm,” Energy, vol. 133, pp.70-78, Aug. 2017.
[6] X. Dong, Y. Mu, H. Jia, J. Wu, and X. Yu, “Planning of fast EV charging stations on a round freeway,” IEEE Trans. Sustainable Energy, vol. 7, pp. 1452-1461, Oct. 2016.
[7] X. Wang, C. Yuen, N. U. Hassan, N. An, and W. Wu, “Electric vehicle charging station placement for urban public bus systems,” IEEE Trans. Intelligent Transportation Systems, vol. 18, pp. 128-139, Jan. 2017.
[8] H. Zhang, S. J. Moura, Z. Hu, and Y. Song, “PEV fast-charging station siting and sizing on coupled transportation and power networks,” IEEE Trans. Smart Grid, vol. 9, pp. 2595-2605, July 2018. [9] J. Ma, and L. Zhang, “A deploying method for predicting the size and optimizing the location of an electric vehicle charging stations,” Information, vol. 9, pp. 1-19, Sept. 2018.
[10] Q. Yang, S. Sun, S. Deng, Q. Zhao, and M. Zhou, “Optimal sizing of PEV fast charging stations with Markovian demand characterization,” IEEE Trans. Smart Grid, vol. 10, pp. 4457-4466, July 2019.
[11] G. Napoli, A. Polimeni, S. Micari, L. Andaloro, and V. Antonucci, “Optimal allocation of electric vehicle charging stations in a highway network: Part 1. Methodology and test application,” Journal of Energy Storage, vol. 27, pp. 101102, Feb. 2020.
[12] N. Andrenacci, R. Ragona, and G. Valenti, “A demand-side approach to the optimal deployment of electric vehicle charging stations in metropolitan areas,” Applied Energy, vol. 182, pp. 39-46, Nov. 2016. [13] Y. Wang, J. Shi, R. Wang, Z. Liu, and L. Wang, “Siting and sizing of
fast charging stations in highway network with budget constraint,” Applied Energy, vol. 228, pp. 1255-1271, Oct. 2018.
[14] D. Q. Hung, Z. Y. Dong, and H. Trinh, “Determining the size of PHEV charging stations powered by commercial grid-integrated PV systems considering reactive power support,” Applied Energy, vol. 183, pp. 160-169, Dec. 2016.
[15] S. R. Gampa, K. Jasthi, P. Goli, D. Das, and R. C. Bansal, “Grasshopper optimization algorithm based two stage fuzzy multiobjective approach for optimum sizing and placement of distributed generations, shunt capacitors and electric vehicle charging stations,” Journal of Energy Storage, vol. 27, pp. 101117, Feb. 2020. [16] O. Erdinç, A. Taşcıkaraoǧlu, N. G. Paterakis, I. Dursun, M. C. Sinim,
and J. P. S. Catalão, “Comprehensive optimization model for sizing and siting of DG units, EV charging stations, and energy storage systems,” IEEE Trans. Smart Grid, vol. 9, pp. 3871-3882, July 2017. [17] M. Erbaş, M. Kabak, E. Özceylan, and C. Çetinkaya, “Optimal siting
of electric vehicle charging stations: A GIS-based fuzzy multi-criteria decision analysis,” Energy, vol. 163, pp. 1017-1031, Nov. 2018. [18] M. R. Mozafar, M. H. Moradi, and M. H. Amini, “A simultaneous
approach for optimal allocation of renewable energy sources and electric vehicle charging stations in smart grids based on improved GA-PSO algorithm,” Sustainable Cities and Society, vol. 32, pp. 627-637, July 2017.
[19] S. Hosseini, and M. D. Sarder, “Development of a Bayesian network model for optimal site selection of electric vehicle charging station,” Int. Journal of Electrical Power & Energy Systems, vol. 105, pp. 110-122, Feb. 2019.
[20] S. Wang, Z. Y. Dong, F. Luo, K. Meng, and Y. Zhang, “Stochastic collaborative planning of electric vehicle charging stations and power distribution system,” IEEE Trans. Industrial Informatics, vol. 14, pp. 321-331, Jan. 2017.
[21] M. R. Mozafar, M. H. Moradi, and M. H. Amini, “A simultaneous approach for optimal allocation of renewable energy sources and electric vehicle charging stations in smart grids based on improved GA-PSO algorithm,” Sustainable Cities and Society, vol. 32, pp. 627-637, July 2017.
[22] M. F. Shaaban, S. Mohamed, M. Ismail, K. A. Qaraqe, and E. Serpedin, “Joint planning of smart EV charging stations and DGs in eco-friendly remote hybrid microgrids,” IEEE Trans. Smart Grid, vol. 10, pp. 5819-5830, Sept. 2019.
![Fig. 1. Single line diagram of the evaluated distribution system. TABLE I. E LECTRICAL C HARACTERISTICS OF THE EV Model Charging rate [kW] Charging Efficiency [%] Max](https://thumb-eu.123doks.com/thumbv2/9libnet/3846543.34719/4.892.74.426.159.501/diagram-evaluated-distribution-lectrical-haracteristics-charging-charging-efficiency.webp)