SMOKING AND NICOTINE ALTER UGT1A EXPRESSION
A THESIS SUBMITTED TO
THE DEPARTMENT OF MOLECULAR BIOLOGY AND GENETICS AND GRADUATE SCHOOL OF ENGINEERING AND SCIENCE OF
BILKENT UNIVERSITY
IN PARTIAL FULFILLMENT OF THE REQUIREMENTS FOR THE DEGREE OF MASTER OF SCIENCE
By Gizem ÖLMEZER August 2011
To my one and only sister,
III
ABSTRACT
SMOKING AND NICOTINE ALTER UGT1A EXPRESSION
Gizem ÖLMEZER
MSc. in Molecular Biology and Genetics Supervisor: Assist. Prof. Dr. Özlen KONU
August 2011
The expression and activity of enzymes taking role in drug metabolism are important as in the case of phase II glucuronidation enzymes; namely UDP-glucuronosyltransferases (UGTs). Previously, it has been identified that smoking upregulates the expression of UGT enzymes in oral mucosa. We asked whether smoking induces UGT1A expression in other tissues and re-analyzed publically available datasets run with samples from smokers and non-smokers. It was observed that UGT1A enzymes were overexpressed in several types of epithelial cells of smokers.
30% of nicotine metabolism is performed by UGT enzymes; however, whether UGT1A expression is modulated by nicotine, the addictive component of tobacco smoke, is not known. For this purpose, the expression levels of UGT1A isoforms were measured using Real-Time PCR in nicotine treated SW620 colorectal cancer cells. Our findings showed that nicotine’s effect on UGT1A expression was isoform specific; and the magnitude of modulation differed among isoforms. Furthermore, the upregulation of UGT1A enzymes could only be observed in serum-deprived SW620 cells. In summary, nicotine metabolism enzymes are regulated by both smoking in vivo and nicotine in vitro. Nevertheless, enhanced xenobiotic metabolism may result in chemoresistance, which is undesirable for cancer patients. Therefore, before drug therapy cancer patients might be analyzed in terms of their smoking status and UGT1A expression patterns.
Keywords: Nicotine, Smoking, UDP-glucuronosyltransferases (UGTs), Serum Starvation, Colon Cancer
ÖZ
SİGARA VE NİKOTİN UGT1A GEN İFADESİNİ
DEĞİŞTİRİYOR
Gizem ÖLMEZER
Moleküler Biyoloji ve Genetik Yüksek Lisansı Tez danışmanı: Yrd. Doç. Dr. Özlen KONU
August 2011
İlaç metabolizmasında görev alan genlerin ifade ve aktiviteleri, ilaçların etkilerini değerlendirmekte büyük önem taşır. UGT genleri faz II metabolizmasında yer alan enzimlerdir ve sağlıklı bireylerin ağız mukozasında sigara içimiyle ifadelerinin arttığı gösterilmiştir. Bu çalışmada, sigaranın UGT1A gen ifadeleri üzerindeki etkileri başka dokularda da geçerli midir sorusu sorulmuştur. Bu amaçla, GEO veritabanında yer alan mikrodizin çalışmaları tekrar analiz edilmiş ve UGT1A genlerinin birçok epitel dokuda sigara içimiyle arttığı gösterilmiştir.
Nikotin metabolizmasının %30’u UGT genleri tarafından yürütülmekte; fakat, gen düzenlenmesinde nikotinin rolü olup olmadığı bilinmemektedir. Bu amaçla UGT1A genlerinin ifadeleri izoform olarak mRNA seviyesinde ve Gerçek Zamanlı Polimeraz Zincir Reaksiyonu ile nikotin ile muamele edilmiş SW620 kolorektal kanser hücrelerinde tespit edilmiştir. Sonuçlar, UGT1A genlerinin serumdan uzak büyütülen SW620 hücrelerinde izoforma bağlı olarak nikotinle beraber arttığını ve bu artışın her izoformda farklı olduğunu göstermiştir. Özet olarak, sigara ve nikotin UGT1A gen ifadesini düzenlemektedir. Zenobiyotik metabolizmasının düzeni vücuda alınan her ilaca verilen cevabı etkilediği için, bu mekanizmaların anlaşılması büyük önem taşımaktadır. İlaç tedavisinden önce hastanın sigara alışkanlığı ve UGT1A izoform ifadesi özellikleri açısından analiz edilebillir.
V
ACKNOWLEDGEMENTS
I would like to convey my thanks to Assist. Prof. Dr.Özlen Konu for her supervision and extensive knowledge in bioinformatics. I am also thankful to her because she set a priority as me learning as much as I can.
I would like to thank Assist. Prof. Dr. Ali Osmay Güre, who has supported me since the first day I stepped into Bilkent University. I would like to thank Assist. Prof. Dr. Michelle Adams for her valuable comments on the thesis. I would also like to thank Assist. Prof. Dr.İhsan Gürsel for his moral support at all times.
I am especially indebted to Ceren Sucularlı, Muammer Üçal from whom I learned a lot and had an invaluable time with. In addition, Ahmet Raşit Öztürk, Melike Öztürk and Onur Kaya never let me feel alone, which I am thankful for.
I would like to thank Nilüfer Sayar, without who this project cannot reach to this point. She tried her best to be there when I needed her and made my days precious. Gurbet Karahan, Sinem Özcan, Şükrü Atakan and Ece Akhan, who have been very special friends for me, are among those I would like to thank to, as well.
My special thanks are for my fiancee, İsmail Tanyeli and his family. They took me under their wings when all I needed was a shelter.
I am very grateful to my family, who raised me with unconditional love and respect. They supported me at every step I take and did their best for my education.
I would like to thank TÜBİTAK for supporting me with BIDEB-2210 scholarship during my M.Sc. research period.
TABLE OF CONTENTS
1. INTRODUCTION ... 1
1.1 Glucuronidation ... 1
1.2 UGT Superfamily ... 1
1.3 Regulation of UGT1A Gene Expression ... 2
1.4 Conservation of UGT Superfamily among Species ... 3
1.5 Tissue Specific Expression ... 4
1.6 Nicotine ... 8
1.7 Nicotine Metabolism ... 8
1.8 Real-Time PCR Analysis ... 9
1.9 SW620 Colon Adenocarcinoma Cell Line as a Model System ... 11
2. AIM OF THE STUDY ... 12
3. MATERIALS AND METHODS ... 15
3.1 Cell Line ... 15
3.2 Cell Preservation Protocols ... 15
3.3 Nicotine and Serum Starvation Treatment ... 15
3.4 Total RNA Isolation ... 16
3.5 SW620 Nicotine Treatment Microarray Experiment ... 16
3.6 Microarray Analysis Methods ... 16
3.7 Re-analysis of Public Datasets for UGT1A probesets ... 17
3.8 Statistical Analysis and Plots of GEO Expression Values using GraphPad 18 3.9 cDNA synthesis ... 19
VII
3.10 Validation of Microarray Analysis with qRT-PCR ... 19
3.10.1 Oligonucleotides: ... 19
3.10.2 Quantitative Real-time PCR ... 21
3.10.3 ANOVA Analysis of UGT1A isoforms from qRT-PCR ... 22
3.11 General Solution Recipes ... 22
4. RESULTS ... 23
4.1 Re-analysis Microarray Datasets with Smoker Status from GEO ... 23
4.2 Statistical analysis of UGT1A probesets from SW620 Nicotine Treatment Experiment ... 55
4.3 Microarray Validation by qRT-PCR ... 58
4.3.1 Melt Curve Analysis ... 58
4.3.2 Primer Efficiencies ... 60
4.3.3 Selection of a Reference Gene for Nicotine Treatment of Starved Cells 62 4.3.4 qRT-PCR results as analyzed by the modified delta-delta-ct method . 63 4.4 in silico Promoter Analysis of UGT1A isoforms ... 69
5. CONCLUSION AND DISCUSSION ... 72
6. FUTURE PERSPECTIVES ... 92
LIST OF FIGURES
Figure 1.1 Genomic organization of human UGT1A locus on chromosome 2. The red boxes indicate phenol-type UGT1A variable exons while purple boxes
demonstrate bilirubin-type UGT1A variable exons. Constant exons are shown as white boxes. ... 2
Figure 4.1 UGT1A expression in large airway epithelium of smokers and non-smokers according to GSE4635 array (* p<0.05,**p<0.001). Results were given as geometric mean ± SD. ... 25
Figure 4.2 UGT1A8-1A9 expression in large airway epithelium of smokers and non-smokers according to GSE4635 array (* p<0.05,**p<0.001). Results were given as geometric mean ± SD. ... 25
Figure 4.3 UGT1A expression in small airway epithelium of smokers and non-smokers according to GSE4498 (* p<0.05,**p<0.001). Results were given as
geometric mean ± SD. ... 27
Figure 4.4 UGT1A6 (232654_s_at), UGT1A8 and 1A9 (221305_s_at) expression in small airway epithelium of smokers and non-smokers according to GSE4498
(*p<0.05, **p<0.001). Results were given as geometric mean ± SD. ... 28
Figure 4.5 UGT1A expression in small airway epithelium of smokers and non-smokers according to GSE10006 (* p<0.05,**p<0.001). Results were given as geometric mean ± SD. ... 30
Figure 4.6 UGT1A6 (232654_s_at), UGT1A8 and 1A9 (221305_s_at) expression in airway epithelium of smokers and non-smokers according to GSE10006 (* p<0.05, **p<0.001). Results were given as geometric mean ± SD. ... 31
Figure 4.7 UGT1A expression in oral mucosa of smokers and non-smokers according to GSE17913 (* p<0.05,**p<0.001). Results were given as geometric mean ± SD. ... 32
Figure 4.8 UGT1A6 (232654_s_at), UGT1A8 and 1A9 (221305_s_at) expression in oral mucosa of smokers and non-smokers according to GSE17913 (* p<0.05,
IX
Figure 4.9 UGT1A expression in oral mucosa of smokers and non-smokers according to GSE16149 (* p<0.05,**p<0.001). Results were given as geometric mean ± SD. ... 35
Figure 4.10 UGT1A6 (232654_s_at), UGT1A8 and 1A9 (221305_s_at) expression in oral mucosa of smokers and non-smokers according to GSE16149 (*
p<0.05,**p<0.001). Results were given as geometric mean ± SD. ... 35
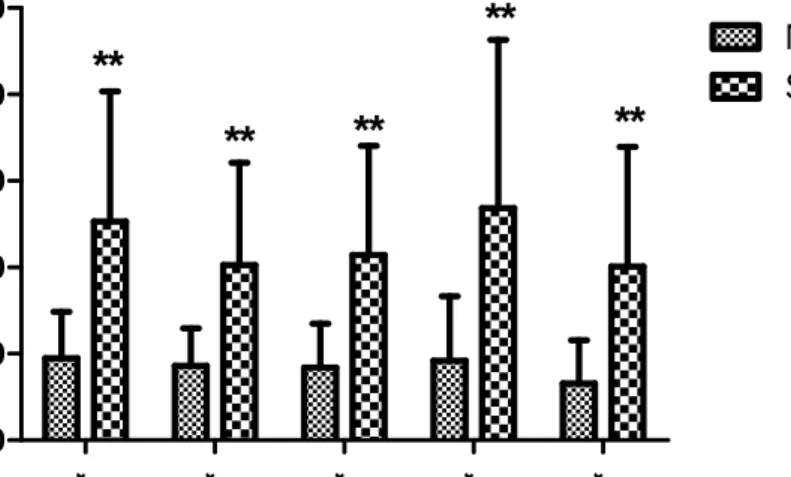
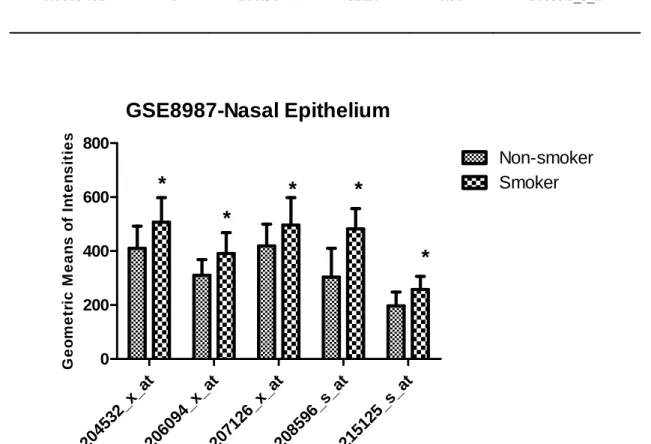
Figure 4.11 UGT1A expression in nasal epithelium of smokers and non-smokers according to GSE8987 (* p<0.05,**p<0.001). Results were given as geometric mean ± SD. ... 37
Figure 4.12 UGT1A8 and 1A9 (221305_s_at) expression in nasal epithelium of smokers and non-smokers according to GSE8987 (* p<0.05,**p<0.001). Results were given as geometric mean ± SD. ... 37
Figure 4.13 UGT1A expression in buccal epithelium of smokers and non-smokers according to GSE8987 (* p<0.05,**p<0.001). Results were given as geometric mean ± SD. ... 38
Figure 4.14 UGT1A8 and 1A9 (221305_s_at) expression in buccal epithelium of smokers and non-smokers according to GSE8987 (* p<0.05,**p<0.001). Results were given as geometric mean ± SD. ... 39
Figure 4.15 UGT1A expression in airway epithelium of smokers and non-smokers according to GSE7895 (* p<0.05,**p<0.001). Results were given as geometric mean ± SD. ... 41
Figure 4.16 UGT1A8 and 1A9 (221305_s_at) expression in airway epithelium of smokers and non-smokers according to GSE8987 (* p<0.05,**p<0.001). Results were given as geometric mean ± SD. ... 42
Figure 4.17 UGT1A expression in airway epithelium of current, former and non-smokers according to GSE7895 (* p<0.05,**p<0.001). Results were given as
Figure 4.18 UGT1A8 and 1A9 (221305_s_at) expression in airway epithelium of current, former and never smokers according to GSE8987 (* p<0.05,**p<0.001). Results were given as geometric mean ± SD. ... 44
Figure 4.19 UGT1A expression in airway epithelium of smokers and non-smokers according to GSE994 (* p<0.05,**p<0.001). Results were given as geometric mean ± SD. ... 46
Figure 4.20 UGT1A8 and 1A9 (221305_s_at) expression in airway epithelium of smokers and non-smokers according to GSE994 (* p<0.05,**p<0.001). Results were given as geometric mean ± SD. ... 46
Figure 4.21 UGT1A expression in airway epithelium of current, former and never smokers according to GSE994 (* p<0.05,**p<0.001). Results were given as
geometric mean ± SD. ... 48
Figure 4.22 UGT1A8 and 1A9 (221305_s_at) expression in airway epithelium of current, former and never smokers according to GSE994 (* p<0.05,**p<0.001). Results were given as geometric mean ± SD. ... 48
Figure 4.23 UGT1A expression in airway epithelium of healthy current, former and non-smoker according to GSE19027 (* p<0.05,**p<0.001). Results were given as geometric mean ± SD. ... 51
Figure 4.24 UGT1A8 and 1A9 (221305_s_at) expression in airway epithelium of healthy current, former and never smokers according to GSE19027 (* p<0.05,
**p<0.001). Results were given as geometric mean ± SD. ... 51
Figure 4.25 UGT1A expression in airway epithelium of current and former smokers with lung cancer according to GSE19027 (* p<0.05,**p<0.001). Results were given as geometric mean ± SD. ... 53
Figure 4.26 UGT1A8 and 1A9 (221305_s_at) expression in airway epithelium of current and former smokers with lung cancer according to GSE19027 (* p<0.05, **p<0.001). Results were given as geometric mean ± SD. ... 53
XI
Figure 4.28Treeview image of UGT1A probesets in 48h nicotine-control treatment in SW620 experiment (p<0.001). Green and red colors indicate a reduction and induction of expression, respectively, when each gene is normalized to its median. 58
Figure 4.29 A demonstration melt curve belonging to samples that all pass the inclusion criteria. Blue curves indicate the samples while red curve belongs to
negative control. ... 59
Figure 4.30 Arrows indicate the samples to be excluded for analysis in a
demonstration gel photo. ... 60
Figure 4.31 Arrows indicate the samples to be excluded for analysis in a
demonstration gel photo. ... 60
Figure 4.32 Expression values of GAPDH, PPIA, RPL3, RPL10, RPLP0 in serum starved SW620 cells. Results were given as Ct values and asteriks indicated
significance at p<0.05 level. ... 63
Figure 4.33 Analysis of cell proliferation in Nicotine-treated SW620 cells in
10%FBS media via Quantitative RT-PCR of MKI67 levels. ... 64
Figure 4.34 Analysis of cell proliferation in Nicotine-treated SW620 cells in
10%FBS media via Quantitative RT-PCR of ANLN levels. ... 64
Figure 4.35 Analysis of cell proliferation in Nicotine-treated SW620 cells in
0.1%FBS media via quantitative RT-PCR of ANLN and MKI67 levels. Results were given as mean ± SD (DF=5, F-value= 541.41, p<0.001 for ANLN, DF=5, F
value=79.91, p<0.001 for MKI67). ... 65
Figure 4.36 The expression levels of UGT1A isoforms normalized to GAPDH mRNA levels. Results were given as mean ± SD. (*indicates the significance
corrected with Benferroni) ... 67
Figure 4.37 The expression levels of UGT1A isoforms normalized to GAPDH mRNA levels. Results were given as mean ± SD. ... 68
Figure 4.38 The expression level of UGT1A6 normalized to GAPDH mRNA levels in SW620 cells grown with 10%FBS-containing medium. ... 69
Figure 4.39 Alignment based on promoter region (300nt upstream) and Exon 1 of each UGT1A isofom ... 70
Figure 4.40 Alignment based on promoter region (300nt upstream) of each UGT1A isofom. Pink box indicates the genes that are upregulated with nicotine
administration while grey box displayed the ones without change in gene expression. ... 70
XIII
LIST OF TABLES
Table 3. 1 The oligonucleotides used for UGT1A expression analysis. Adapted from Nakamura et al. (2008) 20. ... 19
Table 3.2 The oligonucleotides used as reference genes in SW620 cells…………..20 Table 3.3 The oligonucleotides used for the analysis of proliferative capacity in SW620 cells………21 Table 4.1 The geometric mean of intensities corresponding to common UGT1A probesets in GSE4635 array (p<0.05). ... 24
Table 4.2 The geometric mean of intensities corresponding to common UGT1A probesets in small airway bronchial epithelial cells from GSE4498 (p<0.05). ... 26
Table 4.3 The geometric mean of intensities corresponding to UGT1A6 probeset in GSE4498 (p<0.05) ... 27
Table 4.4 The geometric mean of intensities corresponding to UGT1A8 and 1A9 probeset in GSE4498 (p<0.05) ... 28
Table 4.5 The geometric mean of intensities corresponding to common UGT1A probesets in GSE10006 (p<0.05). ... 29
Table 4.6 The geometric mean of intensities corresponding to UGT1A6 probeset in GSE10006 (p<0.05) ... 30
Table 4.7 The geometric mean of intensities corresponding to UGT1A8-1A9
probeset in GSE10006 (p<0.05) ... 30
Table 4.8 The geometric mean of intensities corresponding to common UGT1A probesets in GSE17913 (p<0.05). ... 32
Table 4.9 The geometric mean of intensities corresponding to UGT1A8-1A9
probeset in GSE17913 (p<0.05) ... 33
Table 4.10 The geometric mean of intensities corresponding to common UGT1A probesets in GSE16149 (p<0.05) ... 34
Table 4.11 The geometric mean of intensities corresponding to common UGT1A probesets in GSE8987 (p<0.05). ... 36
Table 4.12 The geometric mean of intensities corresponding to common UGT1A probesets in GSE7895 (p<0.05) ... 40
Table 4.13 The geometric mean of intensities corresponding to UGT1A8-1A9
probeset in GSE7895 (p<0.05) ... 41
Table 4.14 The geometric mean of intensities corresponding to common UGT1A probesets in GSE7895 (p<0.05) ... 43
Table 4.15 The geometric mean of intensities corresponding to UGT1A8-1A9
probeset in GSE7895 (p<0.05) ... 44
Table 4.16 The geometric mean of intensities corresponding to common UGT1A probesets in GSE994 (p<0.05). ... 45
Table 4.17 The geometric mean of intensities corresponding to common UGT1A probesets in GSE994 (p<0.05) ... 47
Table 4.18 The geometric mean of intensities corresponding to common UGT1A probesets in GSE19027 (p<0.05) ... 50
Table 4.19 The geometric mean of intensities corresponding to common probesets in GSE19027 (p<0.05) ... 52
Table 4.20 The geometric mean of intensities corresponding to common UGT1A probesets in serum starved and nicotine treated SW620 cells according to the
microarray performed in our lab ... 56
Table 4.21 The geometric mean of intensities corresponding to common UGT1A probesets in 48h Nicotine-treated SW620 cells according to the microarray
performed in our lab ... 56
Table 4.22 Efficiency values calculated for each primer couple with the same kit used. ... 61
XV
Table 5.2 Datasets utilizing samples from current, former and never smokers ... 77 Table 5.3 Datasets utilizing samples from cancer and healthy patients ... 78 Table 5.4 A dataset comparing heavy and light smokers ... 79
1.
INTRODUCTION
1.1 GlucuronidationIn order to maintain its stability and homeostasis, a cell must eliminate non-membrane associated substrates originating both endo- and exogenously. For this purpose, in mammals, many chemical defense pathways have evolved, one of which is glucuronidation 1. Glucuronidation is a process of conjugating glucuronic acid to the lipid-soluble toxics; this results in formation of water-soluble “glucuronides”, which, then, can be easily transported to excretory system. This crucial function has been performed by Endoplasmic Reticulum (ER) resident enzymes, UDP-glucuronosyltransferases (UGTs) 2.
UGT enzymes catalyze glucuronidation of a variety of detrimental substances for removal from the body. Among the lipid-soluble substrates of UGTs, there are bile acids, bilirubin, hormones, steroids, free fatty acids and xenobiotics such as therapeutic drugs, environmental pollutants, and carcinogens; including nicotine and tobacco smoke. Since almost all of the glucoronides generated are free of any biological activity in the body, the process of glucuronidation is regarded as an essential part of detoxification; responsible for the elimination of one-tenth of all drugs 3.As an example for emphasizing their necessity, genetic mutation of UGT1A1 isoform results in jaundice, a disease caused by increased levels of bilirubin in blood 4.
1.2 UGT Superfamily
In mammals, there are two UGT subfamilies that belong to UGT Superfamily: UGT1A, located on chromosome 2q37 5 and UGT2, found on chromosome 4q13 6. There are 50% sequence similarity among the proteins encoded by these two families while the similarity in enzymes belonging to each family reaches up to 60% 7.
Human UGT1A locus contains 9 functional genes, spanning a region of 200kb (Figure 1.1). Each gene has a variable Exon 1 while sharing the remaining four exons, Exons 2-5 8. These variable exons are positioned tandemly in the genome and are followed by the common exons.
Figure 1. red boxe demonstra white box Based on groups; na bilirubin-t Constant terminal, proteins 8, end (260 a specifying substrate s UGT2 su functional UGT2B15 this subfam 1.3 Re What is st multiple preceding has firstly in a cell-sp can be na specific g 1 Genomic s indicate ate bilirubin es. the sequenc amely, phen type group w exon of U comprising ,10. On the amino acids g their subs specificity i ubfamily, o l proteins; n 5, UGT2B1 mily. egulation o triking abou exon casse a number o y been ident pecific man amed as an gene expres organizatio phenol-typ n-type UGT ce similarity nol-type and while pheno GT1A fam the UDP-b other hand s) is encode strates 11-12. is not reveal n the othe namely, UG 7, and UG of UGT1A G ut genomic ettes tande of constant tified in gen nner 14. Com n alternativ ssion. Inde 2 on of huma pe UGT1A T1A variab y in Exon I d bilirubin t ol-type grou mily (Exon binding dom d, aglycone-ed uniquely Neverthele led yet. er hand, be GT2A1, UG GT2B28 13. Gene Expr organizatio emly locate exons 8. Th ne family of mbining diff ve splicing ed, it is lo an UGT1A A variable ble exons. C , UGT1A s type UGT1A up involves 2-5) encod mains, whic -binding do by each UG ess, the exa
ears multip GT2B4, UG Six exons ression n of UGT1A ed and tha he phenome f neural pro fferent exon event, whi ogical to th locus on c exons wh Constant ex superfamily A exons. UG UGT1A7-1 des 245 am ch are ident omain found GT1A isofo act principl ple gene lo GT2B7, UG comprise a A gene clus at show s non of mult otocadherin ns with the s ich promot hink that g chromosome hile purple xons are sh is divided GT1A1-5 b 10 9. mino acids a tical in all d at the N-orm, suggest les determin oci and en T2B10, UG functional ster is that t sequence si tiple variab ns (Pcdh), ex same exon c tes tissue a genes expre e 2. The e boxes hown as into two belong to at the C UGT1A -terminal ted to be ning the ncodes 8 GT2B11, gene in there are imilarity ble exons xpressed cassettes and cell-essed in
mammalian central nervous system, which is a quite sophisticated network, may require such a genomic organization to be differentially expressed in a cell and developmental-stage specific manner.
Zhang et al. (2004)14 has conducted a genome-wide research for the determination of gene clusters with similar genomic organization, bringing up UDP glucuronosyltransferases (UGT1), plectin, neuronal nitric oxide synthase (NOS1), and glucocorticoid receptor (GR) gene clusters with more than 10 alternative exons.
In UGT1A gene cluster, each variable exon shares common motifs in their coding areas 15 while regulatory regions at 5’end diverge from each other. Accordingly, Tukey and Strassburg (2000)16 has proposed that formation of functional UGT1A isoforms requires the binding of RNA Polymerase II to the corresponding promoter regions located at 5’flanking sequence of each variable Exon I. Then, each Exon I is independently spliced into the upcoming constant exon, generating a distinct UGT1A isoform. Indeed, Zhang et al. has shown the presence of CpG islands at 5’ends of each exon 14.
According to this, Zhang et al. (2004)14 speculates that alternating promoters of individual Exon 1 of UGT1A1 isoforms make the generation of divergent isoforms possible. In addition, independent promoter activation of each exon enables the cell to respond to different environmental and homeostatic stimuli. Moreover, each Exon 1, having a distinct regulatory region, may change the stability of the corresponding mRNA and affect its posttranscriptional modifications 14.
1.4 Conservation of UGT Superfamily among Species
To what extent the UGT genes are conserved is very well identified in a study by Zhang et al. (2004)14. A sequence analysis via VISTA shows that both the variable and common exons are highly conserved among human, mouse and rat UGT gene clusters 14. Nevertheless, no conservation of intergenic sequences could be observed, except the unique intronic region between Exon 1 and 2.
4
What is also conserved between mouse, human and rat is the unique genomic organization of the cluster. However, the number of the variable exons shows difference between the species.
The coding common exons of human UGT1 isoforms show 90% amino acid sequence similarity between three species, in addition to full similarity in length of the exons 14.
The classification of variable exons as bilirubin type and phenol type is also conserved in rat. In human, bilirubin type exons show an approximately 69% amino acid similarity while the sequence identity of amino acids is 73% in the phenol type exons 14.
In case of human UGT1A cluster, bilirubin type and phenol type exons appear to have duplicated from two variable exons. In addition, these ancestral exons are expected to have duplicated from the one common exon 14.
There is an extensive study focusing on Ugt superfamily in zebrafish 17. This study showed that there are three subfamilies in this species; namely, Ugt1, Ugt2 and Ugt5. Ugt1 and Ugt2 clusters have the same genomic organization as their counterparts in human: Each variable Exon 1 is independently conjugated with constant exons.
Phylogenetic comparisons in report of Huang and Wu (2010)17 proposed that the ancestral Ugt1 and Ugt2 clusters have gone through a lineage-specific gene loss and duplication events resulting in “zebrafish” specific isozymes.
Ugt5 subfamily, on the other hand, is a novel subfamily appearing specifically in teleosts and amphibians. This novel cluster is thought to have formed by retrotransposition preceding gene duplication 17.
1.5 Tissue Specific Expression
As the main resort of detoxification in the body, UGTs are mainly expressed in liver 2,18. Nevertheless, there are certain UGT isoforms (UGT1A7, 1A8, 1A10) whose expression could only be detected in human gastrointestinal and kidney tissues as they contribute to drug metabolism, as well 19.
In addition, Nakamura et al. (2008)20 has precisely identified mRNA expression of UGT isoforms in human lung, bladder and steroid-related tissues in an isoform-specific manner. In addition, the same study has demonstrated the isoformic expression in certain human cancer cell lines, showing unexpected overexpression or suppression. Consequently, each isoform will be discussed in terms of expression independently, as follows:
1.5.1 UGT1A1
Formerly, UGT1A1 isoform was detected to be expressed in liver in high amounts 21. In addition, it was determined that it is expressed in other gastrointestinal organs; namely, bile ducts, small intestine, stomach and colon as well as kidney and testis 20,22-23.
Nakamura et al. (2008)20 has conducted a study where various human cancer cell lines were analyzed in terms of expression of the UGT1A isoforms. This study has additionally showed that 1A1 isoform was expressed in human liver cancer cell lines HepG2 and Huh7, and human colon cancer cell lines, Caco-2 and LS180, in high quantities. UGT1A1 expression was low in the human kidney cancer cell line HK-2.
Particularly interesting was that high amounts of UGT1A1 mRNA was detected also in human breast cancer cell line MCF-7, and human ovary cancer cell line OMC-3. In addition, 1A1 expression was present in low amounts in human breast cancer cell line MDA-MB-435, ovary carcinoma cell line, and human adrenocortical carcinoma cell line H295R even though it is not expressed in the normal adrenal gland tissue, or breast and ovary 20.
1.5.2 UGT1A3
The expression pattern of UGT1A3 is quite similar to that of UGT1A1 isoform. Both are expressed in detoxifying organs; such as, liver, small intestine, colon, bile ducts, stomach and bladder 8,24-25. Moreover, UGT1A3 was detected in the same cancer tissues as in UGT1A1 20. Nevertheless, expression of UGT1A3 is relatively lower, implying the possibility that UGT1A1 can compensate for UGT1A3.
6
1.5.3 UGT1A4
UGT1A4 is an isoform, expressed highly in many tissues. It is a hepatic isoform besides being expressed in colon and bile ducts 21,23. In addition, Kaivosaari et al. (2007) 26 encountered its slight expression in trachea, kidney and small intestine. Nakamura then added bladder and ovary into this list, as well 20.
In case of cancer cells, UGT1A4 also shows a similar expression to that of UGT1A1 20.
1.5.4 UGT1A5
This unique isoform is different from all others in that its expression could not be detected in most of the tissues for a long time 21,27. Then, in 2002, Collier et al.)28 has detected the mRNA transcripts of UGT1A5 in placenta. Afterwards, in 2005 Finel et
al.29 has proved the presence of a high interindividual variability as in the case of
UGT1A1, causing a discrepancy in the results. Moreover, Nakamura et al (2008)20 has shown its presence in gastrointestinal tract, kidney, bladder, and uterus and UGT1A5 was marginally detected in the other tissues, as well 20. However, it is important to note that it is not expressed in liver.
When it comes the carcinoma tissues analyzed in Nakamura’s study20, UGT1A5 was highly expressed in colon cancer cell line LS180, breast cancer cell lines MDA-MB-435 and MCF-7, and ovarian cancer cell line OMC-3 20.
1.5.5 UGT1A6
mRNA transcript of UGT1A6 isoform was detected in most of the detoxifying tissues analyzed. The normal tissues in which UGT1A6 is expressed can be given as: liver, stomach, biliary tissue, small intestine, colon, kidney and bladder 24,30.
In addition, UGT1A6 expression was found in liver cancer cell lines HepG2 and HuH7, renal carcinoma cell line HK-2, colon cancer cells Caco-2 and LS180 20. Furthermore, lung carcinoma cell line A549 has constitutive UGT1A6 expression 31. Interestingly, even though UGT1A6 is not expressed in normal steroid-related tissues, it is found in the carcinoma cell lines related with those tissues, such as,
adrenal carcinoma cell line H295R, breast carcinoma cell line MCF-7, uterus cancer cell line HeLa, adrenal gland carcinoma cell line Ishikawa, and ovarian cancer cell line OMC-3 20. This deregulated expression can stem from the fact that UGT1A6 expression is regulated by hormones and ligands activating pregnane X receptor (PXR) and constitutive androstone receptor (CAR) 31-32.
1.5.6 UGT1A7
The expression of UGT1A7 isoform can be defined as extrahepatic. In more detail, UGT1A7 was identified in esophagus 27 and stomach 22.
In addition, it is stated that UGT1A7 is not expressed in colon in the reports of Strassburg et al. (1999) 27. Nakamura et al.(2008)20, on the other hand, additionally detected the presence UGT1A7 isoform in colon as well as small intestine, kidney and bladder 20.
The cancer cells in which UGT1A7 expression was observed are as follows: liver cancer cell line HuH7, renal carcinoma cell line HK-2, colon cancer cells Caco-2 and LS180, breast carcinoma cell line MCF-7, ovarian cancer cell line OMC-3 20.
1.5.7 UGT1A8
UGT1A8 is again an extrahepatic isoform 16,33 but it is expressed in the small intestine, colon, kidney, bladder and trachea 20,34. Its expression was found in jejunum and ileum, as well 33. Additionally, it was identified in esophagus 27. Moreover, the cancer cells showing high expression of UGT1A8 are LS180, H295R, MDA-MB-435, MCF-7, and OMC-3 cells 20.
1.5.8 UGT1A9
Even though UGT1A9 belongs to the group of phenol-type UGT1A isoforms, members of which are not expressed in liver, this isoform shows a high expression in liver 10.In addition, colon is a tissue with UGT1A9 expression 21. Additionally, it is expressed in esophagus 27. However, where UGT1A9 abundantly expressed besides liver is kidney 35. Expectedly, the carcinoma cell line with UGT1A9 expression is Hk-2 cells, derived from kidney 20.
8
Ohno and Nakajin (2009)34claim that mRNA of UGT1A9 is also present in adrenal glands, small intestine, and colon; while Nakamura et al. (2008)20 adds to this list, bladder and testes 20,34.
1.5.9 UGT1A10
Initially, UGT1A10 isoform was identified in certain members of gastrointestinal tract; such as, stomach, intestine and colon, in addition in biliary epithelium, but not in liver 21,36-37. Then, it also was found in esophagus 27.
The expression of UGT1A10 was recently found in liver, kidney, ovary, and uterus even though it is extremely low 20.
UGT1A10 was found to be highly expressed in LS180 and MCF-7 cells, in addition to H295R, MDAMB-435, HuH7, and OMC-3 cells 20.
1.6 Nicotine
Nicotine is a pyridine alkaloid. When administered, it increases the dopamine levels in the brain, triggering an addiction 38. Possessing this ability, it is defined as the addictive compound in cigarettes.
Nicotine is absorbed from the alveoli of lungs very rapidly and at the cessation of smoking, the blood concentrations of nicotine reaches to its highest level 39-40. Total nicotine clearance from body takes approximately 2 hours.
1.7 Nicotine Metabolism
Nicotine removal from body is mainly carried out in liver by the enzymes, CYP2A6, UDP-glucuronosyltransferases (UGT), and flavin-containing monooxygenase 3 (FMO3) 38.
In mammals, most of nicotine (approximately 75%) is metabolized to cotinine by the action of CYP2A6. Moreover, cotinine is further metabolized to trans-3′-hydroxycotinine (3HC) and less-harmful side-products again by the oxidation reactions catalyzed by CYP2A6 enzymes 41.
Additionally, nicotine is metabolized by UGT enzymes, which constitutes 3-5% of nicotine metabolism. This reaction generates an N-quaternary glucuronide and enables its excretion through urinary system. In addition, other major metabolites of nicotine, which are cotinine and trans-3′-hydroxycotinine (3HC), are subjected to glucuronidation by UGTs, as well. Overall, 31% of all nicotine metabolites found in urine are composed of phase II glucuronidated compounds depending on the activity of ER-resident UGT enzymes 42. Eventually, the glucuronidated nicotine metabolites are removed from the body by urinary system. 8-10% of nicotine administered remains as unchanged and excreted in urine, as well.
Among the UGT1A isoforms, a potential role for the isoforms UGT1A4 and 1A9 has been suggesting for the glucuronidation of nicotine and its abundant metabolite, Cotinine in vitro 43.
1.8 Real-Time PCR Analysis
Each gene has its own unique pattern of expression, varying from cell to cell or as a response to differing physiological conditions 44. It is of importance to analyze the gene expressions in molecular biology; for example, when assessing the response of cells to external/internal stimuli, to different developmental stages or for diagnostic purposes 44.
Reverse Transcription of whole cellular mRNA content, followed by PCR has been a robust and reliable technique for gene expression analyses since 1993 45. In addition, the advent of Real-Time PCR enhanced this protocol and enabled collection of data during amplification by means of fluorescence emission 46.
PCR reaction can be divided into four distinct stages 47-48. Firstly, linear ground stage takes place in which PCR starts and fluorescence emission is not high enough to be detected. This is followed by the stage at which exponential amplification takes place and fluorescence emission exceeds a certain threshold cycle (also known as Ct). The threshold cycle enables us to determine the amount of starting DNA template since the more the template, the sooner the Ct is reached 49. The third stage is when log-linear amplification of the products occurs and a steep increase in fluorescence is
10
observed. Eventually, reaction components become scarce, exponential accumulation of the products cease and a plateau phase is reached.
In order to collect data during amplification, there are two well-established methods used, i.e., gene-specific probes and double strand-binding agents 50. Probe-based systems rely on the 5’-3’ nuclease activity of Taq polymerase and after they recognize and bind their target on the single strand, polymerase causes their hydrolysis during elongation and a consequent fluorescence emission 46.
DNA binding dyes are used based on their ability to emit fluorescence when they intercalate with double strand DNA. As the amplicons accumulate, fluorescence intensity is increased proportionally 51. Generally, SYBR Green or Ethidium Bromide is preferred for this purpose 52. In cases when sequence specific, intron-spanning primer couples are used, SYBR Green has been shown to work quite efficiently 45. However, since these dyes fail to specifically recognize the target amplicons, the false positive rate might be high 53. In order to prevent this, PCR products should be run on gel 54 and dissociation curves should be checked whether there are unrelated melting peaks 55.
Real-time PCR data can be given in several reporting methods, including absolute quantification and relative quantification. Absolute quantification reports the results by relating Ct values with input copy number linearly via a calibration curve. The calibration curves are plotted using known concentrations of DNA, e.g., recombinant DNA, genomic DNA or RT-PCR product 56. This method is based on the assumption that all standards and samples bear approximately equal efficiencies 57.
Relative quantification, on the other hand, as the name implies, presents the gene expression levels relative to an internal standard 58. The internal references are generally house-keeping/reference genes, which show steady-state expression in all samples 45. There are numerous mathematical methods designed to assess the relative expression of genes to an endogenous reference. An established mathematical model is presented in the paper of Pfaffl et al. (2001)59. This method calculates the gene expressions as a relative fold change between target genes and reference, including the efficiency values of each primer. The fold change is calculated as follows:
Fold change = (Etarget) ΔCtTarget (control-sample)/ (Ereference) ΔCtReference (control-sample)
Here, the formula assumes that Ct value of the reference gene does not show deviation among control and sample; thus, ΔCtReference is set as 0. The formula requires an efficiency value for each primer couple together with the enzyme used. Ideally, the amplification efficiency in each reaction is assumed to be 1, implying that the amplicon concentration doubles itself in each cycle at log phase 60. Nevertheless, in actuality, every reaction has its own efficiency value and the failure in calculating that may overestimate the results 61.
In order to calculate the efficiency of the primers, a widely used formula is as follows:
E=Magnitude of dilution [-1/slope of the dilution curve]
The slopes are derived from the calibration curve that is plotted against serially diluted samples and the corresponding Ct values run with the same enzyme and primer couple. Eventually, the statistical significance of the results should be determined by standard parametric tests; such as ANOVA and t-tests 62.
1.9 SW620 Colon Adenocarcinoma Cell Line as a Model System
SW620 colon adenocarcinoma cell line is a metastatic form of a primary adenocarcinoma cell line SW480, which was initially isolated from a 51-year old Caucasian male 63. Within a year, a metastasis was observed from the colon to abdomens and SW620 cell line was isolated from a lymph node. SW620 cells were shown to be highly tumorigenic when injected to nude mice 64.
This cell line is a good model for studying UGT1A expression since colon is the second organ where UGTs are expressed most. In addition, there is a study displaying that Pregnane X Receptor (PXR), a UGT1A expression regulator, responds to the drug irinotecan in SW620 cells 65. Irinotecan is a widely used drug in treatments of colon cancer. When SW620 cells are treated with irinotecan, the expression of PXR as well as UGT1A1, UGT1A9 and UGT1A10 are upregulated. Thus, SW620 establishes a good model for analyzing the effect of nicotine on colon cancer cells in terms of UGT1A expression.
12
2.
AIM OF THE STUDY
Chemical defense pathways are evolved to protect cells from toxic xenobiotics. It is especially of critical importance in organs exposed to xenobiotics most. There are two detoxification routes for biochemical modification of the compounds, namely, phase I drug metabolism involving oxidation/reduction and hydrolysis reactions and phase II drug metabolism indicating conjugation 2. Glucuronidation, as a phase II drug metabolic pathway, is responsible for conjugating glucuronic acid to its numerous lipophilic substrates, converting them into hydrophilic molecules. In cell, glucuronidation is predominantly catalyzed by a family of UDP-glucosyltransferases (UGTs) 2,66-68. UGTs take a central role in elimination of one tenth of all drugs 3. That’s why it is important to understand how their expression changes in response to which drug.
Each year, over 1 million people are expected to develop colorectal cancer 69. In addition to genetic factors, the life style of the individual affects the possibility of the advent of the disease 70. Colon acts as the primary barrier that initially and directly contacts with the any toxic and carcinogenic compound that we are daily exposed to in our lives (by smoking, food, medication, etc.). That’s why; colonic cells should bear effective defense pathways against them, including glucuronidation.
Liver is classified as the main resort for the elimination of toxic substances in the body, originating either endo- or exogenously 2,18. Nevertheless, the metabolism of a drug, when administered orally, starts at the epithelial cells of the gastrointestinal (GI) tract, which is called first-pass metabolism 71. The epithelial cells lining the GI tract possess their own metabolic pathways and start the metabolizing reactions during absorption of the chemical. Among the organs, contributing both to absorption and detoxification of the drugs are skin, intestine, oral and nasal epithelium, as well as lung and kidney 72. When the compound reaches to liver, its extensive metabolism begins and then, it joins to systemic circulation of the body so that it can exert its biological activity on target tissue.
In mammals, there are two subfamilies of UGT Superfamily, each located on a different chromosome. In this study, however, we focused on merely the expression
of UGT1A family since these enzymes are primarily involved in the metabolism of xenobiotics while UGT2 family is mostly responsible for the metabolism of endogenous compounds 70.
UGT genes are mainly expressed in liver in an isoform-specific manner 20. It is documented that 1A1, 1A3, 1A4, 1A6, 1A9 are the isoforms expressed abundantly in liver, taking roles in hepatic drug metabolism 3,73. However, there are studies showing that the other detoxifying organs with a different profile of UGT isoform expression can well catalyze glucuronidation of numerous drugs 74. To be more precise, UGT1A1, and UGT1A10 are expressed highly in intestine 34 while the primary tissues expressing 1A7 and 1A8 are members of GI tract 20. Kidney is the organ where UGT1A9 is expressed at most 34.
Nicotine is one of the most effective addictive compounds in tobacco 75. There have been numerous research studies ongoing regarding to effects of nicotine on cells. So far, it has been known that nicotine promotes the proliferation of tumor cells in vivo; however, a study showing that nicotine causes transformation of normal cells into tumor cells is absent 76.
Smoking has been related with many diseases, such as cardiovascular diseases as well as cancer. Smoking has been associated with UGT1A expression via changes in transcription factors 77. According to this study, smoking upregulates an oxidative stress response transcription factor Nrf2 and UGT1A4 and UGT1A6 are coordinately expressed with this regulator in small airway epithelia. This initial report initiated us to look at a more generalized set of microarray datasets that contain information on smoker and non-smokers to generalize the previous findings.
Tobacco smoke contains a multitude of chemicals one of which is nicotine. Nicotine is the addictive component in tobacco; and has additionally been associated with lung cancer previously. Nevertheless, the crosstalk between nicotine and colon cancer cells, especially SW620 cells, has not been elucidated in detail. Our previous studies showed that nicotine upregulates proliferation in SW620 cells when serum starved 78. Kaya (2009)78 has shown that nicotine increases survival of SW620 cells and a plethora of mRNA transcripts identified by microarrays were involved in this effect. Among the transcripts that are responsive to nicotine but not serum
14
replenishment are the probesets that belong to UGT1A isoforms. This prompted the present study for identification of isoform expression of UGT1A in SW620 cells under serum starvation.
The present thesis thus has the rationale of revealing the connection between UDP-glucuronosyltransferases with smoking in vivo and with nicotine in SW620 colon adenocarcinoma cells. The methods used for accomplishing these aims included microarray expression analysis of publically available datasets obtained from GEO and qRT-PCR studies of UGT1A isoforms using primers published in Nakamura et
al. (2008) 20.
For this purpose, there are certain questions that we build our experiments on as shown below:
- Does smoking upregulate UGT1A expression in vivo?
- What are potential reference genes for studying effects of nicotine on gene expression?
- Is there a change in expression of genes related with cell proliferation when SW620 cells are administered with 1µM Nicotine for 48h?
- Does 1µM Nicotine treatment for 48h upregulate UGT1A isoform expression when cells are grown under physiological serum levels (10%) or serum starved (0.1%)?
3.
MATERIALS AND METHODS
3.1 Cell LineThe cell line of interest, SW620 colon adenocarcinoma cell line, is supplied by American Type Culture Collection (ATCC; Manassas, USA) with an ATCC number of CCL-227. SW620 colon adenocarcinoma cells are derived from a 51 years-old male and are metastatic. This cell line is kindly presented by Assist. Prof. Dr. Sreeparna Banerjee, METU, Ankara.
3.2 Cell Preservation Protocols
The base medium for SW620 colon adenocarcinoma cells is formulated as DMEM (FG0415) (Biochrom AG, Berlin, Germany); added with 10% Fetal Bovine Serum (CH30160) (Hyclone, Logan, USA) and 1% Penicillin/Streptomycin mixture (SV30010) (Hyclone, Logan, USA).
Cells are grown as supplemented with 12-14mL of complete media in 75-T flasks (Greiner Bio One, Frickenhausen, Germany) in the 37oC incubator with 5% CO2. In three days interval, cells are passaged into new flasks as described in Kaya (2009) 78.
For cryopreservation, cells were detached with trypsinization and centrifuged. The pellet, then, is resuspended in freezing media (i.e., complete media supplemented with 5% (v/v) DMSO; Sigma-Aldrich, St. Louis, MO, U.S.A) and kept in liquid nitrogen tanks for long time storage. Cell culturing experiments for SW620 cells were performed by Onur Kaya 78.
3.3 Nicotine and Serum Starvation Treatment
To see the effects of nicotine treatment in cells grown in either complete media or serum deprived media, 1x10⁶ SW620 cells were seeded onto 75-T flasks. After 24h, in which cells attach on the surface, media were replaced with serum starved media (prepared as supplementing DMEM with 0.1%FBS and 1%Penicillin/Streptomycin solution) for induction of quiescence.
16
Quiescent cells were transferred to complete media with different concentrations of nicotine; namely, 10ηM, 100ηM, 1μM and 10μM for 48 hours 78.
Alternatively, another set of a condition was prepared by growing the cells either with complete media, complete media containing 1μM Nicotine, serum-deprived media (0.1%FBS containing media) or serum-deprived media including 1μM nicotine for 48 hours. Each condition was designed so that there are biological replicas. Nicotine and serum starvation treatments were performed by Onur Kaya 78.
3.4 Total RNA Isolation
Treated cells were collected from the flasks on the 2nd day of the treatments by cell scraper as dissolved in ice-cold 1X PBS solution. Following, cells were centrifuged at 1500rpm for 5 min at 4°C and the pellets are stored at -80°C till RNA isolation 78.
Total RNA isolation is carried out with Promega SV Total RNA isolation kit (Z3100) (Madison, USA) according to the manufacturer’s protocol. The RNA concentration was measured by NanoDrop ND-1000 spectrophotometer (Thermo Fisher Scientific, Wilmington, DE, USA). Total RNA was used for microarray analysis and cDNA synthesis. The integrity of the RNA samples for microarray analysis was assessed by Agilent 2100 Bioanalyzer (Agilent Technologies, Santa Clara, CA, USA). RNA isolation and quality controls were performed by Onur Kaya 78.
3.5 SW620 Nicotine Treatment Microarray Experiment
5μg RNA samples were hybridized with Affymetrix U133 plus 2 GeneChips 78. Amplification, labeling and hybridizations were performed at the Genomics Core Facility of Bilkent University by the facility technician under the supervision of Assoc. Prof. Dr. Işık Yuluğ according to manufacturer’s protocols.
3.6 Microarray Analysis Methods
BRB array tools has been chosen for data analysis of microarray results 79. Each .cel file was imported to Microsoft Office Excel as a BRB Project. During import of data, no specific filtering criteria were employed.
Normalization was carried out by justRMA Normalization option integrated in BRB-Array tools. No preferences or filters were used for normalization to be able to see whole data and see the big picture.
Class Comparison:
In order to set a table of differentially expressed genes versus corresponding intensities, unpaired-class comparison tool of BRB Array tools with a p-value of 0.05 was used. After annotating each array as either smoker or non-smoker, differentially expressed genes were explored by Class Comparison among these two groups. BRB-array tools make use of univariate parametric tests (t/F) to define differentially expressed genes among two groups. Class comparison analyses also provide a false discovery rate value (FDR). This allows multiple test correction for the probesets analyzed from microarray analyses.
Cluster and Treeview:
Clustering was carried out by Cluster 3.0 software program while the image was generated by Java TreeView software 80. For this purpose, differentially expressed genes among all the groups derived from unpaired-class comparison tool of BRB Array tools (with a P-value of 0.05) were uploaded on Cluster 3.0. Then, median gene and array centering was performed. Average linkage method was chosen and un-centered correlation coefficient was used.
3.7 Re-analysis of Public Datasets for UGT1A probesets
Publicly available datasets were gathered by searching through Gene Expression Omnibus (GEO) website and using “Smoke or smoking or Nicotine” as keywords81. In order to analyze as many datasets as possible, Affymetrix HG-U133A, HG-U133 plus 2 and HuGeneFL Human Full Length Arrays were collected.
According to Ensembl database, there are five probesets in Affymetrix HG-U133A and HG-U133 Plus 2 arrays that give hits on all UGT1A isoforms. These probesets are:
18
206094_x_at
207126_x_at
208596_s_at
215125_s_at
In addition, there is extra probeset in the same arrays matching with UGT1A8 and UGT1A9 genes. This probeset is 221305_s_at.
Also, there is a probeset that is assigned only to UGT1A6 isoform in addition to those given above; which is 232654_s_at. However, this probeset is present only in Affymetrix HG-133 plus 2 arrays.
Furthermore, in HuGeneFL Human Full Length array, there is only one probeset that recognizes all UGT1A isoforms; namely, J04093_s_at.
We have analyzed several microarray results obtained in [HG-U133_Plus_2] Affymetrix Human Genome U133 Plus 2.0 Array, [HG-U133A] Affymetrix Human Genome U133A Array or [Hu6800] Affymetrix Human Full Length HuGeneFL Array Table 5.1, Table 5.2, Table 5.3 and Table 5.4. To do so, we have used BRB-Array Tools as described above in Section 3.6. We have normalized the .cel data downloaded from the webpage of each array in GEO database with justRMA option of BRB Array tools. Each array was annotated as either smoker or non-smoker and a class comparison was done between these two groups as setting p value as 0.05. The results of each re-analysis were shown below labeled with GSE numbers and short explanation of the clinical sample.
3.8 Statistical Analysis and Plots of GEO Expression Values using GraphPad Initially, the normalized values for each probeset in a dataset were obtained as non-log values. The geometric mean and standard deviation of each group were calculated and uploaded to GraphPad (GraphPad Software, Inc.). This program plots bar graphs according to the mean and SD given. The statistical significance of alteration in probesets was assessed depending on the p-value and FDR-value determined by BRB-Array tools.
3.9 cDNA synthesis
cDNA synthesis was done with RevertAid First Strand cDNA synthesis kit (K1622) (MBI Fermentas, Ontario, Canada) according to manufacturers’ protocol.
3.10 Validation of Microarray Analysis with qRT-PCR
For quantitative Real-time PCR experiments, Maxima SYBR Green qPCR Master Mix (K0251) obtained from MBI Fermantas (Ontario, Canada) was used with Applied Biosystems 7500 Real-time PCR systems (California, USA).
3.10.1 Oligonucleotides:
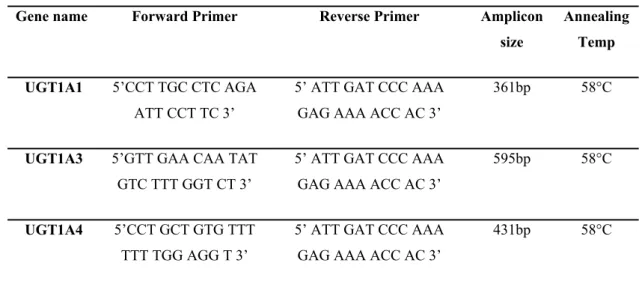
The oligonucleotides for qRT-PCR analysis of UGT1A isoforms were adapted from the study of Nakamura et al. (2008) 20 for comparability. They were synthesized by Iontek Inc. (Istanbul, Turkey). For all UGT1A primer couples, same reverse primer was used. Oligonucleotides to check for the proliferative capacity of SW620 cells treated with nicotine also were ordered from Iontek Inc. (Istanbul, Turkey). The oligo sequences of the primers, their expected amplicon size and annealing temperatures are shown on Table 3. 1,
,Table 3. and Table 3.3.
Table 3. 1 The oligonucleotides used for UGT1A expression analysis. Adapted from Nakamura et al. (2008) 20.
Gene name Forward Primer Reverse Primer Amplicon size
Annealing Temp UGT1A1 5’CCT TGC CTC AGA
ATT CCT TC 3’
5’ ATT GAT CCC AAA GAG AAA ACC AC 3’
361bp 58°C
UGT1A3 5’GTT GAA CAA TAT GTC TTT GGT CT 3’
5’ ATT GAT CCC AAA GAG AAA ACC AC 3’
595bp 58°C
UGT1A4 5’CCT GCT GTG TTT TTT TGG AGG T 3’
5’ ATT GAT CCC AAA GAG AAA ACC AC 3’
20 UGT1A5 5’TGT CCT ACC TTT
GCC ATG CTG 3’
5’ ATT GAT CCC AAA GAG AAA ACC AC 3’
274bp 58°C
UGT1A6 5’CAA CTG TAA GAA GAG GAA AGA C 3’
5’ ATT GAT CCC AAA GAG AAA ACC AC 3’
97bp 58°C
UGT1A7 5’CCC CTA TTT TTT CAA AAA TGTCTT 3’
5’ ATT GAT CCC AAA GAG AAA ACC AC 3’
261bp 58°C
UGT1A8 5’GGT CTT CGC CAG GGG AATAG 3’
5’ ATT GAT CCC AAA GAG AAA ACC AC 3’
423bp 58°C
UGT1A9 5’GAA CAT TTA TTA TGC CAC CG 3’
5’ ATT GAT CCC AAA GAG AAA ACC AC 3’
275bp 58°C
UGT1A10 5’CTC TTT CCT ATG TCC CCA ATG A 3’
5’ ATT GAT CCC AAA GAG AAA ACC AC 3’
364bp 58°C
,Table 3.2 The oligonucleotides used as reference genes in SW620 cells.
Gene name Forward Primer Reverse Primer Amplicon size Annealing Temp RPL3 5’ CCT TCT CTG TGG CAC GCG CT 3’ 5’ CCG CTT CGT CTG CAC CAG CA 3’ 284bp 60°C RPL10 5’ ACC TGG GGC GGA AAA AGG CA 3’ 5’ GGT GGA GCC GCA CCC GGA TA 3’ 174bp 60°C
GAPDH 5’GGC TGA GAA CGG GAA GCT TGT CAT 3’
5’ CAG CCT TCT CCA TGG TGG TGA AGA 3’
142bp 60°C
PPIA 5’ CGT GTG CTA TTA GCC ATG GT 3’ 5’ CAT TAT GGC GTG TGA AGT C 3’ 229bp 60°C RPLP0 5’TCATCCAGCAGGT GTTCGAC C 3’
5’ AGA CAA GGC CAG GAC TCG TT 3’
Table 3.3 The oligonucleotides used for the analysis of proliferative capacity in SW620 cells.
Gene name Forward Primer Reverse Primer Amplicon size
Annealing Temp ANLN 5’ TAA AGC AGG TGA
TTG TTC GG 3’
5’ GTT CTT CAT CAA CAC AGC AG 3’
180bp 60°C
MKI67 5’ GTG TCA AGA GGT GTG CAG AA 3’
5’ GCC TTA CTT ACA GAA TTC AC 3’
197bp 60°C
3.10.2 Quantitative Real-time PCR
The primer pairs targeting the genes in interest to analyze the change in their expression as a response to nicotine and serum starvation treatments are given in
Table 3.1, 3.2 and 3.3. For each reaction, 12.5 μl 2X SBYR Green Master Mix (MBI
Fermantas, Ontario, Canada) was added with 0.75 μl 10pmol/ μl forward and reverse primers, 0.05µl 10nM ROX solution as a reference dye and total volume was completed to 24 μl with distilled water. Reaction volume was completed to a total of 25 μl with 1:2 diluted cDNA templates. The reaction was as follows: initial denaturation at 95ºC for 10 min, followed with 40 cycles of 30s of 95 ºC, 30s of 58 ºC, 30s of 72 ºC and final extension at 72 ºC for 10 min. Dose-dependent nicotine samples grown at 10%FBS were run with two technical duplicates while serum starved samples were run with three biological replicates and two technical duplicates.
Melting curves and Ct values were automatically obtained from the software of Applied Biosystems 7500 Real-time PCR systems (California, USA). Each melting curve was analyzed to see whether negative controls were free of product and samples resulted in a single amplicon. For each primer pair, an efficiency value was calculated by running a reaction with 2-fold serially diluted cDNA and formula as shown below:
22
Fold changes in gene expression was calculated by normalizing according to the expression of a reference gene, i.e., GAPDH. GAPDH was chosen among five potential reference genes, as one of the most stable ones across nicotine treatment
,Table 3.. The mathematical formula used for determination of fold changes was 59:
(Etarget) ΔCtTarget (control-sample)/ (Ereference) ΔCtReference (control-sample)
Following the runs, each PCR product was run on 2% Agarose Gel Electrophoresis.
3.10.3 ANOVA Analysis of UGT1A isoforms from qRT-PCR
The fold changes normalized to GAPDH levels of each control and treated samples were uploaded to Minitab Statistical Software 82 and One-way ANOVA (Unstacked) option was used to calculate DF, F-value and p-value.
3.11 General Solution Recipes
10X PBS Stock solution: 80g NaCl, 2g KCl, 11.5g Na2HPO4.7H2O, and 2g KH2PO4 are weighed and dissolved in ddH2O to a total volume of 1 liter and autoclave steriled.
1X PBS Working solution: 10X PBS was diluted with 1:10 ratio and pH is adjusted to 7.4. Working solution should be autoclaved for one more time after dilution and filtered before use in tissue culture.
50X Tris-acetic acid-EDTA (TAE): 242gr Tris Base and 18.6g EDTA are dissolved in ddH2O. They are added with 57.1mL Glacial Acetic acid and volume is completed to 1 liter.
4. RESULTS
4.1 Re-analysis Microarray Datasets with Smoker Status from GEO
In order to answer the question whether smoking induces the expression of UGT1A genes in vivo, we performed a large-scale re-analysis of publicly available datasets that contain information on past and/or smoking status.
As given in Ensembl database, probesets assigned for UGT1A isoforms are uniform, implying that they do not differentiate each isoform. The reason is that since RNA degradation begins at 5’end, probesets are designed to hit on 3’ends. Because UGT1A isoforms share the same common 3’ends, it is not possible to discriminate among them using microarray experiments from Affymetrix. Consequently, we can only observe the changes in expression of UGT1A isoforms as a whole, and the alterations occurring on each gene are not well reflected on the results. In other words, an increase in the expression of a certain isoform may cover a decrease in the other. Nevertheless, the significant changes in expression can be observed anyway. Furthermore, there are specific probesets that additionally recognize the certain isoforms UGT1A8 and UGT1A9. In addition, there is a specific probeset hitting on UGT1A6 gene only in HG133 Plus 2.0 Array.
After normalization and class comparison of the data, a list of genes that are differentially expressed among smokers and non-smokers was obtained using the class comparison tool (p<0.05). Afterwards, the probesets that are annotated for UGT1A isoforms in the corresponding chip type were surveyed whether they are differentially expressed, as well.
Below, a short summary of each dataset chosen and the corresponding intensities of each UGT1A probeset in that array if significantly expressed (p<0.05) were shown. In addition, the geometric mean of probeset intensities was represented with a bar graph for each array.
24
GSE4635: Large airway bronchial epithelial cells
This array was designed to analyze the distinct transcriptomic profiles in large airway bronchial epithelial cells, differentiating smokers from non-smokers. There were 5 healthy non-smoker and 5 healthy smoker samples, whose RNA were hybridized with [HG-U133A] Affymetrix Human Genome U133A Array. Samples for RNA were isolated from right mainstem bronchus of individuals by means of fiberoptic bronchoscopy 83. Based on the knowledge that, airway epithelium is one of the tissues that might be exposed to nicotine most, the findings might implicate to the relationship between smoking and UGT1A expression.
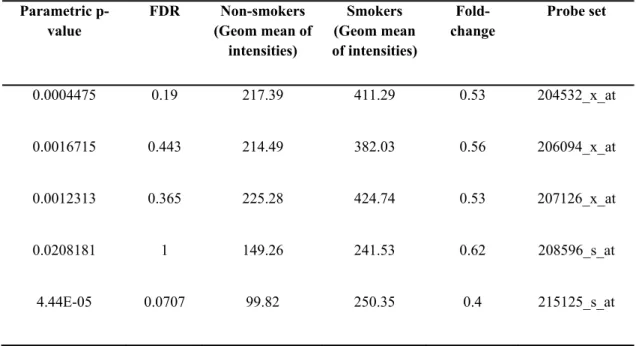
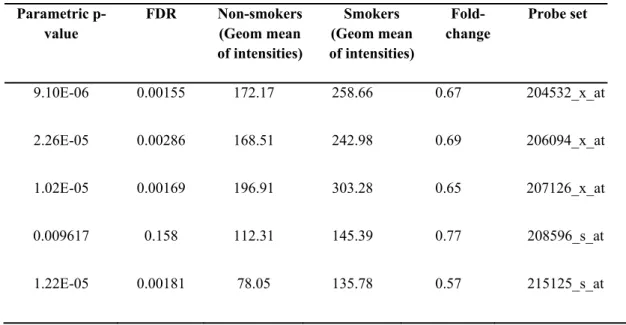
Class comparison tool of BRB-Array tools has brought up 906 genes that are significantly changed (p<0.05) among smokers and non-smokers. In this gene list, there were probesets annotated to UGT1A isoforms, as well (Table 4.1). According to this data, UGT1A expression was significantly upregulated (p<0.05) in airway epithelium of smokers by an average of 2 fold change constant as compared to non-smokers (Figure 4.1). In addition, UGT1A8 and UGT1A9 expression did not change among smokers and non-smokers (Figure 4.2). Indeed expression level of these probesets was very low making the detection of their differential expression difficult.
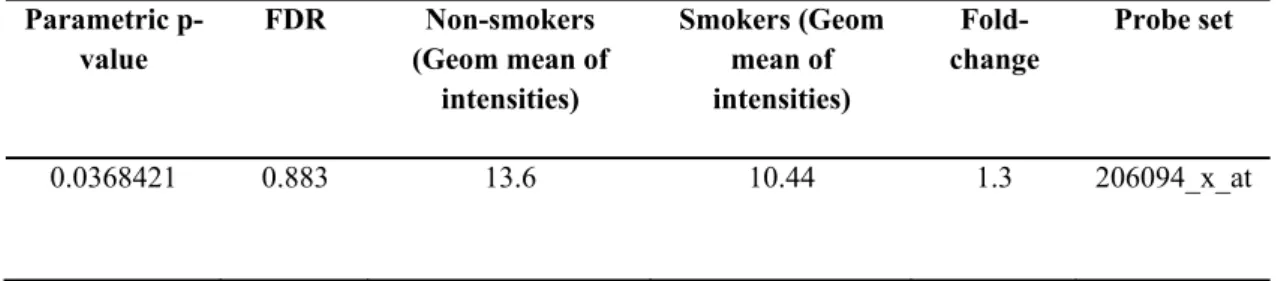
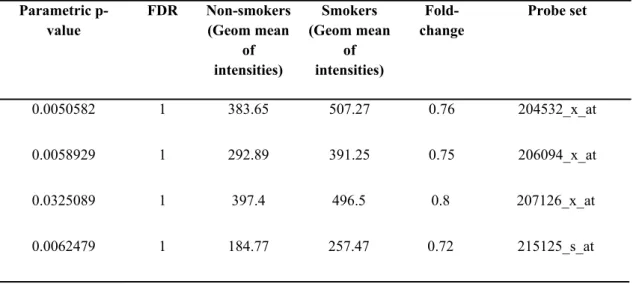
Table 4.1 The geometric mean of intensities corresponding to common UGT1A probesets in GSE4635 array (p<0.05).
Parametric p-value FDR Non-smokers (Geom mean of intensities) Smokers (Geom mean of intensities) Fold-change Probe set 0.0004475 0.19 217.39 411.29 0.53 204532_x_at 0.0016715 0.443 214.49 382.03 0.56 206094_x_at 0.0012313 0.365 225.28 424.74 0.53 207126_x_at 0.0208181 1 149.26 241.53 0.62 208596_s_at 4.44E-05 0.0707 99.82 250.35 0.4 215125_s_at
GSE4635
20453 2_x_a t 20609 4_x_a t 20712 6_x_a t 2085 96_ s_a t 21512 5_s_a t 0 200 400 600 Non-smoker Smoker*
**
**
*
*
G e o m e tr ic M ean s o f I n te n s it ie sFigure 4.1 UGT1A expression in large airway epithelium of smokers and non-smokers according to GSE4635 array (* p<0.05,**p<0.001). Results were given as geometric mean ± SD. GSE4635 22130 5_s_ at 0 10 20 30 40 Non-smoker Smoker G e o m e tr ic Me a n s o f I n te n s it ie s
Figure 4.2 UGT1A8-1A9 expression in large airway epithelium of smokers and non-smokers according to GSE4635 array (* p<0.05,**p<0.001). Results were given as geometric mean ± SD.
26
GSE4498: Small airway bronchial epithelial cells
This dataset is focused on specific arrays originally conducted as a part of superseries GSE5060 84. Overall, GSE5060 superseries aim to analyze how cigarette smoking affects neuroendocrine cells in human airway epithelium. Based on this question, they have analyzed both large and small airways of phenotypically normal smokers and non-smokers, in addition to patients with early COPD and COPD. Since we try to assess the effects of smoking on healthy individuals, we excluded the subseries analyzing patients with COPD. Moreover, all subseries were not hybridized with the same platform. Thus, we decided to analyze each subseries individually.
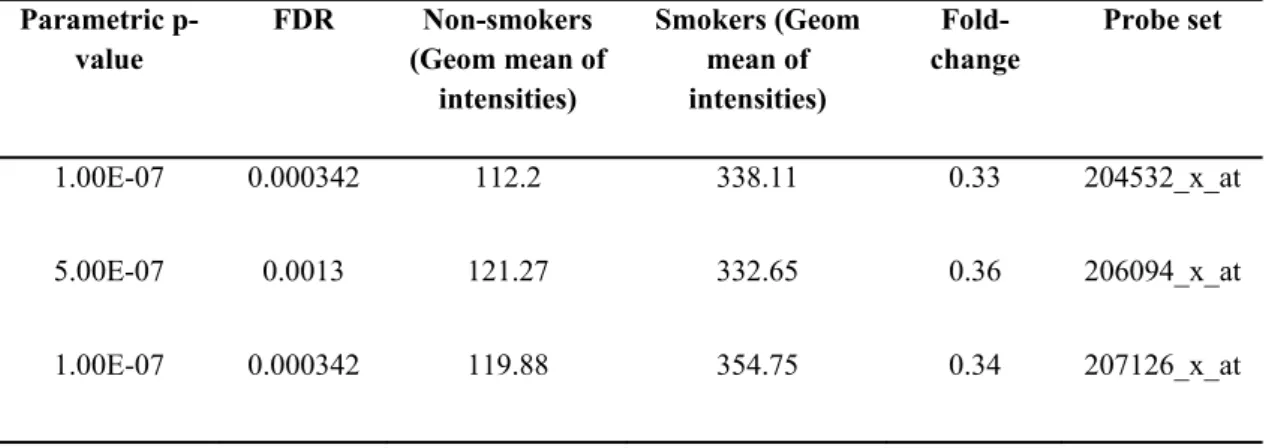
GSE4498 is composed of small airway epithelial samples from 10 healthy non-smokers and 12 healthy non-smokers obtained via fiberoptic bronchoscopy. The platform used is [HG-U133_Plus_2] Affymetrix Human Genome U133 Plus 2.0 Array. Among 6543 genes with significance of p<0.05, there were common UGT1A probesets (Table 4.2) and UGT1A6 (Table 4.3) and UGT 1A8- 1A9 probesets, as well (Table 4.4). Accordingly, smokers have at least twice the expression of UGT1A isoforms when compared with non-smokers (Figure 4.3) where FDR was less than 0.05. UGT1A6 probeset detected a very low expression in non-smokers, which again was doubled in smokers (Figure 4.4). UGT1A8 and UGT1A9 probesets detected very low expression, which was difficult to distinguish from base-line background expression (Figure 4.4).
Table 4.2 The geometric mean of intensities corresponding to common UGT1A probesets in small airway bronchial epithelial cells from GSE4498 (p<0.05).
Parametric p-value FDR Non-smokers (Geom mean of intensities) Smokers (Geom mean of intensities) Fold-change Probe set 1.00E-07 0.000342 112.2 338.11 0.33 204532_x_at 5.00E-07 0.0013 121.27 332.65 0.36 206094_x_at 1.00E-07 0.000342 119.88 354.75 0.34 207126_x_at
4.00E-07 0.00109 120.92 416.67 0.29 208596_s_at 7.30E-06 0.00849 79.82 261.01 0.31 215125_s_at
GSE4498
20453 2_x_a t 20609 5_s_a t 20712 6_x_a t 20859 6_s_a t 21512 5_s_a t 0 200 400 600 800 Non-smoker Smoker**
**
**
**
**
Geo m e tr ic M ean s o f I n te n s it ie sFigure 4.3 UGT1A expression in small airway epithelium of smokers and non-smokers according to GSE4498 (* p<0.05,**p<0.001). Results were given as geometric mean ± SD.
Table 4.3 The geometric mean of intensities corresponding to UGT1A6 probeset in GSE4498 (p<0.05) Parametric p-value FDR Non-smokers (Geom mean of intensities) Smokers (Geom mean of intensities)
Fold-change Probe set
28
Table 4.4 The geometric mean of intensities corresponding to UGT1A8 and 1A9 probeset in GSE4498 (p<0.05) Parametric p-value FDR Non-smokers (Geom mean of intensities) Smokers (Geom mean of intensities) Fold-change Probe set 0.0196277 0.328 10.75 11.99 0.9 221305_s_at GSE4498 23265 4_s_a t 22130 5_s_a t 0 20 40 60 Non-smoker Smoker * * G e om e tr ic M e a n s of I n te ns it ie s
Figure 4.4 UGT1A6 (232654_s_at), UGT1A8 and 1A9 (221305_s_at) expression in small airway epithelium of smokers and non-smokers according to GSE4498 (*p<0.05, **p<0.001). Results were given as geometric mean ± SD.
GSE10006: Human airway bronchial epithelial cells
This array is another study concerning the changes at the transcriptomic level in the airway epithelium of smokers and non-smokers 85. Nevertheless, the dataset is comprised of samples from both healthy and sick individuals. Therefore, we excluded the samples from patients with COPD, leaving 58 healthy samples behind.
With significance of p<0.05, there were 11240 genes that were differentially expressed; among which there were UGT1A genes (Table 4.5). Furthermore,
probesets annotated for UGT1A6 (Table 4.6) and UGT1A8-1A9 significantly changed, as well (Table 4.7).
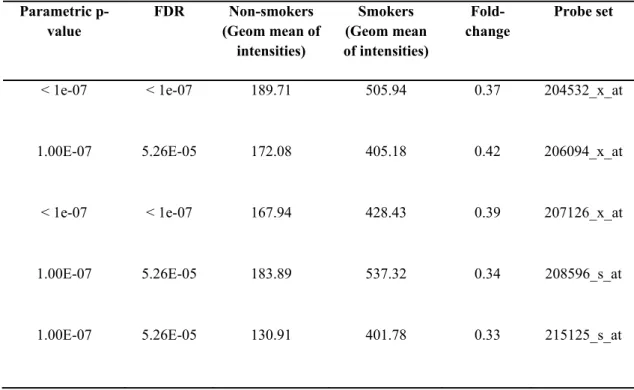
Analysis of GSE10006 further showed that human airway epithelial cells bear a defense mechanism against smoking. This notion was supported by close to three fold upregulation of UGT1A common probesets (Figure 4.5) as well as UGT1A6 (less than two fold). However, 1A8 and 1A9 specific probes (Figure 4.6) did not exhibit differential expression at the level of FDR=0.05; furthermore, the expression of UGT1A8 and UGT1A9 was low based on the given microarray probesets.
Table 4.5 The geometric mean of intensities corresponding to common UGT1A probesets in GSE10006 (p<0.05). Parametric p-value FDR Non-smokers (Geom mean of intensities) Smokers (Geom mean of intensities) Fold-change Probe set
< 1e-07 < 1e-07 189.71 505.94 0.37 204532_x_at
1.00E-07 5.26E-05 172.08 405.18 0.42 206094_x_at
< 1e-07 < 1e-07 167.94 428.43 0.39 207126_x_at
1.00E-07 5.26E-05 183.89 537.32 0.34 208596_s_at