τ κ
S f ú S . - 5 'З
/
33
/
0 £ T £ C î f # a S f MULTIiM!0@{ β Ρ Τ ίί S i S K Ä l S A ТИЕЗШSUBm TTED "Ю THE Ш РА Ж П Ш т OF ELEıCTШCУlL АЖ ) ELECTRONICS ENGINEEÄLK’C ÁM> W & ЙШ-ІГШТЕ o r ЕіК Ш -Ш Ш Ю Αί·ΙΏ SCIHàïCES Cé' ШЖІЖІ mLVEiîSi'iC·· Ш PäITLäL тП ііШ Е І-Т Х o f th e ШІО<ЛйЕі42Ш ^ fOÄ THE ШС-КЕ£ Of '¿¿λΕϊεε Of scii'fíaE -J 4 - ѵй' 4
HOMODYNE DETECTION OF MULTIMODE OPTICAL
SIGNALS
A THESIS
SUBMITTED TO THE DEPARTMENT OF ELECTRICAL & ELECTRONICS ENGINEERING
AND THE INSTITUTE OF ENGINEERING AND SCIENCES OF BILKENT UNIVERSITY
IN PARTIAL FULFILLMENT OF THE REQUIREMENTS FOR THE DEGREE OF
MASTER OF SCIENCE
By
Mujtaba Fidaul Haq 1991
ID cij
p>-
а л ; і U : f¡ ]04 ■1-1 2 ·1331
о / ) 5I certify that I have read this thesis and that in my opinion it is fully adequate, in scope and in quality, as a tliesis for the degree of Master of Sciiuice.
Assist. Prof. Giirhan§aplakoglu (Principal Advisor)
I certify that I have read this thesis and that in my opinion it is fully adequate, in scope and in quality, as a thesis for the degree of Master of Science.
Assoc. Prof. Ayhan Altinta^
I certify that I have read this thesis and that in my opinion it is fully adequate, in scope and in quality, as a thesis for the degree of Master of Science.
Approved for the Institute of Engineering and Sciences:
Prof. Dr. Mehnj^HSaray
ABSTRACT
HOMODYNE DETECTION OF MULTIMODE OPTICAL SIGNALS
Mujtaba Fidaul Haq
M.S. in Electrical
L·
Electronics Engineering Supervisor: Assist. Prof. Gurhan§aplakogluJuly 1991
The feasibility of coherent hoinodyne detection for multimode optical sources is experimentally investigated. By employing the self-homodyne detection, it is observed that a considerable amount of mixing can take place between the signal and local oscillator fields despite the relatively small coherence length of multimode lasers. The experiment was carried out using an a.ll-a.tmosplieric set-up, uecessitating a thorough calculation of power losses due to beam misahgnment. Power losses in the interference term for radial and angular misalignments were calculated for first order Gaussian beams. It is seen that radial misalignment is intolerable lor beam radii ratios smaller than 0.35 whereas angular misalignment becomes intolerable for angular deviations greater than a few tens of milli degrees.
Key words ; Coherent detection, Optical communication, Gaussian beam mis ahgnment.
ÖZET
ÇOK MODLU OPTİK SİNYALLERİN KOMODİN ALGILAMASI
Mujtaba Fidaul Haq
Elektrik ve Elektronik Mühendisliği Bölümü Yüksek Lisans Tez Yöneticisi: Assist. Prof. GürhanŞaplakoğlu
July 1991
E.şcvre honıodin haberle.5inecIo çok rnodlıı optik kaynakların uygunluğu deney sel olarak incelendi. Çalışmada self-homodinleme denen bir teknik kullanarak göründü ki, çok modlu lazer kaynaklarının eşevre mesafesinin tek modlu kaynaklannınkine göre nispeten kısa olmasına rağmen sinyal ve yerel osilatör arasında büyük dere cede homodin girişim yer almaktadır. Deney tüm atmosferik bir düzenlemeyle yapıldığı için demetlerin uyuşmazlığından dolayı ortaya çıkan güç kayıpları teorik olarak hesaplandı. Girişim terimindeki bu güç kayıpları birbirinden ayrılmış bir şekHnde radyal ve açısal uyuşmazhklar için ayrı ayrı grafikler halinde sunuldu. Radyal kayıpların demet yarıçapları arasındaki uyuşmazlık 0.35 civarında olana kadar, açısal kayıpların ise 1 miliradyanm ondabiri seviyesine kadar önemli olmadığı hesaplanmıştır.
Anahtar kelimeler : Eşevre algılama, Optik haberleşme, Gaus demetlerin uyuş mazlığı.
ACKNOWLEDGMENT
I would like to express my most grateful thanks to my supervisor Assistant Professor Gürhan Şaplakoğlu who has guided and encouraged me during the devel opment of this thesis.
I would also like to express my gratitude to Professor Abdullah Atalar and Associate Professor Ayhan Altıntaş, who provided me with most useful advices and comments From time to tinuL
C o n ten ts
1 In tr o d u ctio n 1
2 S elf-H o m o d y n e D e te c tio n For M u ltim o d e Lasers 5 2.1 Im p o rta n ce o f C o h eren ce o f S ou rces in H o m o d y n e D e te c tio n 5 2.2 Brief Theory of Homodyne D etectio n ... 7 2.3 S elf-H o m o d y n e D e t e c t i o n ... 11 2.4 Double Balanced Detection C onfigu ration ... 13 2.5 Geometric Alignment Problems and Its Effect on Homodyning 15
3 R e su lts ' 29
3.1 Amount of Homodyning Obtained in the L a b ... 29
3.2 Noise Calculations 30
4 C o n clu sion 33
A q -p aram eter C alcu la tion s for G au ssian B ea m s 35
List o f F igu res
1.1 Simplified block diagram of a liomodyne r e c e iv e r ... 1
2.1 Frequency spectrum of the multimode l a s e r ... 6
2.2 Block diagram of a homodyne r e c e iv e r ... 8
2.3 Low pass filter ... 10
2.4 Model for homodyne detection 11 2.5 Block diagram of Jiomodyiie detection set-up 12 2.6 Double detection co n fig u ra tio n ... 14
2.7 Misalignment of the LO and signal beam rad ii... 16
2.8 Normalized interference power.for radial m isa lig n m en t... 18
2.9 Contour plot of normalized interference power for radial misalignment 19 2.10 Misalignment of the LO and signal beam axes 20 2.11 Normalized interference power for angular m isalignm ent... 21
2.12 Contour plot of normalized interference power for angular misalignment 22 2.13 Photographs of interference p a t t e r n s ... 23
2.14 Computer plot of interference pattern for 6 = 0 . 1 7 2 ° ... 24
2.15 Computer plot of interference pattern for 6 = 0 . 0 8 6 ° ... 25
2.16 Computer plot of interference pattern for 6* = 0 . 0 3 5 ° ... 25
2.17 Contour plot of interference pattern for 6 = 0 . 1 7 2 ° ... 26
2.18 Contour plot of interference pattern for = 0 . 0 8 6 ° ... 26
2.19 Contour plot of interference pattern for = 0 . 0 3 5 ° ... 27
2.20 Simplified model of axial misalignment 28 3.1 Ilomodyne detection of signal f i e l d ... 30
3.2 Detection of signal field in absence of local o s c illa to r ... 31
C h ap ter 1
In tro d u ctio n
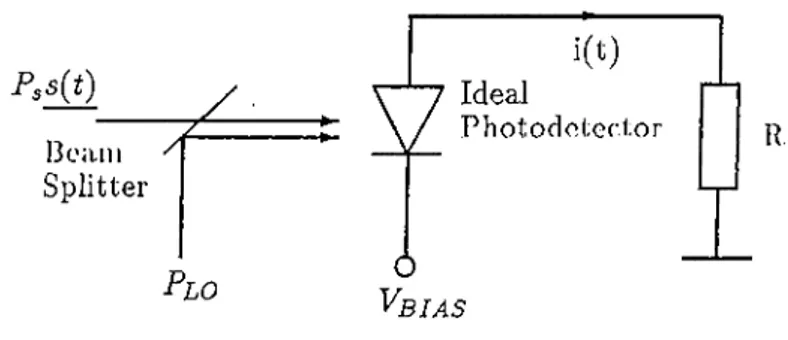
Optical homodyne detection is a subclass of coherent optical detec tion schemes and hence, like all coherent detection schemes, includes a local oscillator at the receiver front-end. In coherent detection, the received optical signal field is mixed witli a coherent optical local oscillator held before falling onto the photode tector surface[l]. Although photodetectors are square-law devices and hence capable of sensing intensity variations only, coherent detection schemes detect complex field amplitudes, i.e. field magnitude and phase as a result of this mixing[2]. In the case of homodyne detection, the local oscillator field must be exactly in phase and have the same frequency as the carrier field of the incoming modulated signal[3]. A simplified block diagram of basic homodyne receiver is shown in figure 1.1.
PsS{t) Splitter Pl o
V
i(t) Ideal Pliotodd;Gd;or6
Vb i a s RThe signal field incident onto the ideal noiseless photodetector surface is rep resented by ^/Plsij,) where Pg is the average signal power and ¿(¿) is the normalized^ complex envelope of the modulating signal. A more rigorous notation would warrant that we express the signal field as E, s { t ) , in which case the vector field amplitude Eg indicates the direction of polarization of the field and Pg = \Eg · E* is the power of the field[l]. Moreover, it is assumed that the field propagates in the positive 2; direction with an angular frequency of Wg and an initial phase of
(j>g. The assumption that the signal field oscillates at a single frequency makes it a single mode field. Keeping with the same vain, the single mode local oscillator field ^/Plo should also be expressed as Elo for efficient mix ing on the photodetector surface, the signal and local oscillator fields must have the same direction of polarization and are incident onto the photodetector surface along the same axis of propagation. Consequently, the fields can be represented as scalar functions without loss of generality, with an underlying assumption of perfect polarization matcliing. Furthermore, tlie local oscillator field has exactly the same frequency as and is completely in phase with the signal field. So, if we let the pho todetector surface to be located at 2r = 0, it becomes apparent that the signal field
can be correctly abbreviated as y/P^s(t) and the local oscillator field as \ / P w · The name “coherent detection” is indicative of this strict relationship between the signal and local oscillator fields. When these two fields are made to fall onto the surface of an ideal photodetector by means of a beam splitter, the photodetector produces a current whose mean value is proportional to the magnitude square of the combined incident field.
CHAPTER 1. INTRODUCTION 2
i(i) = A ' | | v ^ +
= K Pl o + P .lllW lP + ‘^ ^ / { P L o P s ) R e { s { t ) } ( 1.1)
where overbar denotes expectation and K is a constant that depends on tlie responsivity^ of llie delcclor. Jii detection receivers, the local oscillator power Pi^o is iiiucJi higher
1 1
77 Jo ^Respoi
conversion takes place.
77 JJ) ' ||5(/)||^c¿¿ = 1 for some signaling time interval (OjT.,)·
CHAPTER 1. INTRODUCTION
than the signal power Consequently, equation 1.1 can be siraphiiecl as,
i ( t ) ~ K [Pl o + 2 ^ { P L o P s ) R e { s { t ) ) (1.2)
By employing a suitable filtering teduiique or a clever detection configuration, we e;ui g(‘t rid of tin.' miwa.nted dc Lerm l\ Pj,o wliicli l(‘a.v(\s iis (,1k' (l(‘sircd signa.l (.cnii
Furthermore, since Plo can be arbitrarily large the above signal term can be pushed to a level well above the thermal noise of the receiver. This improvement in tlie SNR is the essence of coherent detection.
However, this simple description of homodyne detection is chiefly applicable for single mode signal and local oscillator fields, i.e. fields which, as mentioned above, oscillate at a single frequency. They are not generally valid for multimode fields. Multimode fields, which oscillate at a series of narrowly separated frequencies, generally can npt be treated in the same fashion as the single mode fields.
In this thesis work, which is mainly about the implementation of a homodyne receiver, it is shown that coherent homodyne detection is also feasible for multimode lasers as long as we abide by the constraints brought about by the relatively short coherence length of multimode lasers. A honiodyne detection set-up using multimode lasers was constructed and operated in the laboratory. The signal beam in the set-up is ASK modulated at 6MHz and a double balanced detector configuration is used as the receiver.
The purpose of the thesis was to gain practical experience in homodyne detec tion and related practical problems. As there is an acute lack of relevant information in the literature about down-to-earth practical problems involving optical set-ups, such an exercise in implementing a coherent detection set-up was both necessary and useful. One of the major practical problems was the misalignment of the signal and local oscillator beams incident onto the photodetector surface. It is seen that severe mixing losses can occur due to minute misafignments of the beams. These mixing losses are thoroughly investigated for the case of Gausian fields - the radiiition field pattern of most of the lasers. To the best of our knowledge, these misalignment cal culations for Gaussian beams do not exist a.nywliere in literature and can be useful to anyone dealing with atmospheric coherent detection schemes.
CHAPTER 1. INTRODUCTION
The next cliaplcr, i.c. Cliapler 2, coiilalns llie bulk of Iho lliosiy work. U be gins with a section that explains the importance of coherence of sources in homodyne detection schemes followed by a section that describes the theory of homodyne detec tion in brief. The next section of tlie same chapter describes tlie set-up constructed for self-homodyne detection in the laboratory followed by a section that explains the double detection configuration employed in the set-up in detail. The last section of Chapter 2 deals with the geometric alignment problems. Chapter 3 contains the results in brief while the ¿/-parameter calculations for the set-up for Gaussian beams is carried out in Appendix 1.
C h a p ter 2
S elf-H o m o d y n e D e te c tio n For
M u ltim o d e Lasers
2.1
Im p o rta n ce o f C oh eren ce o f Sources in H o m o d y n e
D e te c tio n
In the Optics and Waves Laboratory, we constructed a set-up for the homodyne detection of ASK modulated multimode la.ser signals. As was discussed in chapter 1, homodyne detection, or any coherent detection for that matter, requires perfect matching - both spatially and temporally - between the signal and local oscillator fields. Any mismatch, be it a poor correlation between the phase differences of the two fields or non identical diffraction patterns of the fields incident onto the pho todetector surface or diffraction patterns slightly offset or slanted from each other, results in heavy penalty in terms of percent homodyne efficiency obtained. Multi- mode lasers, from this point of view, are limited by their relatively short coherence lengths. A multimode laser, unlike a single mode laser, has a series of longitudinal modes of oscillation. The frequency difference Au between two adjacent mode of oscillations is determined by the free spectral range of the laser [4]
A// = c / 2d
(2.1)
where c is the speed of light and d is the laser cavity length. The He-Ne multimode laser employed in the experimental set-up has a cavity length of 1 meter. It radiates
CHAPTER 2. SELF-HOMODYNE DETECTION FOR MULTIMODE LASERS 6
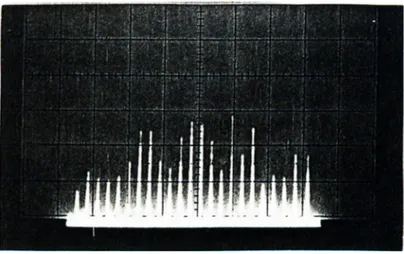
Figure 2.1: Frequency spectrum of the multimode laser
at the nominal wavelength of A = 632.8nm and has got approximately twenty lon gitudinal modes of oscillation. A photograph of the frequency spectra of the laser is shown in figure 2.1. From equation 2.1 , the frequency difference between two adja cent modes is 150 MHz. The actual drawback of a multimode laser is the decrease in its actual coherence length by a factor inversely pro[)ortional to its total number of longitudinaJ modes. The coherence length of a jiearly monochromatic source having a nominal wavelength of A and spectral width Aiy can be expressed as[4]
¡■c = c / 2Au
(
2.
2)
where c is again the si)eed of light. For a|)j)roximately twenty longitudinal modes of oscillation, total spectral width of the He-Ne source used is 3GHz. This, in turn, implies that the coherence length of the multimode laser that we are using is approximately
_ 3 X lO^m/5 cmm
2 X 2 GHz
= ban (2.3)
The import of this shortened coherence length wiU be appreciated in section 2.3 where the self-homodyne detection set-up constructed in tlie lab is explained in detail.
Now, we shall derive an expression to model the complex amplitude of the field radiated by a nuiltimode laser. A single mode field can be represented as
У- S M 0 = UQexp[j(k · r + <;/) H- 2-KUoi)) , (2 .4 )
where //q is the center frequency of the single mode field. The longitudinal modes
of a multimode laser can be thought of a series of single mode lasers though the two cases are not exactly equivalent[5]. The main reason for this discrepancy is the fact that although the frequency deviations of the individual modes are quite small and their bandwidths quite narrow compared to most of the commercially available diode lasers, the distribution of power among the individual modes is not fixed and in fact, stochastic in nature. But since the average power distribution among the modes is given by the overall gain curve of the laser and the fact that we perform the experiments within the shortened rolier('iir(' hmgth of the multimoih^ laser as calculated above, wo can approximate the multimode laser as an array of single mode lasers. This, in turn, permits us to write an equivalent mathematical r('|)r(\s('nta.tion for th(' пи'а.п romj)l('x fu'lil a.mplitiuh' of a. mull iiiKxh' las('i· ha.\ ing 2N + 1 longitudinal modes as
N
0 = E bionexp ( j( (k + Ak) • г + фп + 27г(щ + nAu)t)) . (2.5) n = - N
In this thesis, this representation of multimode fields will be used.
CHAPTER 2. SELF-HOMODYNE DETECTION FOR MULTIMODE LASERS 7
2.2
B r ie f T h eo ry o f H o m o d y n e D e te c tio n
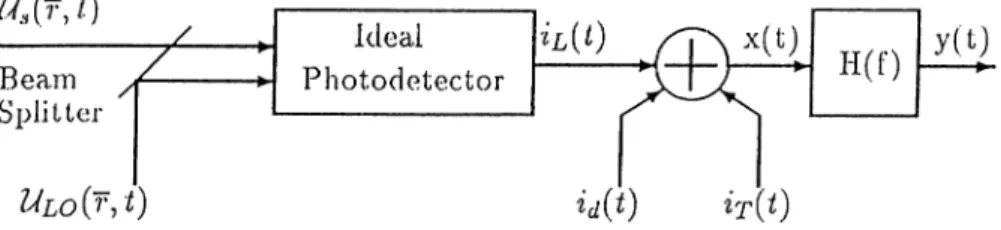
Now that we have modelled our multimode laser as a collection of a series of single mode lasers, we can go into a brief description of the theory behind homodyae detection. A block diagram of a. basic Itomodyne receivt'r is sliowii in figiin' 2.2f l][d].
The signal field incident onto the ideal photodetector surface is rejiresented by l£s(r, t). Assuming that the detector is placed at the origin, i.e. at z = 0 along the i-a.xis, the signal field on the detector surface can lie written as
CHAPTER 2. SELF-HOMODYNE DETECTION FOR MULTIMODE LASERS S
Figure 2.2: Block diagram of a homodyne receiver
(
2.
6)
wlierc s(t) is a normalized complex envelope which salisfies ^ = 1 for some signaling time interval (0, Ts). Ps is the time average signal field power and d is the diameter of the active photodetector surface. Similarly, on the detector surface, the local oscillator field U.Loi^y'^) ^e expressed as(2.7) where Plo is local oscillator field power. It should be noted that the local oscillator field has exactly the same frequency as and is completely in phase with the signal field. The photodetector current is a Poisson process whose rate[l] is given by
A(i) = / ‘■¿■''cn-c(2||r||/d)||i/,(?',Z) + ZY;-_,o(r,i)|| where ctrc d 1 i f | | r | | < f 0 i f | | r | | > | (
2
.8
) (2.9) defines the active area of the photodetector. Moreover, rj is the quantum efficiency of the photodetector and h is the Planck’s constant. The expression for \ { t ) above, after some simplification can be written asA(() =
^ [P
lo+
i>,IU(0ll" +2V{Pc.oP.)Be{s{t)}
(2.1 0)In addition to the shot noi.se inherent in the photodetector current i/,(t), there are several additional noise sources present in the receiver front end. In particular,
CHAPTER 2. SELF-HOMODYNE DETECTION FOR MULTIMODE LASERS 9
id(t) represents the dark current viz, the non zero current component present even in absence of LO and signal fields due to emission of thermally excited electrons ;ui(l /’r (/) vvliicli r(‘pros(Mil.s the tlierma.1 iiois(‘ a..ssocia.t(‘(l with tli(‘ (‘(|niva.h'iit noise resistance of the (runt end electrojiics. Since tlie mean value uC tJie theriiiaJ current i r i t ) is zero, equation 2.10, from the theory of Poisson processes[l], implies that the mean value of the signal x{t) [see figure 2.2] can be expressed as
a;(i) = qX(t) + ■¿¿(i), (2.11)
where overbars denote expectation and q is the electron charge. Using equation 2.10, we can write equation 2.11 as
X{1) = n \P
lo+ P s M O f + P
d+ 2У(/^оР,)Л е{1(0)
(2.12)where TZ = is the responsivity of the photodetector and is replaced by its equivalent noise power term TZPd· Again, using the theory of Poisson processes, it ca.n 1)(‘ shown tha.l, Uu' cova.ria.ma' oi* 1,1и* signal .r(/) is[l]
= [q^Xit) + q l D + 2 k T / R ] 6 { t - u ) (2.13)
P -{ P
lo+ P sU itW + 2^{PboPs)Re{iit)})+
ПЩ
qlD + 2 k T / R ] 6 { t - u ) . (2.14)
Here R is the receiver equivalent noise resistance, к is the Boltzmann’s constant and T is the temperature of R in Kelvins and Id is the average value of the dark current.
2
The local oscillator power Plo may be increased until ^ P lo > q l D , 2 k T / R and 2
^ P s - In which case, equation 2.11 and 2.13 can be simplified as
a;(i) ~ qX(t) , (2.15)
a,nd
Kxx{t,u) = q^X{t)6{t - u) . (2.16)
Pliysically, tJiis is the essence of colicreiit detection : the mixing action willi astrong local oscillator pushes the SNR well above the thermal and receiver noise levels, hence shot noise remains as the dominant noise source.
The covariance of the filtered signal y(l) can he written as
K y y { t , u ) =
f
d r h i t - T)h{u - t) . (2-17)J - o o
Now if h{t) = l / 2 R - \ / P i o h ' ( t ) where h'{t) is alow pass filter with a bandwidth equal to W where W is much larger than the bandwidth of the modulating signal s(t) [see figure 2.3], then K y y ( i , u ) becomes
CllAPTEiL 2. SELF-HOMOD YNE DETECTION EOJi M ULTIMODE LASEliS 10
1
-W W
Figure 2.3: Low pass filter
K y y { t , u ) = / clTh'(t — r ) h ' { u - r ) .
J - O O
(2.18) With the above assumption of the local oscillator field and the low pass filter char acteristic, the mean value of the filtered signal can be written as
y{t) = ^ / ¥ l R e { s { t ) ) -f ' / Pl o/ ‘^ (2.19)
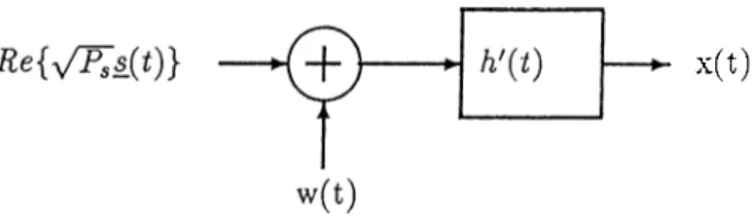
In effect, as mentioned previously, what is actually achieved in homodyne detection is the suppression of all other noise sources in the receiver by the presence of a strong local oscillator whose shot noise dominates the noise variance. So, we basically represent a homoclyne detection scheme by the model shown in figure 2.4. Since in the limit when A —i· oo a Poisson process becomes a Gaussian process[6], a large local oscillator power means that w{t) is a Gaussian process, and hence, it is completely characterized by its mean value w{t) = 0 and autocorrelation function •w{t)w(u) = — u). So, we can see that for a homodyne receiver, the signal-to-noise ratio is[l]
SNRho _ ^ Jo " Var(y(t)) 2vPs
CHAPTER 2. SELF-HOMOD YNE DETECTION FOR MULTIMODE LA SERS 11
x(t)
Figure 2.4: Model for lioinodyne detection
where 2W is the bandwidth of the receiver filter and Var{) denotes variance. This signal-to-noise ratio by far outperforms the signal-to-noise ratio of a direct detection receiver (in a direct detection receiver, tJie signal field is not mixed with a local oscillator field at the receiver front-end and is detected directly by the photodetector). The signal-to-noise ratio of a direct detection receiver is[2]
vPs S N Rd d = -r.r .
2IwqW
which is only one fourth of the signal-to-noise ratio of a homodyne receiver.
(2.21)
2.3
S elf-H o m o d y n e D e te c tio n
In our homodyne detection set-up, instead of using a local oscillator laser source having the same phase and frequency as the incoming signal, a beam from the source laser was tapped and steered to be used as the local oscillator signal. This experimental technique is known as self-homodyne detection in literature[7]. The advantage of self-homodyning is that a phase and freqiiejicy locked local oscillator is derived from the signal itself reducing the complexity of the set-up. A block diagram of the homodyne detection set-up is shown in figure 2.5. The vertically polarized Gaussian beam coming out of the He-Ne laser is passed through the half wave plate WP3 in order to change its plane of polarization so that the beam can be split by the polarizing beam splitter PB Sl. The polarizing beam splitter lets the horizontally polarized component of the beam pass through while diverting the vertically polarized component of the beam at an angle of 90° with respect to the incoming beam. The ratio of the two beams can be adjusted by rotating the halfwave plate WP3. By a completely arbitrary choice, the horizontally i)olarized beam is used as the signal while the vertically polarized beam as the local oscillator. The
CHAPTER 2. SELF-HOMODYNE DETECTION FOR MULTIMODE LASERS 12
Figure 2.5: Block diagram of liomodyiie detection set-up
signal beam is then modulated by the acousto-optic modulator AOM. Lens Li is used to focus the signal beam such that the beam radius is at its narrowest while passing through the Piezo-electric material inside the acousto-optic modulator. This is needed to drive the AOM at maximum possible bit rate. The narrower the beam radius of the signal passing through the AOM, the faster is its response[12]. The ± l s t order beams generated by the acousto-optic modulator is blocked by the slit S while only the zero order beam is allowed to pass to the receiver. Hence the signal is on-off modulated. The transmitter part of the set-up essentially consists of the components described so far. The sole purpose of the lens L2 placed on the local oscillator path is to match the beam radius and the radius of curvature of the LO field with those of the signal field. The importance of this mode matching and calculations of penalties
paid for lack of it is described in section 2.5 and exact calculations of beam waists and radii of curvatures of the Gaussian beams along tlie wliole set-up is provided in Appendix A.
On the receiver side, the signal and local oscillator fields are mixed by the non polarizing beam splitter NBPS after passing through half-wave plates W P l and VVP2, respectively. W P l and WP2 are used to change the polarization angles of the signal and local oscillator such that both the beams are now ])ola.rized at a plane making an angle of 45® with the horizontal plane. This ensures that the polarizijig beam splitter PBS2 mixes the fields with a 50/50 ratio. The significance of this arrangement will bc'ccrni^ clea.r in tin' lU'xt sii hsivtioii. At this |)i)iiit, it sliniild also be mentioned that to guarantee coherent mixing of the LO and signal beams, the path difference between the beams should not exceed the coherence length of the multimode laser as found in equation 2.3. To be more precise, the difference between the paths the beams take between P B Sl and NPBS should not exceed 5cm.
Beams coming out of PBS2, which consists of both the local oscillator and signal beams, fall onto the photodetectors P D l and PD2. The composite beam in cident upon P D l is horizontally polarized whereas the beam incident upon PD2, though equal in power, is vertically polarized. Finally, the photodetector currents generated by the incident optical fields are subtracted from one another which yields the desired detection current. This detector configuration employing two detectors and subtraction of detected currents from ea.ch other is known a.s double ba.Ia.iKH^d detection and is explained in the next subsection.
CHAPTER 2. SELF-HOMODYNE DETECTION FOR MULTIMODE LASERS 13
2.4
D o u b le B alan ced D e te c tio n C onfiguration
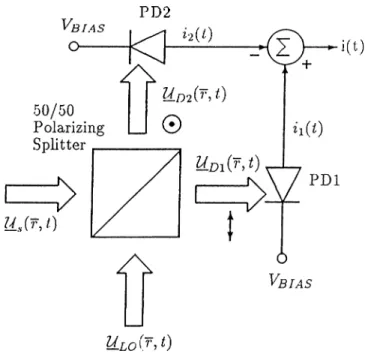
The receiver section of the set-up in the laboratory employs a double balanced de tector configuration. This type of detection provides a balanced detection of the two composite beams coming out of the last beam splitter. A detailed block diagram of the balanced receiver is shown in figure 2.6. The composite fields and IJ_£)2 are formed by mixing the signal and local oscillator fields and can be written as
CHAPITER 2. SELF-HOMOD YNE DETECTION FOR MULTIMODE LASERS 14
PD2
i(t)
Figure 2.6: Double detection coniiguration
Kd
2
— - ^ ~0
Ks + UloÎ
(2.23)where e is the intensity transmission coefficient and the negative sign in equation 2.23 is a consequence of the reciprocity theorem[9]. The corresponding intensities of the fields incident on the two detectors are,
PiW = (2.24)
= e\Us\? + (1 - ^)\Ul o\? + (2.25)
~ (1 - e)PLo + 2 ^ e { l - e ) ^ / P Lo P s R e { s { t ) ] (2.26)
for pliotodetector 1 and
P2(i) - ||^£)2İ
~ cPlo - 2 y/ e( l - e ) y / p [ ^ R e { s ( l ) }
(2.27)
(2.28)
for photodetector 2. As usual, in equation 2.26 and 2.28, it is assumed tlia.t Plo — ||¿fLOІP ^ II^IP = Ps- "The mean values of the detector currents ii(i) and J2(t), as seen in chapter 1, a.re related to the.se power expressions. For the doul)le
CHAPTER 2, SELF-HOMODYNE DETECTION FOR MULTIMODE LASERS 15
incident on the nonpolarizing beam splitter are polarized at an mean detector currents are
angle of 45°], the
ii{t) = TZ{Pl oI ‘^ + \ / P L o P s R ( i { s { t ) } ) , (2.29) i.2{i) = n{PLol-2 - ^ P L o P s R e { s { t ) ) )
Consequently, the mean value of i{t) is
(2..30)
i{t) = ii{t) - ¿2(t) = ^ 2^Z^yPLoPsPe{s{t)} . (2.31)
On the other hand, the covariance function of the above current components are given by, K n i i { l , u ) = - u) ~ 2 6{t u) , Ki^i^{t,u) = qÍ2{t)6(t - u) (2.32) - q ' R . ^ H l - n ) , — ft ¿It'i (^) "b -ft I2i2 (t, u) (2.33) = fy7ZP¿o<5(t - u ) . (2.34)
The advantages of double detection configuration over single detection configura tion is quite obvious. First, we get rid of the undesirable dc component simply by subtracting the currents. Second, any fluctuations in the local oscillator power is balanced by the corresponding increase or decrease in the two legs of the receiver yielding a more stabilized overall detection. Moreover, owing to the fact that the oxj)rossion for llio covaria.JLce function is the same for both the single and dual de tector configurations, no extra penalty is paid.
2.5
G eo m etric A lig n m en t P ro b lem s and Its E ffect on
H o m od yn in g
So far in our calculations, we have assumed that the signal and LO fields are perfectly mode matched and geometrically aligned, i.e. they are incident uj)on the pliotode- tector surfaces at the same points with the same beam waists and radii of curvature
C í l A Pr ER 2. SELF-UOMODYNE DETECTiON FOIl MULTIMODE LASERS i()
iift.i'r (.r;ivi'llin/.’; ¡(l('nl.ir;il pal.lis. In r('alil.y, Uiis is iiol so, n.iid snin.ll (I('vin.(.ioiis from
ideal conditions are inevitable. In this section, types of alignment mismatches and tlieir effect on the performance of the receiver is investigated. Tliere can be two types of mismatch problems in an opticaJ coherent receiver. They are,
i) Radial Misalignment : The beam radii of the signal and LO beams are not matched on the detector surface and,
ii) Angular Misalignment: The axes of propagation of the beams are not parallel and do not fall onto the detector surface perpendicularly.
In our treatment of these mismatches, we deal with them separately though calcu lation of these mismatches occuring together is fairly straightforward.
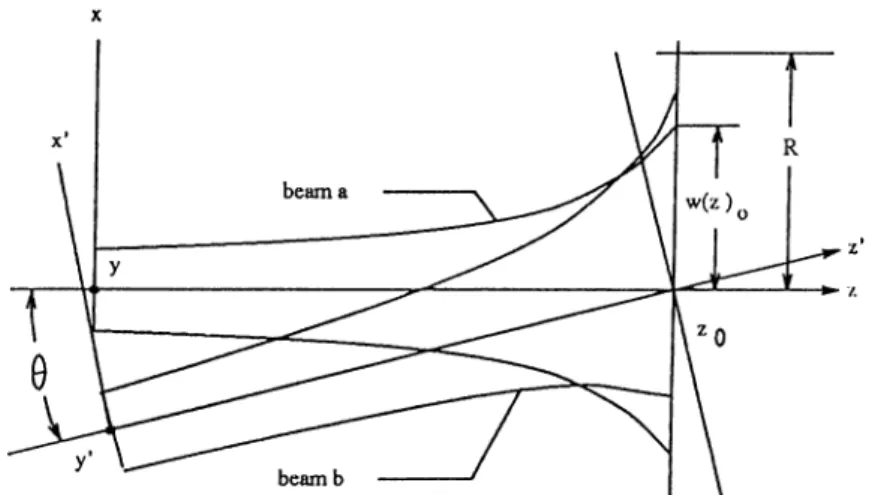
As was mentioned above, radial misalignment, relatively the simpler one of the two, occurs when both of the beams are perpendicularly incident on the photodetec tor surface with their axes of propagation perfectly overlapping each other but the beam radii on the photodetector surface plane are not of the same size. The beam radius w{z) of a Gaussian beam is the point where the intensity of the beam falls to times its on-axis value[5]. The situation is depicted in figure 2.7. When beam a hits Uie pliolodoLeclor surface, il lias a beam radius of W[ whereas beam b lias a radius of W2^ where without loss of generality we assume that W2 > W\, Ideally, it would be best if the beams have the same radii and the photodetector surface is large enough to completely contain the spread of tlio beams. Rut. beams with very
small radii are difficult to align and detectors with larger areas are generally slower in response[8]. The pin photodiodes used in the experiment have surface areas of 20 mm^[13]. This, given the fact that the photosensitive areas are circular, corre sponds to a radius of approximately 2.5mm, which, in turn, sets the practical limit on the radii of the beams. The normalized field associated with a radially symmetric Gaussian beam propagating along the ,3r axis can be written as[i0]
CHAPTER 2. SELF-HOMODYNE DETECTION FOR MULTIMODE LASERS 17
U { r , z ) = ^ g / 2R{z))
\ w j w(z) (2.35)
where w{z) = u»o (l + A^/7ri«o)^^^ is the beam radius, R(z) = z (l + (7ru;o/Aг)^) is the radius of curvature and (p{z) = tan~^{Xz/TrwQ). Equation 2.35 implies that for two Gaussian beams U \( r ,z ) and U2{ r ,z ) propagating along the aods, the interfer ence term would be
UiNT = 2R c { U i { r , z ) U 2{r,z)*} ,
4 .
•KWi{z)W2{z)
CO.S· - <Uz) - kr^ 1 (2.3Ü)
J h { z ) R 2(z) J \
·
Integration of i7/yvT over the surface area of the photodetector yields the power generated by the interference term[3]. If this power is denoted by Pi n t ^.nd the radius of photodetector surface by R, then
Pi n t = 7rwi(z)w2{z) —P ( —rr---1—1,^—') / dfcirc(||7||/ü:)e . Jo COS (2.37)
The above integral is directly integrable and the final result as a function of the photodetector surface radius R is,
_ 4 Pi n t = Wi(^)«^2(^) -I-COS(f>{z)
-t-
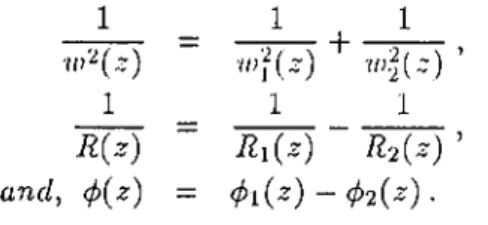
k w‘^{z) . R( z) sin(j)(z) — --- ^ Í kw'^{P) ■ ( xr \ ^ , I AÍ \ R ( z ) ) kR'^ R{z) (2.38)CHAPTER 2. SELF-HOMOD YNE DETECTION FOR MULTIMODE LASERS 18 where 1 wHz) 1 viiiz) + 1 1 R(z) and, 4>{z) R l ( z ) R2{z) (j>l{z) - (f>2{z) . 'W2(z) (2.39) (2.40) (2.41)
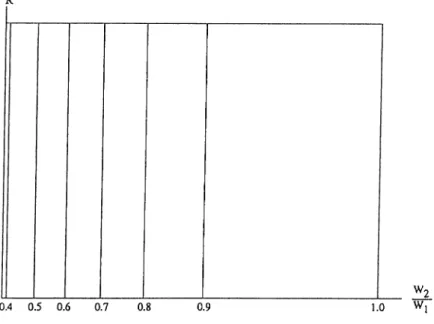
A plot of the above integral as a function of and R is provided in figure 2.8. In the plot, for any specific value of R, wi is always equal to j and iU2 is varied from to w\ in steps. Moreover, the interference power is normalized by the ideal interference power, i. e. the power we would obtain if Wi were equal to tU2· As can be seen from the plot, for a specific ratio of the radii, the normalized power remains the same along the R axis. Other important things to note are : when the ratio of the beam radii is more than 0.64, the normalized power term is greater than 0.9 but
Figure 2.8: Normalized interference power plotted as a function of a-nd R. For any value of R, Wi is chosen to be ^ and W2 is varied from ^ to Wi. The power is normalized by the ideal interference power,i.e. the power obtained when w-i is equal to
W2-the normalized power term falls below 60% of W2-the ideal value when W2-the ratio gets smaller than 0.36. The corresponding contour plot of the normalized interference power is also provided in figure 2.9. The gradual increase in the spacing between
CHAPTER 2. SELF-HOMODYNE DETECTION FOR MULTIMODE LASERS 19
w,
Figure 2.9: Contour plot of interference power plotted as a function of and R
contours of fixed difference should he noted.
It should be noted that the above calculations are carried out and plots drawn assuming that the signal and local oscillator fields are of equal power. In practice, the LO field is much powerful than the signal field and hence, it is always safer to keep the LO field radius slightly larger than the signal field radius to ensure that all of the weak signal field is interfered with the overwhelmingly strong LO field.
The other type of misalignment occurs when the beam radii of the beams match, but their axes of propagation do not. The situation is shown in figure 2.10. Both beams a and b are incident onto the photodetector surface. But, while beam a ’s axis of propagation is coincident with the z axis and hence perpendicular to the photodetector surface, beam 6’s axis of propagation makes an angle of 0 with the z axis. As a consequence, though the radius of beam a is uniform and equal to w(zo) all over the photodetector surface [ z = zq plane], the cross section of beam h at z = zq plane is a contour which is neither a circle nor an ellipse. Moreover, the beam radius of beam b is equal to w{zq) - the radius of beam a on the photodetector surface - only in one direction, along the y axis in the figure. This mismatch of the beams can again lead to power losses. To calculate the power loss precisely, let’s look at the geometry involved with angular misalignment a bit more carefully. Let the direction
CHAPTER 2. SELF-HOMODYNE DETECTION FOR MULTIMODE LASERS 20
Figure 2.10: Misalignment of the LO and signal beam axes
of propagation of beam b be the axis (see figure 2.10). Then the detector surface intersects this axis at z' = zq and is located at the = (coid)(z^ — zq) plane. So, if beam b is represented by the field [/2(0;', y', z'), its expression on detector surface
plane would be
U2{cot6{z' - Z o ) , y \ z ’) = \ l - - ---- --- ^-[cotH{z>-zo)Hy^][llw^{z>)+jkl2R{z^)]
7T w{z')
Now, using the transformations
x'
= :
XCOS0
—
ZSinO+
ZoSinO,
y' = y,
and, z' — xsind + zcos6 -\- zq{ \ - cosO)
(2.42)
(2.43) (2.44) (2.45) U‘2{cot6{z' — zo), y',z') can be written as a fnnctioji of x , y and z. With this ro tated coordinate system representation, at z = zq, U2{cot0{z' — zo),y',z') equals U2{xcos0, y , z o + xsinO) which can be expressed as
/ 2 -]rxsin0)-\-j4>[zo +X3in9) i ---m(zo + x .in »
)---g - [(scosi)^ ] \llw^(za-\-xsin8)+ikl2R(zo +a;stn5)] (2.46)
On the other hand, if beam a is represented by the field Ui{x, y, z) propagating along the z axis, its expression on the detector surface plane would be
/7 i(x ,y,zo) = . (2.47)
CHAPTER 2. SELF-HOMODYNE DETECTION FOR MULTIMODE LASERS 21
Figure 2.11: Normalized interference power plotted as a function of 9 and In the plot, w{zq) is fixed and the radius R is normalized by w{zq). At the same time, the power is also normalized by the ideal interference power, i.e. the power obtained for 9 = 0.
As a consequence, the interference term would now be
2 Q-{(xcos6p+y^)/w^(zo-{-xsinO)-(x'^-\-y^)/w^{zo)
UiNT
-COS'Kw[zq)w{zq + xsin9)
±i ' f\\ ir \ 1 ‘ n k{{xcos9y + y'^) + (!>{zq + XSin9) — (t){zo) — kxs ir i9--- r-;^ ;■ ■■ + ^
2R {zq + xsin9) 2R(zo) (2.48) As was mentioned earlier integration of tf/^rT over the detector surface yields the interference power term. That is.
Pi n t =
Trw(zo)
Í
dr d rc(||r||/i?)g—({xcos9)^+y^)/vj^(zo +xsm9) -(x^ +j/^ )/uP(zt¡)
w{zq+ xsinO)
COS (f>[zQ + xsinO) — <f>{zQ) — kxsznO —1/ ■ n\ \ 7 ■ A k((xcosOy + y'^) ^ k( x ‘^ + y'^) 2R (zq + xsinO) 2R (zq)
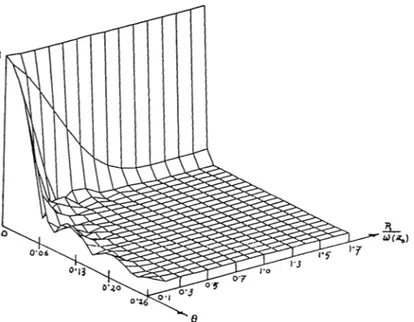
(2.49) Unfortunately, the above integral is not analytically integrable and hence must be numerically computed. In figure 2.11, this term is plotted as a function of angular misalignment 0 and normalized detector radius for a fixed w{zo) [see figure 2.10]. Moreover, at each point, the value of the interference power is normalized
CHAPTER 2. SELF-HOMOD YNE DETECTION FOR MULTIMODE LASERS 22
Figure 2.12: Contour plot of normalized interference power plotted as a function of 0 and —A-rw(zo)
by the ideal interference power (i.e. when 6 = 0) contained by the radius R. As can be seen from the plot, the interference power varies crucially as a function of misaJigimieiit angle 0 ajid detector radius R. The general trends are that even for very small angles of misalignment, the interference power term vanishes to zero as the detector area gets arbitrarily large and that the tolerance of the interference power term to angular misalignment is particularly narrow. An angle of approximately 0.25° between the signal and LO beams is enough to reduce the power to negligible level. But what is interesting is, for a fixed angle, the interference power does not linearly go to zero as R increases. It passes through a few peaks and troughs as R increases before it eventually drops to zero. The reason behind this phenomenon wiU be explained in the next paragraph. For now, let’s note that for a certain angle of misalignment, a detector with smaller surface area can do better than a detector with a larger surface area and will almost always outperform a detector with a very large area. But if the angle can be kept to zero or a value venj near to zero, then a detector with a radius R = w{zq) will be adequate to contain most of the interference power. The contour plot of the normalized interference power term is shown in figure 2
.
12.
Ex])eiimcnUtJly, visual iiispccUou, if j)ossjl)io, of the inloriorciicu jja.Ucni of tlic local oscillaJor and t.lio signal iiolds can bn a. very good indica.Uon o( I ho precision of align 111<'пI. a.clii('Vf'd. In iignro 2.1.'!, ('nhuged pliol ograplis ol in I (т(оп'П( (' pal. IXM'iis are shown. The interference frattern shown in figure 2.1-·].a 1Ч'Ге1'я lo the case
when the beams are misaligned by an angle of 0.17.1,8°. In figure 2.i;j.b, where the misalignment is reduced to 0.0859°, the fringes get further apart. Finally, 2.l;3.c shows the interference pattern when the angle of misalignment is 0.0.'] hl°. As can
с и л I>TKIl
2
. SBJ/F-HOMODYA’I·: Dl-yrECTlON FOR /V/ VLTIMODF LASFUS2
:]a) b) 0
Figure 2.13: Photographs of interference patterns for three different angles of mis alignment: a) shows the interference jrattern when the angle of misalignment between the LO and signal beams is 0.1718°, b) shows the interfei'cnce pa.ttern wlien I he angle of misalignment between the LO and signal bea.rns is 0.0859° a.nd c) is for an angle of misalignment of 0.0344°.
be seen, the interference jrattern consists of oidy a. few fj'ingi's. (fomputei· plots of ijiterference patterns for the same angles is shown in figures 2.14, 2.15 and 2.16. The corresponding contour plots are shown in figures 2.17, 2.18 and 2.19. As can
CHAPTER 2. SELF-HOMOD YNE DETECTION FOR MULTIMODE LASERS 24
Figure 2.14: Computer plot of interference pattern for 0 = 0.172°
l)c .sci'ii fmiii iigiiiT.·; 2 .N , 2 .1 ;i.ihI 2 .1 (i, the siippiCMScd siiiii.'ioiil like lulic.s arc .syin metrical along the axis of misalignment [the x axis in figure 2.10 ] on the detector surface. Moreover, the number of lobes in tlic interference pattern increases as the angle of misalignment grows. These sinusoidal lobes are a direct consequence of the cosine term in the expression of in equation 2.48. The interference power term which is obtained by integrating the interference pattern over the detector surface averages these sinusoidal lobes. As a consequence, the worse the misahgnment, the more wavy is the interference pattren, and hence, the lower the integrated power. Moreover, for a fixed angle of misalignment, as the detector radius R increases, the number of complete lobes contained by it changes and hence the power falls to zero in a suppressed sinusoid fashion. In any case, the photographs and computer plots comply with each other very closely. Tt should be menlloned that In ch'a.rly see the interference patterns, the LO power was attenuated to signal power levels.
It should be also noted that the penalty paid for axial misalignment is more if the fields are horizontally polarized than when they are vertically polarized. Let’s suppose, for simplicity, that the LO field is a plane wave slightly offset from the
CHAPTER 2. SELF-HOMODYNE DETECTTON FOR. MULTIMODE LASERS 25
I‘'igiii(? 2.15: Comj)iiLcr plot of iiiU;iTc’ronco pa.U.eni for 0 = 0.08G°
CHAPTER 2. SELF-HOMOD YNE DETECTION FOR MULTIMODE LASERS 26
Figure 2.17: Contour plot of interference pattern for 9 = 0.172°
CHAPTER 2. SELF-HOMODYNE DETECTION FOR MULTIMODE LASERS 27
Figure 2.19: Contour plot of interference pattern for 9 = 0.035°
2: axis towards the positive x axis by an angle of 6^ and is expressed as
U where fx^ is the x component of the spatial frequency
/ = 1/A. The signal field, on the other hand, is slightly offset from the z axis to wards the negative x axis by an identical angle of Ox and, in turn, can be expressed as U _ Xhe orientation of the fields is shown in figure 2.20. The interference term which is of prime interest in homodyne detection is[ll]
UiNT = Wl o * . (2.50)
Now, if the field amplitude terms Ulo Us are vertically polarized, i.e. the direction of the corresponding electric field vectors are out of the page, then the interference term becomes
U iNT - “^Ul oUs cos(4Tr/roX + $ ¿ 0 - $ s) · (2.51)
Wliereas, for the held amplitude terms horizontally polarized, i.e. the electric held vectors lying on the plane of the page, we get an extra cosine term which diminishes the amplitude of the interference term,
CHA PTFAl 2. SFLF-JIOMODYNE DFTFCTION FOR. M IJI/I'IMODF LASERS 28
Figure 2.20: Simplilied model of axial misalignment
So, we can conclude that for tlie same degree of a.xial misalignmeni, the horizontaJl^' polarized leg of the composite field coming out of the polarizing beam splitter PBS2 in figure 2.5 will suffer more loss than the vertically polarized leg.
C h a p ter 3
R e su lts
3.1
A m o u n t o f H o m o d y n in g O b tain ed in th e Lab
In section 2.4 we saw that the mean value of the total photocletector current in double detector configuration is i{t) = 2 7 l y / This implies that if this current flows tlirough a load resistance of Rfl, and if binary Amplitude Shift Keying is employed to modulate the signal beam Ps = Ph representing a logical high and P^ = P i representing a logical low, the voltage vu across the load resistance corresponding to a logical high is
vh = 2RTZ^yPioPH (3.1)
whereas, the voltage corresponding to a logical low is
v i = 2RTZy/PioPL ■ (3.2)
The photodetectors used in the experiment has the fastest response time with 50ii load resistances. Their responsivities are approximately 0.427 A /W . This practically measured value of responsivity is somewhat higher than the value obtained from the responsivity curve provided in the data sheet (0.38 A /W ). Consequently, with a local oscillator power of 2mW and Pjj and P i equal to 10/iW and 0.5/.iW respectively.
VH - V I = 2 i 7 7 г V ^ ( ^ / ^ - ^ / ^ )
=
2
X50
1
)
X0
.
427
/
1
/
11
'·
x( / l o / f W
-/ l / / , l T )
= 5m F (3.3)
CUAPTEii 3. RESULTS 30
y A / s n m m i :s i w s r \ r
JOmU ^ilOmV g, 200n$%
Figure 3.1: Homodyne detection of signal field
For the same local oscillator and signal powers employed in the lab, the value of
'^7/ - '^L obtained is very nearly equal to 5mV as shown figure 3.1. Figure 3.2
(h'picls (,lio I'csiilt of detecting the sa.nu' sigiia.l in
ab.s(Mic('of
t l i( ‘ lo c ;d o s c i l l a I oi·ii('ld
i.e. direct detection. As is visible from the figure 3.2, direcf detection drastically
fails to detect the signal field and hence, we see only noise on the oscilloscope. The
sigiia.l (hhected in presence of the local oscillator field is shown in iigui’e 3.1. The
waveform in the middle corresponds to the double balanced detector output while
the waveforms at the top and bottom correspond to the signals separately detected
by the photodetectors. So, it can be safely concluded that the hornodyning obtained
in thc‘ la.b v(u-y closely follows th(î theoi'etica.l ca.lc.ula.tions.
3 . 2 N o i s e C a l c u l c i t i o n s
It is expedient to know the noise sources in the receiver and their types before
getting into noise calculations. The expression for the autocovariance of the signal
which was derived in Chapter 1, consists of all the noise terms inherent aiid/or
CHAPTER. 3. RESULTS 3 i
Figure 3.2: Detection of signal field in absence ofloca! oscillator
a.(l(l<‘(l 1.0 l.lic rccci\('|·. 'I ’lir ('.xprr.ssioii i.s r('|)ca.l,c(l below ;
I C- JL u) --= [r/7e (^Plo + ./\-|k(Z)||2 + 2 ^ ( P L o P s ) R e U ( n ) ) I- <llu -f 2/,;7y /,>] (3.1) wliere
(fJZPio is
shot noise Cciused by the local oscillator. It is directly proportional to
the LO power and is usually the dominating noise term in coherent detection
systems. For instance, for lOmW LO signal power, it will cause a noise level
of 6.83
Xfor the photodetectors used in our experiment.
(lTlPs\\l{^)\\^
is the shot noise caused by the signal. If the average signal power
Ps —
A||:s(OlP equals 5/iVV, it will have a value of 3.42 x 10“ ^^^/l^///2 which
is negligible compared to the LO noise.
qlo
is the shot noise term caused by the dark current Ip of tlie pliotodetector.
The photodetectors used in the experiment had average dark current values of
1.5
XThis corresponds to a noise level of 2.4 x 10"^^/l^///.r which is
CHAPTER 3. RESULTS 32
2kT/ R is the thermal noise current produced by tlie load resistance R. For a 50ii load resistance this corresponds to a noise of 1.656 x It should be noted that this is the only noise component comparable to the noise contributed by the LO .
The noise level shown by the HP network analyzer with its input short circuited is l20dB iii/llz with a resolution bandwidtli of lOOllz. This noise level, when converted to the A'^/Hz unit above, corresponds to a noise level of 2 x / Hz. As can 1)(‘ seen, thc‘ nois(' of t l u‘ a.iialyzc*r is liigher tha.n t he highest of the rc'cc'iver noises by a magnitude of 10^. Hence it was not possible to make precise measurements of the noise levels.
C h ap ter 4
C o n clu sio n
The purpose of the lliesis, as is exj)la.ined in tJie introduction, was to gain hands- on experience in im|)leinenting oj)tica.l honiodyne detection receivers and related practical issues. As such this thesis will serve as a guideline for those who will work in the optics lab on experimental issues. As mentioned there, there is an acute lack of relevant information in the literature about down-to-earth practical problems involving optical set-ups. While constructing the experimental set-up of the self- hoinodyiK' d('L('(‘Uon, w’o ca.iiK' a,cross pra.clica.l problems whose' soliilioiis a.ro not menlioncd anywhere but which are of utmost importance for the proper functioning of the receiver. Hence, such an exercise in implementing a coherent detection set-up was both necessary and useful. For instance, one of tlie major practical problems faced in the laboratory was the misalignment of the signal and local oscillator beams incident onto the photodetector surface. It is seen that severe mixing losses can occur due to minute misalignments of the beams. To secure a homodyne mixing of no less than 50% of the ideal case, angular deviations of only a few tens of micro radians are tolerable.
The other major practical limitation was the relatively short coherence length of multimode lasers. But it is seen that if we design our system keeping the reduced temporal coherence of multimode lasers in mind, very satisfactory porforjnance in terms of homodyne a.m|)liiication can be obtained even at relatively low local oscil lator power levels.
As a future topic of research, feasibility of receiver configurations employing
CHAPTER 4, CONCLUSION 34
phase diversity techniques for multimode lasers can be investigated. As was explained
ill ( (‘Г 2, I.Ik' m a jo r «Ira w b n rk o f 1.1k' se lf lio m o d y iK ' s(‘l ii |> I Ik' .s i k)i l ro lK 'i i'iic c li o f m u ll ¡пин1(' l;is('i*s w liirli Ьг( мıı·;lı I. ;il)o iil I he г( n I (li<‘ .'¡irn.il ;im l
LO beams take paths diiiering from each other by no more than a distance of 5cm. By employing the technique known as phase diversity[7], tlie path difference between the beams can be varied arbitrarily with a penalty of less than 3 dbs. This means that transmission of signals through optical fiber could be incorporated for either or both of the beam paths. What is basicahy done in phase diversity is that one of the polarization components of the LO beam ( it сгш be the signal beam as well) is phase shifted from the other by an angle of 90^ at the receiver front-end. The advantage is that by using a detection configuration very similar to ours, the cosine component of the phase is detected by one photodetector while the sine component of the phase difference is detected by the other. Hence, even if there is no phase correlation between the signal and LO beams, the signal beam can be continuously detected
by ()1 lh<‘ Uvo (h*l(‘( l.oi’s in d ou b le (let(‘c(.¡(Ui c o n l i g i i a n d a.()()ropiia.((‘1 у
processsed later[3].
Work also need to be done to find a more accurate model of multimode lasers taking into consideration the excess noise introduced in the system by the random power fluctuation among the modes. A more appropriate model of multimode lasers would directly translate to better receiver designs and more sensitive'systems.
A p p e n d ix A
q -p a ra m eter C a lcu la tio n s for
G au ssian B ea m s
Any Gaussian beam can be completely cliaraclerizeci by what is known as its q parameter[14]. The q parameter which is a complex composite of the beam radius w and radius of curavature R can be written as[10]
1 _ 1 _ j X q{z) R{z) TTiu{zy^ *
The evolution of a Gaussian beam through free space or any lens system is deter mined by calculating the transformation of the q parameter after passing through the medium. If A^B^C\D are the elements of the ray matrix characterizing the medium, then the transformation can be described by
'^qini‘A i· l> q,n,i{
(-■qrni-A
I-where qin(^) qout{^) a.re respectively, the input and output values of the q pa rameter. The beam waist and the radius of curvature /?-o at the output of the He-Ne laser used in the experiment is specified by the manufacturer as 1.25±0.l7?rm and CO respectively. Assuming that the exit apperture of the laser is situated at z — Q, the value of the q parameter at z = 0 is
— = --- . (A.3)
i(0 ) 7rio(0)2 ■ ’
On the other hand, if we define the length between ;? = 0 and lens LI as ¡i (see figure 2.5) and the the length between the lens Ll and photodetector surface P D l