PREDICTING PROBLEM-SOLVING SKILLS OF STUDENTS FROM DIFFERENT SOCIO-ECONOMIC BACKGROUND USING MATH-
AND SELF-RELATED VARIABLES
A MASTER’S THESIS BY
MERVE SEYREK
THE PROGRAM OF CURRICULUM AND INSTRUCTION ĠHSAN DOĞRAMACI BĠLKENT UNĠVERSĠTY
ANKARA OCTOBER, 2019 M E RV E S E YR E K 2019
Predicting Problem-Solving Skills of Students From Different Socio-Economic Background Using Math- and Self-Related Variables
The Graduate School of Education of
Ġhsan Doğramacı Bilkent University
by
Merve Seyrek
In Partial Fulfilment of the Requirements for the Degree of
Master of Arts
in
Curriculum and Instruction
Ankara
iii
ĠHSAN DOĞRAMACIBILKENT UNIVERSITY
GRADUATE SCHOOL OF EDUCATION
PREDICTING PROBLEM-SOLVING SKILLS OF STUDENTS FROM DIFFERENT SOCIO-ECONOMIC BACKGROUND USING MATH- AND
SELF-RELATED VARIBLES Merve Seyrek
October 2019
I certify that I have read this thesis and have found that it is fully adequate, in scope and in quality, as a thesis for the degree of Master of Arts in Curriculum and
Instruction.
---
Asst. Prof. Dr. Ġlker Kalender (Supervisor)
I certify that I have read this thesis and have found that it is fully adequate, in scope and in quality, as a thesis for the degree of Master of Arts in Curriculum and
Instruction.
---
Asst. Prof. Dr. Hilal Peker (Examining Committee Member)
I certify that I have read this thesis and have found that it is fully adequate, in scope and in quality, as a thesis for the degree of Master of Arts in Curriculum and
Instruction.
---
Asst. Prof. Dr. Zerrin Toker, TED University (Examining Committee Member)
Approval of the Graduate School of Education
---
iii
ABSTRACT
PREDICTING PROBLEM-SOLVING SKILLS OF STUDENTS FROM DIFFERENT SOCIO-ECONOMIC BACKGROUND USING MATH- AND
SELF-RELATED VARIABLES
Merve Seyrek
M.A., Program of Curriculum and Instruction Supervisor: Asst. Prof. Dr. Ġlker Kalender
October 2019
The purpose of this study is to examine relationships between math- and self- related variables and problem-solving skills of students on PISA 2012 Turkish sample. Students’ socio-economic status was used as a control variable. Turkish sample was divided into 4 groups using PISA’s ESCS index to create socio-economically different subgroups. The data were analyzed with hierarchical multiple linear regression in three blocks. The finding illustrated, firstly, socio-economic status gives positive association with problem-solving in each block. One of the mathematics factors is that self-efficacy has highly positive relationship with problem-solving. The other factors give different results for different social groups.
Key words: Factors related to problem solving, PISA 2012, problem-solving, socio-economic status
iv
ÖZET
MATEMATĠK VE BĠREYLERĠN KENDĠLERĠ ĠLE ĠLGĠLĠ DEĞĠġKENLER KULLANILARAK FARKLI SOSYO-EKONOMĠK DÜZEYLERDEKĠ ÖĞRENCĠLERĠN PROBLEM ÇÖZME BECERĠLERĠNĠN KESTĠRĠLMESĠ
Merve Seyrek
Yüksek Lisans, Eğitim Programları ve Öğretim Tez Yöneticisi: Dr. Öğr. Üyesi Ġlker Kalender
Ekim 2019
Bu çalıĢmanın amacı, PISA 2012 sonuçlarını temel alarak farklı sosyoekonomik düzeylere sahip olan öğrencilerin problem çözme becerilerine etki eden ilgili matematik ve bireylerin kendileri ile ilgili değiĢkenleri incelemektir. Öğrencilerin sosyoekonomik düzeyleri kontrol değiĢkeni olarak kullanılmıĢtır. Veri kümesi PISA veri kümesinde ESCS değiĢkeni kullanılarak dörde bölünmüĢtür. Söz konusu veri, hiyerarĢik çoklu doğrusal regresyon ile üç blokta analiz edilmiĢtir. Öncelikle,
sonuçlar sosyoekonomik statü ve problem çözme becerisi arasında her blokta pozitif iliĢki göstermektedir. Matematik faktörlerinden biri olan öz yeterlilik yüksek oranda problem çözme becerisi ile pozitif bir iliĢkiye sahiptir. Diğer faktörler farklı
gruplarda farklı sonuçlar göstermektedir.
Anahtar Kelimeler: BaĢarı ile ilgili faktörler, PISA 2012, problem çözme, sosyo-ekonomik durum
v
ACKNOWLEDGEMENTS
I would like to thank firstly Department of Mathematics and Science Faculty of TED University members who supported and motivated me during the dissertation
process, especially my dear colleague Gizem Güzeller.
Also, I am so grateful to Asst. Prof. Jennie Farber Lane to take time off to check to my thesis.
Additionally, I am so thankful to Asst. Prof. Dr. Ġlker Kalender, who is my supervisor. He kindly assists me throughout the process of writing this thesis. Also, I want to thank to my beautiful colleague: Elifnur Yazıcı, Elif Sarıgöz, Betül Barut and Tuba Oturan. Finally, I am so grateful to my sister to encourage me in my whole life.
vi
TABLE OF CONTENTS
ABSTRACT ... iii ÖZET ... iv ACKNOWLEDGMENTS ... v TABLE OF CONTENTS ... viLIST OF TABLES ... viii
LIST OF FIGURES ... ix CHAPTER 1: INTRODUCTION ... 1 Introduction ... 1 Background ... 5 Problem ... 8 Purpose ... 9 Research questions ... 9 Significance ... 9
CHAPTER 2: REVIEW OF RELATED LITERATURE ... 11
Introduction ... 11
Problem-solving skill ... 11
Socio-economic status ... 14
Factors that will be taken into account in this study ... 17
CHAPTER 3: METHOD ... 23
vii
Research design ... 23
Context ... 24
Sampling ... 26
Instrumentation ... 29
Method of data collection ... 32
Method of data analysis ... 33
CHAPTER 4: RESULTS ... 35
Introduction ... 35
Results of the regression analyses……….. 36
CHAPTER 5: DISCUSSION ... 45
Introduction ... 45
Overview of the study ... 45
Major findings ... 47
Implications for practice ... 51
Implications for further research ... 52
Limitations ... 52
viii
LIST OF TABLES
Table Page 1 Home possessions of the students in PISA 2012 ... 27
2 Means (standard deviations) of parental schooling ... 27 3 Percentage of ESCS groups according to their mother & father
education level ... 28 4 Descriptive of the variables ………... 31 5 Amount of variances explained by the models ... 36 6 The unstandardized and standardized regression
coefficients……….. 39
ix
LIST OF FIGURES
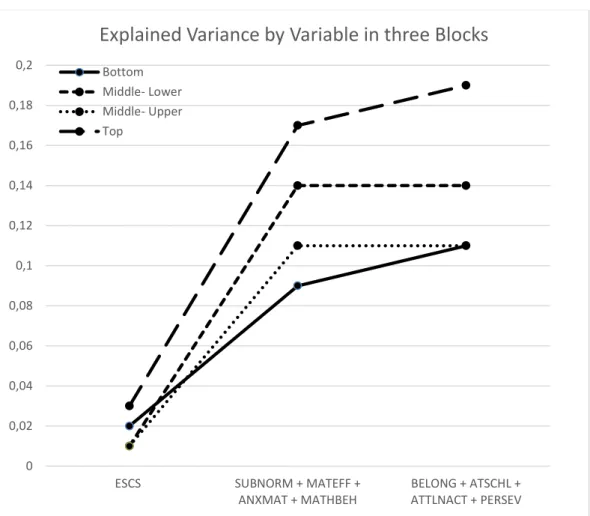
Figure Page 1 Histogram of ESCS for Turkey in PISA 2012 ... .. 25 2 Explained variance by variable in three blocks ... 38
1
CHAPTER 1: INTRODUCTION
Introduction
Education can improve a person’s intelligence, income, ability to adapt, and their overall productivity (Gölpek, 2015). In this way, societies’ well-being can improve step by step. According to Maatta and Uusiautti (2012), there is a direct relationship between well-being level and the quality of educational systems of the societies. Since the education is one of the key factors in individual and societal success, reforms to be done in the field of education are deemed important all over the world for any subject areas such as mathematics, science or reading. The aim of these reforms is to have better living conditions. Such initiatives related to education are expected to provide a more effective educational system (Aksit, 2007).
In any educational system, there are different lessons for students to be taught in many subject areas throughout their education lives. Among them, mathematics is probably one of the most important areas for students. Each individual needs knowledge of mathematics not only in school life but also in daily life. Albert and Antos (2000) focus on students' questions about mathematics during the lesson: why do we learn mathematics?, when do we use this knowledge? or how can we apply this subject in our daily life? For this reason, mathematics literacy is considered as important mathematics knowledge in today’s world.
2
Ojose (2011) states that having mathematics literacy does not mean deep learning core subject of mathematics such as calculus, linear algebra; however, it means comprehension and interpretation of mathematics in detail. In the view of such information, individuals are expected to be problem solvers using the subject area knowledge taught in schools. Actually, there are lots of opportunities to apply their mathematical knowledge in daily life.
First, mathematical operations are compulsory in trade, civic responsibilities and all demographic process. Also, when we are selling something, we can calculate
remainder of money with the help of mathematics knowledge. Chemists calculate the proportion of their materials that they use in an experiment by using mathematical operations. For this reason, mathematics retains its importance (Fauvel, 1991). Namely, students can obtain require knowledge in mathematics subject area to solve a problem in both their daily and academic lives. In this way, students again face with problem-solving skills in mathematics lessons.
In other words, mathematics also helps to improve problem-solving skills of
students. The literature shows that there is a strong relationship between mathematics performance and problem-solving skills of students. For example, Akyüz and Pala (2010) identified a strong relationship between them. When students have higher mathematical academic success, their problem-solving skills also is better compare to the other students. The fact remains that, there are different mathematical factors which influence both mathematics achievement and problem-solving skills.
First, literature supports the relationship between math-related factors and
3
and higher self-efficacy provide increase students’ mathematics achievement (Nicolaidou & Philippou, 2003). Özgen and Bindaka (2011) expressed significant relationship between mathematics achievement and self-efficacy factor in positive way. When the students have higher self-efficacy, they have higher mathematics achievement. Also, there are different math-related factors which influence problem solving skills as above-mentioned.
Second, the relationship between math-related factors and problem solving skills is located in the literature. Perels, Gürtler, and Schmitz (2005) identified a possible effect to improve problem-solving skills when the students use their self-regulatory skills. This skill includes self-efficacy as a parameter. Also, Hoffman (2010) described that self-efficacy and mathematics anxiety play a key role in problem-solving. On the other hand, Scherer and Gustafsson (2015) defined a positive
relationship between performance in problem-solving and self-characteristic factors: openness, perseverance, attitudes towards schools in positive way. It means when students have higher perseverance, they have higher problem-solving skills.
However, meaning of problem and problem-solving gains importance because of the fact that there are different approaches in the literature.
First, while attempting to solve a problem, a definition of the problem is the first step and solving problem is next step to find a solution. A problem is defined as the path to reach a desired goal and it consists of similar or different sub-problems
(Carbonell, 1986). There also different definitions proposed in the literature. According to Duncker and Lees (1945), if someone does not know how to reach a solution in a given situation, this situation can be called a problem. On the other
4
hand, Dostal (2015) explained the progress of experiencing human being in difficult and obstacle situations which is called as a problem.
There are many types of problems defined in the literature such as open-ended and close-ended, traditional and non-traditional, application and non-application, routine and non-routine problems (Zhu & Fan, 2006). Problems are not solved immediately if the students are not familiar with the solution pattern. On the other hand, when the students are familiar with the problems, they can solve in a short span of time. Problems are divided into two groups as routine and non-routine. Problems which are called as routine can be clarified as exercises that students are familiar with, while non-routine problems require creative thinking skills and sometimes closer investigations because of having unfamiliar solution way (Özcan, 2016). For this reason, when students have problem-solving skills, they can easily reach the solution. According to Polya (1945), there are four fundamental principles to reach a solution by using problem solving skills: “understanding the problem, devising a plan, carrying out the plan, and looking back” (p. xvii). These abilities can be taught equally for the students at school. Unfortunately, not every student has similar opportunities to gain problem-solving skills in their daily lives. Namely, there are some factors which affect the development of these skills negatively.
Organizational for Economic Cooperation and Development (OECD) (2013a) states that having weaker and poorer mathematics skills including problem-solving skills is associated with welfare level of nationals and socio-economic status (SES) that is a significant indicator of welfare (Conger, Conger, & Martin, 2010). Similar findings were reported in the literature (Berberoğlu & Kalender, 2005). Thus, socio-economic
5
status of students is seemed to be significant predictor of students’ performance. Although the relationship between math-related variables and problem-solving skills is known from the research studies (Pajares, 1996; Pajares & Kranzler, 199; Pajares & Miller, 1994), the question of how this relationship differs with respect to socio-economic status remains unanswered. This is an important question since the effect of socio-economic status is obvious in explaining students’ performance in many countries.
The aim of this study is to analyze the relationships between problem-solving skills of students and several math- and self-related variables by using PISA 2012 results while controlling for socio-economics status of students. To this end, an international benchmarking study, Programme for International Student Assessment (PISA), may be helpful since it provides a huge data set including information about students and other stakeholders in education.
From past to present, the achievement of Turkey has under the average performance of OECD countries in PISA (TaĢ, Arıcı, Özarkan, & Özgürlük, 2016). However, Turkey is placed near the top in terms of the students who are successful in spite of a lower socio-economic status.
Background
There are so many research studies in literature related to math-related variables but only few of them deal with problem-solving skill. One such study is a study
performed by Akyüz and Pala (2010). They identified a significant relationship between mathematics literacy and problem-solving skill of students. Students who
6
have parents with higher education levels were reported to have higher problem-solving skill and mathematics literacy. Also, according to this study, sense of belonging and attitudes towards school does not influence on problem-solving abilities.
Similarly, Lemke et al. (2004) studied the relationship between mathematics literacy and problem-solving for United States by using PISA 2003 results and found
statistically significant relationship between them. Thomson, Cresswell, and De Bortoli, (2004) did not find any association between gender and problem-solving performance in Australian students. Additionally, as Al-Rsai (2013) explained, computer-based games affect students to improve thinking and problem-solving skills in positive or negative way.
There are many studies about problem-solving skills and the students both having lower-higher socio-economic status separately in Turkey and also the world. For instance, Schulz (2005) examined the effects of students’ social background as socioeconomic status on achievement with PISA 2000 and 2003. Some of the students have academic achievement in spite of having negative conditions in social life. OECD (2010) also shows a relationship between socio-economic status and performance. Additionally, Perry and McConney (2010) analyzed the relationship between SES and academic performance of the students by using PISA 2003 results. According to the findings of this study, students’ achievement and SES are directly associated with each other. Also, the mean SES of the school is influence on students’ performance regardless of individual SES of the students.
7
Anderson, Lin, Treagust, Ross and Yore (2007) compared PISA 2000 and 2003 results to identify the extent to which mathematics performance affects the
performance ın the other subject areas across participating countries. If a country has higher/average mathematics scores, it has also higher/average score in reading, science and problem-solving. The same study also revealed that, mother’s
educational background has a direct relationship with students’ performance in PISA 2000 results in this study.
In some studies, mathematics literacy of various countries is compared based on years to improve it (Stacey, 2011). Conversely, some researchers investigated mathematics performances of students to see if there are any differences between mathematics related factors in terms of their effects in different countries. One such study is an article by Lee (2009) studied on math self-efficacy, math self-concept, math anxiety for 41 countries in PISA 2003. The results illustrate that some Asian countries have high mathematics performance despite of high math anxiety and low math self-efficacy, math self-concept. On the other hand, some western European countries have also high mathematics performance and low math anxiety, high math self-efficacy and math self-concept unsurprisingly. Similarly, Baysal and Erkan (2012) carried out a similar study comparing how mathematics literacy varied across school types and regions by comparing PISA 2003, 2006, and 2009 results in the field of mathematics. According to the findings, the most successful school in PISA 2003 and PISA 2009 was to High School of Sciences in Turkey. Despite of that result, the most successful school in PISA 2006 was to Anatolian High School. On the other hand, the least successful school showed changed from year to year, General High School Primary, High School of Multi-Program Primary, and
8
Vocational High School Primary, respectively. Additionally, Goh (2006) revealed a positive relationship between teacher support, motivation, student-teacher
relationship and students’ performance in mathematics.
Problem
There may be a variety of reasons why students in Turkey have low problem-solving skills. Mean in PISA 2012 for Turkey has illustrated 454 mean score despite of that OECD average mean is 500 mean score in terms of problem solving performance. 35.8% of the students which were attended to PISA from Turkey shares in lower achievers. In spite of that, 2.2% of the students is in top performers (OECD, 2014c). There is still a further need to investigate how different levels of socio-economic status may affect students’ problem-solving skills. Other variations among the factors (e.g., self-characteristics and math-related factors) can provide insights into student performance as well problem-solving is one of the most important skills that individuals should be in their daily lives. Yet, the literature generally focuses on problem-solving skills and socio-economic status separately. Hence, there are not enough studies which include both problem-solving skills of the students and their different socio-economic status in the meantime, especially for Turkey. To this end, several variables were selected from the literature focusing on the relationship
between problem-solving skills and achievement in mathematics (Lemke et al., 2004; Martin, Liem, Mok & Xu, 2012; Nicolaidou & Philippou, 2003). In this study, these factors are categorized into three groups: self-characteristic (perseverance, belonging to school, and attitudes toward school), background information (SES), and several selected math-related factors.
9
Purpose
The purpose of the study was to examine the relationship between the problem-solving skills of Turkish students and selected factors across different socio-economic groups. The PISA factors that were investigated were background information (socio-economic status), math-related factors, and self-characteristics. Math-related factors were mathematics anxiety, mathematics behavior, subjective norms in mathematics, and mathematics efficacy, and, the variables about self-characteristics were students’ attitudes towards school, sense of belonging and perseverance. These factors were investigated for all four socio-economic groups created by the researcher in relation to their problem-solving skills.
Research questions
1. Is there any relationship between the problem-solving skills of Turkish students on PISA 2012 and the following variables across different SES groups?
i. Socio-economic status
ii. Math-related variables (mathematics anxiety, mathematics behavior, subjective norms in mathematics, and mathematics self-efficacy)
iii. Self-related variables (sense of belonging, attitudes towards school, and perseverance)
Significance
Findings in this study may be of interest curriculum developers as they may consider the results during curriculum development process. Researchers can also benefit from this study since it may open new research venues regarding different
socio-10
economic groups of the students. They can use how to influence on problem-solving with different factors in their research studies. Additionally, teachers can benefit as they often have students with different socio-economic status. The teacher can create new teaching and learning skills to improve students’ problem-solving during the lessons with the help of these results in this study.
11
CHAPTER 2: REVIEW OF RELATED LITERATURE
Introduction
There are two significant key words in this thesis: problem-solving and socio-economic status. The following review of the literature was conducted to better understand how other researchers have investigated the relationship between problem solving and achievement levels of status of students will be taken into consideration.
Problem-solving skills
A problem is defined as existence of situation which has no direct solution for people (Duncker & Lees, 1945). Additionally, definition of "problem" is described by Mayer and Wittrock (1996) as a situation in which someone has a goal, however, do not know how to reach it. At the same time, creative thinking during problem solving arises so as to build a bridge between the existences of expected goal with this
situation. This negative situation is not solved immediately with the established knowledge. For this reason, problem solver may not reach solution directly so that we can mention a “specific problem”. Besides that, Mayer (1990) defines “problem solving” as a cognitive process to be applied so as to achieve a solution when there is no certain way. Additionally, Dostal (2015) explains that problem solving is an evaluation process between already present knowledge and current situation for new problem to be appeared.
12
Also, Lester and Kehle (2003) described problem solving as coordinating previous knowledge, reinterpreting familiar pattern, and generating new ways to reach
solution with the help of inference in the consideration of experiences. Students have difficulties regarding problem solving process, according to Newman (1983) can be reading part, comprehension, transformation to knowledge, process skill, strategy know-how, and solution. In addition to that, Schoenfeld (1985) stated four categories which problem solvers have better problem solving skills. First of all, they have to have mathematical knowledge in deep. After creating a basis, the other step includes heuristic knowledge to solve the problem successfully. The third category is that making decision skill which strategies is suitable to apply. The last one is that students have emotional factors while facing a problem.
Kaur (1997) also stated that problem solvers require to manage and to coordinate from special to general knowledge throughout solving problem. He suggested overcoming the difficulties in problem solving that one of them is to ask different questions for students at different schooling level and the other is to ask the same questions at different level that students use various solving strategies. Törner, Schoenfeld, and Reiss, (2007) suggested that the meaning of problem solving can change from the country to the country.
Problem solving skill is necessary to reach a solution of the problem directly or indirectly. For this purpose, after defining the problem, problem solving skill gains importance to obtain the result. This ability is gained through different ways such as facing real life problems, or solving a problem in mathematics. Problem-solving which is a core subtopic for mathematics, can be separated into two categories:
13
routine and non-routine problems (Zhu & Fan, 2006). Although exercises are included in routine problems, non-routine problems consist of real life problems which are more challenging.
The solutions to routine problems are generally known beforehand. However, the solutions of non-routine problems are not known as they are frequently encountered for the first time (Özcan, 2016). Hence, they are more challenging to solve
immediately. In this particular, problem-solving skills are important for addressing these novel challenges.
Reiss and Törner (2007) ensured an extensive history of problem-solving from the point of mathematics education and psychology. The significance of problem-solving was first understood at the beginning of the twentieth century (Hunt, 1994).
Mathematics has generally included routine problems in the past. However, mathematics has started including real life problems. Since then this issue has constituted the fundamental of the mathematics lessons in every grade level. Furthermore, this article refers to the place of problem-solving in cognitive psychology in terms of attitudes and emotions (Reiss & Törner, 2007).
Although routine problems can be seen as an exercise, non-routine problems are more difficult as we face with such problems for the first time. Being stressful and insecure influences on how an individual deals with non-routine problems in their lives. In this regard, while problems are being solved, psychological situations are also important to decide purely, especially in non-routine problems. In other words,
14
emotions influence our situations. In this way, attitudes towards: problem solving is also affected by our emotions.
As the above-mentioned, problems, especially non-routine problems type, develop our critical thinking abilities. Hannula (2015) investigates problem-solving in terms of emotions, namely the importance of students’ emotions while solving non-routine problems. The students are affected by stable emotional traits and changing
emotional states in their problem-solving behavior. This aspect is important in terms of defining achievement in mathematics. The most important aspect of emotions derives from socio-economic status as they can define the emotions. For this reason, this study gives values socio-economic status groups.
Socio-economic status
Socio-economic status (SES) consists of various indicators such as income,
educational level or occupational level, family background, environment, social and psychological level (Hackman & Farah, 2009). For this reason, SES provides information about students’ background. Research shows us that there is a strong relationship between socio-economic status and academic success (Sirin, 2005). Similarly, McConney and Perry, (2010) suggest that school SES has also affected students’ academic achievement in mathematics and science.
The research illustrates that there is a positive relationship between economic, social and cultural status and mathematics achievement. In the literature, Yang (2003) worked on different dimensions of socio-economic status (SES) such as the
15
mean of the school. As the findings of this study, there is strong association between each SES dimension and mathematics achievement. Similarly, our study is used four different socioeconomic groups to compare the relationship between socioeconomic status and problem-solving skills. On the other hand, which factors influence
problem-solving skills is also important in this study.
Additionally, Demir, Kılıç, and Ünal (2010) studied which students’ and schools’ characteristics effect on mathematics achievement. The results demonstrated that students who have better economic, social, and cultural status have higher
performance in mathematics achievement. One such example is Brooks-Gunn and Duncan’s (1997) research on the effects of poverty on children’s academic success. The results show that children outcomes, achievement, behavior and health are largely influenced by socio-economic background of their families. According to the study, other family characteristics such as family income, female headship, mother age also correlates with socio-economic status and students’ achievements.
Additionally, Reardon (2011) stated that there is a huge gap among the achievement of students depending on their income level. On the other hand, Bradley and Corwyn (2002) identified that health, cognitive and socio-emotional outcomes are as a whole associated with socio-economic status. Thus, socio-economic background of the students influences students’ performance (McCconney & Perry, 2010; Schulz, 2005; Sirin, 2005).
Also, the study of Straus (2014) is to express the relationship between Canada, Slovenia, Germany, and the United States except Turkey and mathematics
16
achievement. Economic, social, and cultural status is a significant predictor of achievement in mathematics in a positive way. However, it accounts for only a fraction of mathematics achievement. On the other hand, OECD report (2013a) shows us that socio economic status is much more influential on mathematics
performance than problem solving performance based on PISA 2012 results. Another study by Marks (2006) focuses on to what extent academic achievement is affected by school location and home environment based on socio-economic background of the students by using PISA 2000 results. He concludes that there is relationship between achievement of the students and social background in terms of school and home location. Another study by Willms (2010) states that there is a positive
relationship between literacy skills and social background from many aspects such as family background, students’ ability, and differences between schools using with PISA 2006 results.
Similarly, Kalender (2015) examines the relationship between the students having lower and higher socio-economic status in relation to their success in reading
literacy. The following five variables were taken from PISA 2012: Attitude towards learning at school, attitude toward school, and perceived control, student-teacher relations, and the sense of belonging. Findings indicated that high achieving students with low socio-economic status showed more positive attitudes towards schools and teachers in comparison to the students having highest socio-economic status.
However, this article does not include problem-solving skills and attitudes from PISA 2012 results. In this way, it will provide a humble contribution to the literature by filling the above mentioned gap to some extent.
17
Factors that will be taken into account in this study
This thesis focused on nine factors. One of them is called economic, social, and cultural status. Another four of them are related to mathematics such as subjective norms in mathematics, mathematics anxiety, mathematics behavior, and mathematics self-efficacy. The remaining four of them give general information about students: self-characteristic variables which are sense of belonging to school, perseverance, and lastly attitudes towards the school: learning outcomes and learning activities. On the other aspect, the other factor is subjective norms in mathematics. It defines whether students’ parents and peers enjoy with mathematics or not. According to the students’ answers for the questionnaire, subjective norms in mathematics have not significant predictor on mathematics literacy (Arikan, 2014). Conversely, Koğar (2015) identified that subjective norm in mathematics has negatively impact on mathematics achievement in opposition to the study of Arikan (2014). In addition to that, Özberk, Kabasakal and Öztürk (2017) also confirmed that there is a negative relationship between subjective norms in mathematics and mathematics
achievement.
Another important factor related to mathematics is mathematics self-efficacy which is a part of mathematics self-beliefs. The literature shows us self-efficacy is the most powerful predictor for problem-solving and mathematics achievement in a positive way. The research of Nicolaidou and Philippou (2003) deals with self-efficacy in problem-solving. The results clearly illustrate that self-efficacy has a higher positive correlation obviously. Addition to that, Koğar (2015) illustrates that mathematics self-efficacy has the strongest relationship with mathematics literacy. Another study by Lee and Stankov (2013) supports this result with the help of PISA 2003 result. It
18
includes 15 different fundamental variables from PISA such as self-beliefs, motivation and attitudes toward school. Namely, self-efficacy is an invulnerable factor to explain mathematics achievement by a long way. Besides, Özgen and Bindaka (2011) researched the relationship between mathematics literacy and self-efficacy with 712 high school students who are from different high school types. The finding of the study indicates that self-efficacy is a significant predictor for
mathematics literacy.
The other math related factor is mathematics anxiety. It is related to emotional reactions about mathematical problems. When the students do not feel safe during solving problem in daily life or academic issue, they can feel anxiety and stress. Thus, math anxiety is described as reaction in a negative way toward mathematics (Ashcraft & Ridley, 2005).
Koğar (2015) stated that mathematics anxiety is predictor for mathematics achievement with negatively. In addition to that, Özberk et al. (2017) studied on which factors have effects on mathematics achievement. As a result of this, mathematics anxiety shows us as statistically significant value in a negative way. Also, the largest effect belongs to mathematics self-efficacy positively in the study. Hogan, Lee, Luo, and Stankov (2012) reveal that mathematics achievement has a negative association with mathematics anxiety.
Kalaycıoğlu (2015) examined the influence of socioeconomic status, self-efficacy, mathematic anxiety on mathematics achievement by comparing different countries including Turkey with PISA 2012 results. The results help us understand that self-efficacy has a considerable effect on mathematics achievement in the countries
19
mentioned-above. Turkey has especially the most influence of mathematics anxiety on mathematics achievement compared to the other countries which are academically successful in mathematics. Furthermore, mathematics achievement is influenced by socio-economic status according to the result of this study.In this research, the last mathematics self-belief is mathematics behaviours. It is explained as students’ responses about mathematics in school or outside of the school.
Koğar (2015) identified also a finding about mathematics behaviours as negative correlation with mathematics literacy. Similarly, Sahin and Yildirim (2016) reported that mathematics literacy has negative association with mathematics behaviours. Academic success cannot only be explained with students’ individual performance. Achieving requires academically different properties for the students. One of the properties is the sense of belonging to the school. This factor influences students’ academic motivation, raising students’ hand for the right to speak, taking part during the lesson or engagement (Goodenow & Grady, 1993).
According to PISA 2012 results, sense of belonging to the school is not an explanatory enough indicator as both 85% of advantaged students and 78% of disadvantaged students gave the same answer as “I feel like I belong at school” (OECD, 2014b). The study of Ministry of Education in New Zealand indicates that the link between sense of belonging to the school and students’ performance does not show a strong relationship in PISA. Because the students both having low and high achievement levels chose the same answer: "I feel lonely at school" (OECD, 2004).
20
One of the studies about sense of belonging in Peru illustrates that sense of belonging to the school is positively related with achievement in mathematics (Cueto et al., 2010).
Additionally, in Burge and Sizmur (2015) study, sense of belonging to the school and attitudes towards school were taken into consideration. The results illustrated that there is a statistically significant relationship between science achievement and problem solving. However, although there is a positive correlation for attitudes toward school, it is negative for the sense of belonging in parallel with our results. When the students have lower sense of belonging to the school, the students have higher achievement in problem solving. It does not make sense; but PISA report also suggests that the explanation of the reason is difficult.
In addition to this, Saarela and Karkkainen (2014) conducted a research to identify different factors for four clusters to mathematics achievement and socio-economic status. Two of these factors are attitudes towards school: learning outcomes and learning activities. According to the study, the students have highly positive attitudes towards school: learning outcomes and learning activities without clustering.
However, after taking socially disadvantaged and advantaged into account,
mathematics achievement and groups give negative correlation for attitudes towards school: learning outcomes and learning activities. This study was applied especially for combination of cluster 2 and 3 as level 3. As a result of that, the results give negative correlation for both attitudes towards school: learning outcomes and learning activities.
21
In another study, Demir, Kılıç, and Depren (2009) prepared a research to discover factors that have an effect on mathematics achievement in PISA. The study focuses on both attitudes towards school: learning outcomes and student-teacher relations as school climate factor. The new factor shows us highly negative correlation with mathematics achievement.
Ministry of Education of New Zealand revealed that attitudes towards school can have both positive and negative association with mathematics achievement based on PISA scores. For this reason, there seems to be no clear link between them (OECD, 2004). Another factor is related to self-variables. Perseverance was first included in PISA 2012. OECD median of perseverance is 0.80 and although Greece, France, Italy among OECD countries have values of under OECD median, the result of Turkey is also 0.80 among OECD countries (OECD, 2014b). In this study,
perseverance was suggested to have a relationship with problem solving skill just for bottom quarter. The other groups do not have statistically significant difference among them.
First of all, Scherer and Gustafsson (2015) researched the effects of openness and perseverance in creative problem solving by using PISA 2012 results for three countries: Australia, Norway, and Singapore. The study gives positive association between problem solving and perseverance. Another study by Arikan (2014) goes over the role of different factors from PISA on mathematics performance in Turkey. According to this study, perseverance, mathematics self-efficacy, mathematics anxiety, and mathematics behaviours are significant variables. However, there is no statistically significant difference for subjective norms in mathematics. Mathematics
22
behaviours, mathematics anxiety, and perseverance have negative correlation with mathematics performance of the students. Nevertheless, mathematics self-efficacy has strongly positive correlation on mathematics performance.
Besides, Güzel and Berberoğlu (2010) worked on different variables to identify the effects on mathematics literacy. Some of them are related to this study. For instance, self-efficacy and anxiety in mathematics, also sense of belonging at the school. By the end of the study, these factors are called as statistically significant factors for mathematics literacy skills. The strongest relationship in the study is between self-efficacy in mathematics and mathematics literacy. Also, students have positive responses in mathematics when they have both low self-confident and higher anxiety in mathematics.
Similarly, Thien, Darmawan, and Ong (2015) studied which factors affects mathematics performance with PISA 2012 results for three countries: Indonesia, Malaysia, and Thailand. They claimed that mathematics anxiety and mathematics behaviour have negative effect on mathematics performance for Indonesia. However, mathematics self-efficacy and attitudes towards school: learning outcomes made significant positive difference in Indonesia. Mathematics self-efficacy and attitudes towards school: learning outcomes follow each other as significant predictors in a positive way in Malaysia. A negative correlation between both mathematics behaviour and sense of belonging with mathematics performance was found in Malaysia. On the other hand, the strongest predictor in Thailand was perseverance. It directly affected on mathematics performance positively with attitudes towards school.
23
CHAPTER 3: METHOD Introduction
This chapter will focus on defining research design of the present study and then moves on to the context of the present study. After that, sampling procedure is explained. Finally, information about instruments, data collection, and analysis procedures, are given in the last three section of this chapter.
Research design
This study has a correlational design. This design is used to examine the
relationships among variables. (Fitzgerald, Rumrill, & Schenker, 2004). Namely, it focuses on the description of the relationship between variables instead of presenting a theory. However, the results can illustrate theoretical items about the variables (Wood & Brink, 1998). In the present study, a relational analysis was conducted to predict students’ problem solving skills based on some selected variables taken from PISA 2012 Turkish student sample. However, instead of an analysis on the whole data, analyses were conducted on sub-samples, instead of using the whole sample, to control for the effect of socio-economic-status of students, which is a strong
24
Context
There is a report about human development as a landmark for the research by United Nation Development Program. The report focuses on three dimensions of human development index such as human development, policy analysis, and also lots of recommendations (Bhanojirao, 1991). If we examine human development index in terms of Turkey, different regions have highly different results education factors, average income, and life conditions in Turkey. There is wide range from one region to the other region. This range indicates huge varieties among regions. Especially, the value of this index seriously increases from east to west of Turkey. Therefore, Turkey is a diverse country in terms of socio-economic status. On the other hand, life expectancy illustrates high proportion for regions in bottom quartile in terms of human development index. That being said, the highest ratio about education indexes belongs to regions in the west of Turkey. On the other hand, income index is also lowest rate all over the country (Ünal, 2008).
In Turkey school type is also a source of diversity. There are twelve different school types (MoNE, 2015).Also, schools are divided into twelve categories in PISA 2012 such as primary school, general high school, Anatolian high school, science high school, social sciences high school, and Anatolian teacher training high school, vocational high school, Anatolian vocational high school, technical high school, anatolian technical high school, multi program high school and police college (MoNE, 2015). However, police colleges were closed in 2016.
A similar diversity can also be observed in several variables in Turkey, as well as in other countries, such as family background, academic background, social
25
background etc. (Wallace, Goodkind, Wallace, & Bachman 2008; Borman & Overman, 2004; Brougham, Zail, Mendoza, & Miller, 2009).
OECD proposed a unique index to quantify socio-economic status of students which is called Economic, Social, and Cultural Status (ESCS) (OECD, 2013b). The ESCS was first used in PISA 2000. It has been defined using the following variables: index of home possessions (HOMEPOS as defined in PISA dataset), the highest parental occupational (HISEI), and the highest parental education expressed as years of schooling (PARED) in PISA 2012 (OECD, 2014a). Higher numerical values of ESCS indicate higher socio-economic status.
Histogram of ESCS index of Turkish sample is given in Figure 1. The figure below shows the diversity of Turkey in ESCS. The mean ESCS is -1.46 (SD= 1.10).
26
Sampling
The sample design for PISA survey is applied mostly as two-stage stratified samples. The first stage is to select systematically schools which include 15 years old students. The second stage for sampling is to select students in chosen schools. PISA 2012 was applied to 510,000 students in total who are about 15- years old from 65 different countries (OECD, 2013c). These students represented approximately 28 million students all over the world. Apart from that, 4848 students from 170 schools were chosen to represent Turkey population. Turkey was divided into 12
geographical regions which were represented by 57 cities (MoNE, 2015). The sample in this study consists of all Turkish students in PISA 2012 dataset (N =
4848).
In this study, Turkish samples were further divided into subsamples to answer the research questions. The procedure followed as follows: First of all, analysis started with dividing into four groups according to ESCS in PISA 2012 Turkish sample. For this purpose, quartile scores of ESCS were calculated. The value of ESCS with 25th, 50th, and 75th were -2.28, -1.62, and -0.70, respectively. These four ESCS groups were labeled as bottom, middle-lower, middle-upper, and top. Means (standard deviations) of ESCS in four groups are -2.73 (0.37), -1.94 (0.18), -1.20 (0.25), 0.08 (0.55), respectively.
To give an idea about differences between groups defined by ESCS, some
information was provided below in a comparative manner. For example, the Table 1 gives information about home possessions of the students according to four groups of ESCS.
27 Table 1
Percentage of students who have home possessions
Group Desk Own Room Study Place Computer Internet Literature
Bottom 61.50 39.10 63.90 30.30 21.20 31.50
Middle-Lower 88.40 69.40 85.20 68.50 54.10 55.80
Middle-Upper 93.30 77.70 88.10 80.70 68.60 64
Top 97.90 89.40 94.50 92.30 84.20 80.90
Table 1 above shows that all percentages at issue increase from bottom to top quarter for all items indicating significant differences among ESCS groups. On the other hand, the students in the bottom quartile have the lowest percentages in terms of having computer, internet and literature at home; however, having study place is the highest ratio for them. Even in the middle-lower group, access to the internet and literature at home was around 50%. The information presented in the Table 1 indicates a severe problem in access to material (computer, internet and literature) especially in the bottom quarter.
Table 2 gives information on the parental education levels with respect to ESCS groups.
Table 2
Means (Standard Deviations) of parental schooling in years
Groups Mother Father
Bottom 4.30 (0.54) 4.07 (0.55)
Middle-lower 3.90 (0.71) 3.47 (0.76) Middle-upper 3.23 (1.17) 2.36 (1.15)
Top 2.28 (1.35) 1.37 (0.75)
According to the Table 2, the bottom quarter of mother schooling mean is 4.30. Mean of top quarter has lower value than bottom group. Actually, this situation is explained with ISCED levels in Table 3 as mentioned below. Although SPSS codes ISCED level 3A (upper secondary) as 1, it codes ISCED level 1 (primary education)
28
as 4. For this reason, meaning is increasing from the top group to the bottom group. For this aspect, mother schooling of the students in ESCS bottom quarter is in ISCED level 1.
Table 3 shows the percentage of mother and father schooling according to their education levels of years. For this reason, mother schooling percentage of bottom quarter is 57.8%. On the other hand, fathers in bottom quarter have also primary school level with 4.07 mean and 68.5% in the table 3 and 4. Additionally, the mother schooling mean in second quarter is 3.9. It is close to 4. Thus, it is represented with ISCED 1. The mothers in middle-lower have also primary school education level with 64.4%. The fathers in that group are in ISCED level 2 (lower secondary) which means lower secondary as mean of father schooling is 3.47 with 41%. In general, mean education year for mothers are lower than those for fathers.
Table 3
Percentage of ESCS groups according to their mother & father education level
ESCS groups Bottom Middle- lower Middle- upper Top ISCED level 3A 0.10 2 15.90 44.90 ISCED level 3B,3C - 0.60 2.50 5.70 ISCED level 2 3.70 16.4 29.70 19.60 ISCED level 1 57.80 64.4 41 20.20
She did not compete ISCED level 1 31.50 13.6 7.60 3.90
Missing 6.90 3 3.30 5.70
100% 100% 100% 100%
Note: ISCED level 3A: upper secondary; 3B, 3C: vocational/pre-vocational upper
secondary; 2: lower secondary; 1: primary education
In addition to this, mother schooling mean being 3.23 in the middle-upper quarter shows that mothers have lower secondary education level with 29.70%. As for that, father schooling mean with 2.36 illustrates that the education level of the father in
29
middle-upper is explained with vocational/pre-vocational upper secondary. Its percentage is 7.30. Lastly, mother schooling in the top quarter of ESCS has 2.28 mean. It is understood from the results that mothers’ education level is in ISCED level 3B, and 3C with 5.70%. This means that they are mostly
vocational/pre-vocational upper secondary graduate. On the other hand, the fathers have the highest education level among groups with 1.37 father schooling means. Fathers in the top quarter have upper secondary education level in ISCED level 3A with 44.90. In addition to this, although any of mothers in bottom quarter do not have ISCED level 3B, and 3C, they have ISCED level 3A with 0.10 percentages. ISCED level 3A is the biggest percentage for top quarter because it represents upper secondary education level. On the other hand, bottom quarter and second quarter have the biggest proportion with 57.80 and 64.40 respectively.
Thus, in the present study, 4 different socio-economic groups were defined by PISA’s ESCS index. In bottom group there were 1,232 students. There were 1187 students in middle-lower group. Also, 1185 and 1244 students were in middle-upper and the top group, respectively.
Instrumentation
PISA focuses on three main subject areas as mathematics, reading and science literacy. PISA firstly started with reading literacy in 2000. Mathematics and science literacy have followed respectively once every three years. The main subject of PISA 2012 which is used in this study is mathematics literacy.
30
PISA student questionnaire includes information about students, school types, teachers’ effects, families’ background, mathematics experiences and problem-solving skills with both open-ended and multiple-choice questions for three fundamental subject areas. Questions in the questionnaire generally consist of the problems related to the real life situations. Since PISA is to research how the students use the knowledge which is learned in the school in daily life.
In this study, the dependent variable is problem-solving score which firstly was used in PISA 2003. There are 5 plausible values about problem-solving. These plausible values are transformed scaled score and should not be interpreted as observed test scores. Rather they represent score range that a student may have.
Independent variables are ESCS, Subjective Norms in Mathematics (SUBNORM), Mathematics Self-Efficacy (MATEFF), Mathematics Behaviour (MATBEH), Mathematics Anxiety (ANXMAT), Sense of Belonging to School (BELONG), Attitudes towards School: Learning Outcomes (ATSCHL) and Learning Activities (ATTLNACT), Perseverance (PERSEV). These variables are derived scores and higher values indicate more level of the variables.
One of the mathematics factors is that mathematics self-efficacy has 8 items and its scales were categorized as "very confident", "confident", "not very confident" and "not at all confident" and inverted for scaling. The other scales belong to
mathematics anxiety and subjective norms in mathematics as "strongly agree", "agree", "disagree" and "strongly disagree" and inverted for scaling for 5 items and 6 items, respectively (Ding, 2016). On the other hand, there are 8 items for
31
mathematics behavior which is scaled by always or almost always, often, sometimes, never, rarely. Also, perseverance has 6 items to be scaled by very much, mostly, somewhat, not much, not at all. Additionally, attitudes towards school learning outcomes and learning activities has measured as strongly agreed, agreed, disagreed or strongly disagreed for 4 items both of them. In addition to that, sense of belonging has 9 items with exactly same scales in next factor (OECD, 2013c). Table 4 presents descriptive of the variables used in this study.
Table 4
Descriptive of the variables
Groups ESCS SUBNORM MATEFF MATBEH ANXMAT
Bottom SD 0.37 1.19 0.88 1.03 1.00 Mean -2.73 0.10 -0.24 0.51 0.31 Min -4.61 -4.25 -3.75 -2.14 -2.37 Max -2.28 3.86 2.27 4.42 2.55 Middle-Lower SD 0.18 1.14 0.89 0.99 0.98 Mean -1.94 0.26 -0.07 0.59 0.34 Min -2.27 -4.25 -3.75 -2.14 -2.37 Max -1.62 3.86 2.27 4.42 2.55 Middle-Upper SD 0.26 1.17 0.92 1.03 1,05 Mean -1.20 0.25 -0.04 0.50 0.31 Min -1.61 -4.25 -3.75 -2.14 -2.37 Max -0,71 3.86 2.27 4.42 2.55 Top SD 0.55 1.01 0.95 0.93 1.09 Mean 0.08 0.45 0.30 0.59 0.08 Min -0.70 -2.71 -2.96 -2.14 -2.37 Max 1.94 3.86 2.27 4.42 2.55
32 Table 4 (cont’d)
Groups BELONG ATTLNACT ATSCHL PERSEV
Bottom SD 1.01 1.03 1.01 1.07 Mean -0.06 0.24 0.10 0.35 Min -3.69 -3.38 -2.99 -4.05 Max 2.63 1.21 2.35 3.53 Middle-Lower SD 1.08 0.98 1.10 1.05 Mean 0.17 0.27 0.18 0.45 Min -3.00 -3.38 -2.99 -2.85 Max 2.63 1.21 2.35 3.53 Middle-Upper SD 1.13 1.00 1.01 1.04 Mean 0.19 0.18 0.05 0.44 Min -2.67 -3.38 -2.99 -2.29 Max 2.63 1.21 2.35 3.53 Top SD 1.10 1.04 1.09 1.14 Mean 0.21 0.08 0.01 0.56 Min -3.69 -3.38 -2.99 -2.29 Max 2.63 1.21 2.35 3.52
Method of data collection
Paper-based assessment which includes mathematics, reading, science, and also financial literacy (optional) as a computer-based assessment totally lasted 120 minutes (OECD, 2014b). For students’ questionnaire students are given 30 minutes. At the same time, school principal test also takes 30 minutes. The test for problem-solving lasts 80 minutes. Furthermore, there are optional computer-based
assessments. All tests are completed in 390 minutes (OECD, 2014a).
In the student questionnaire, not all students answer all questions because of the fact that the exam takes a long time if they answer all questions at once. For this reason, PISA has rotation based design which includes three forms of questionnaires to answer one-third of students. PISA has a common part for all students. It consists of personal details such as gender, language at home, migrant background, home
33
possessions, parental occupation and education (OECD, 2013c). The other part is called rotated part to be created in three forms.
Method of data analysis
In this study, multiple linear regressions were conducted to understand the relationships between some selected variables (ESCS, Subjective Norms in Mathematics, Mathematics Self-Efficacy, Mathematics Behavior, Mathematics Anxiety, Sense of Belonging to School, Attitudes Towards School: Learning Outcomes and Learning Activities, Perseverance) and the problem-solving skills across 4 ESCS groups.
Regression analyses were hierarchically repeated for four different ESCS groups separately. To control socio-economic status in predicting problem solving skills of students, ESCS was included in the regression analyses as the first block. Second block included math-related variables (SUBNORM, MATEFF, ANXMAT,
MATBEH). For third block, self-characteristic factors were added to the regression equations (ATSCHL, ATTLNACT, PERSEV, BELONG). Since the dependent variable was a plausible variable, regression analyses were also repeated within each ESCS group as 5 times in each plausible value. After all, results were averaged. Then alpha levels were adjusted accordingly.
Assumptions about this data are analyzed in terms of hierarchical multiple linear regressions: normality, linearity and homoscedasticity. Normality was checked using skewness and kurtosis values. The results are satisfied the values between -2 and 2 for skewness and kurtosis values of all factors in this thesis. If the values are not in
34
between -2 and 2, George and Mallery (2010) explained that multiple linear regression analysis requires to this condition for normality. Hierarchical multiple linear regression was conducted in three blocks with independent variables such as background of the students (ESCS), math-related (MATEFF, SUBNORM,
ANXMAT, MATBEH), and self-characteristic (ATSCHL, ATTLNACT, PERSEV, BELONG) with dependent variables as problem solving plausible values
35
CHAPTER 4: RESULTS Introduction
In this study, the main purpose is to identify the relationships between problem-solving skills and a group of selected variables on PISA 2012 Turkish data set across different socio-economic groups. The variables selected were socio-economic status, subjective norms in mathematics, mathematics anxiety, sense of belonging,
perseverance, mathematics behavior, mathematics self-efficacy, attitude towards school: learning outcomes, attitudes towards school: learning activities. The
relationships were investigated via a series of hierarchical multiple linear regression analysis. This chapter presents results of the analyses.
PISA 2012 Turkish sample data was divided into 4 quartiles based on ESCS variable as explained in Chapter 3. For each group, a separate hierarchical multiple linear regression was conducted with 3 blocks. In each regression, block 1 included only ESCS to control for students’ socio-economic status. Block 2 includes math-related factors: Subjective Norms in Mathematics (SUBNORM), Mathematics Anxiety (ANXMAT), Mathematics Behavior (MATBEH), and Mathematics Self-Efficacy (MATEFF). Lastly, Block 3 is used to include some other selected variables i.e. Attitude towards School: Learning Outcomes (ATSCHL), Attitude towards School: Learning Activities (ATTLNACT), Perseverance (PERSEV), Sense of Belonging to School (BELONG) factors.
36
Results of the regression analyses
All modes were found to be statistically significant at an alpha level of 0.05. Amounts of variances explained by each regression analyses with respect to blocks were given in Table 5. As can be seen in the table, variances explained by the models were limited.
Table 5
Amount of variances explained by the models
Group Variables Adjusted R2
Bottom
ESCS (block 1) 0.02
SUBNORM, MATEFF, ANXMAT, MATBEH (block 2) 0.09 BELONG, ATSCHL, ATTLNACT, PERSEV (block 3) 0.11
Middle- Lower
ESCS (block 1) 0.01
SUBNORM, MATEFF, ANXMAT, MATBEH (block 2) 0.14 BELONG, ATSCHL, ATTLNACT, PERSEV (block 3) 0.14
Middle- Upper
ESCS (block 1) 0.01
SUBNORM, MATEFF, ANXMAT, MATBEH (block 2) 0.11 BELONG, ATSCHL, ATTLNACT, PERSEV (block 3) 0.11
Top
ESCS (block 1) 0.03
SUBNORM, MATEFF, ANXMAT, MATBEH (block 2) 0.17 BELONG, ATSCHL, ATTLNACT, PERSEV (block 3) 0.19
In the bottom quarter, the first block, namely ESCS, explained only 2% of the total variance in students’ problem-solving scores. After adding math related factors (Block 2) controlled for the variable ESCS, an additional 7% was explained, making a total explained variance of 9%. Adding the variables in the block 3 caused only 2% increase to the total explained variance. A total 11% of the variance in problem
37
solving skills was explained by three blocks in the bottom group. For this group, the highest contribution came from the variables in the Block 2 (SUBNORM,
MATBEH, MATEFF, ANXMAT).
In the middle-lower group, the single variable in the Block 1, ESCS, explained only 1% of the total variance in problem solving. When math-related factors in Block 2 were added a total 14% was accounted for the explanation of problem solving skill. That is, math-related variables themselves explained 13% of the total variation in problem solving scores when ESCS was controlled for. The variables in the Block 3 did not provide any significant increase in explaining total variability in problem-solving skill as evidenced by no change in explained variances after the variables in the Block 3 were added.
In the middle-upper group, ESCS in Block 1 explained again only 1% of variance in problem solving skill. After math related factors in Block 2, an additional 10% was added to the amount of total variance explained. However, student and school-related variables in Block 3 did not influence on problem-solving skill in middle-upper quarter as in middle-lower quarter of ESCS.
Overall, in the top quarter, ESCS in Block 1 has the highest proportion among groups so as to explain with 3% of variance in problem solving skill. In addition to that, although changes between Block 1 and 2, after adding math-related factors, have 7% in the bottom group, the top group has the highest proportion of 14% of changing. The percent is explained with 17% of variance in problem solving skill in Block 2 for top group. Results indicated that math-related variables (BELONG,
38
ATSCHL, ATTLNACT, PERSEV) explained 2%the total variance in problem solving in this group.
The Figure 2 below shows the changes in the explained variances by different blocks for each group.
Figure 2. Explained variance by variable in three Blocks
The above-mentioned Table 5 and Figure 2 above illustrate ESCS in the all groups has very low explained variance. After adding math-related factors in the Block 2, explained variance shows an increase from bottom to top group in the graph. In addition to this, after adding self-characteristic factors in the Block 3, there was no change in the explained variance levels, except for the bottom and top groups. For all
0 0,02 0,04 0,06 0,08 0,1 0,12 0,14 0,16 0,18 0,2
ESCS SUBNORM + MATEFF +
ANXMAT + MATHBEH
BELONG + ATSCHL + ATTLNACT + PERSEV
Explained Variance by Variable in three Blocks
Bottom Middle- Lower Middle- Upper Top
39
groups, variables in the blocks 2 explained the highest proportion of the total variance in students’ problem solving skills
Table 6 shows the regression coefficients, both standardized and unstandardized, estimated by the regression models.
Table 6
The unstandardized and standardized regression coefficients
Bottom Middle-Lower Blocks Variables B SE β T B SE β T Block1 Constant 494.01 25.64 19.27 524.6 36.74 14.28 ESCS 26.64 9.39 0.14 2.84* 41.51 18.68 0.11 2.22* Block2 Constant 515.1 25.05 20.57 513.6 34.61 14.84 ESCS 29.06 9.07 0.15 3.20* 31.11 17.55 0.08 1.78* SUBNORM -6.22 2.76 -0.12 -2.25* 7.43 2.94 -0.13 -2.53* MATEFF 18.98 4.35 0.24 4.36* 22.43 4.04 0.28 5.55* ANXMAT -9.38 3.39 -0.13 -2.77* -15.01 3.56 -0.20 -4.22* MATBEH -10 3.19 -0.17 -3.14* -1.17 3.41 -0.02 -0.34 Block3 Constant 511.1 24.9 20.53* 512.6 34.71 14.77 ESCS 29.39 8.99 0.15 3.27* 30.54 17.56 0.08 1.74* SUBNORM -6.06 2.81 -0.12 -2.16* -7.59 3.04 -0.13 -2.50* MATEFF 15.62 4.55 0.20 3.43* 22.2 4.17 0.28 5.33* ANXMAT -8.7 3.51 -0.12 -2.48* -15.04 3.71 -0.20 -4.06* MATBEH -9.38 3.23 -0.16 -2.91* -1.69 3.44 -0.03 -0.49* BELONG -5.61 3.86 -0.08 -1.45* -4.64 3.93 -0.07 -1.18* ATSCHL -5.7 4.12 -0.08 -1.38* -3.87 3.66 -0.06 -1.06 ATTLNACT 7.77 3.91 0.12 1.99* 3.46 4.00 0.05 0.87 PERSEV 7.39 3.46 0.11 2.14* 2.59 3.58 0.04 0.72 *p<0.05
40 Table 6 (cont’d)
*p<0.05
Table 6 shows standardized and unstandardized regression coefficients between problem-solving skill and variables used in this study. Mostly, there are statistically significant relationships between the variables and problem-solving skill in each block. However, the level of relationship between factors and problem-solving differs from each other.
In all blocks, ESCS, as a background variable, has a positive relationship with problem-solving skill scores of students. The highest relationship belongs to the top
Middle-Upper Top Blocks Variables B SE β T B SE β T Block1 Constant 495.34 17.27 28.69 493.4 3.84 128.41 ESCS 34.53 14.19 0.13 2.43* 26.59 6.90 0.19 3.85* Block2 Constant 500.16 16.64 30.07 493.50 4.57 108.09 ESCS 30.85 16.64 0.11 2.26* 15.12 6.57 0.11 2.29* SUBNORM -4.63 3.46 -0.08 -1.42* -0.64 3.47 -0.01 -4.63 MATEFF 22.67 3.26 0.31 5.65* 23.90 4.01 0.31 5.96* ANXMAT -6.99 13.65 -0.10 -1.92* -1.60 3.95 -0.19 -3.70* MATBEH -7.44 3.63 -0.12 -2.16* -9.05 4.23 -0.11 -2.14* Block3 Constant 505.4 16.73 30.23 494.80 4.69 105.53 ESCS 32.89 13.64 0.12 2.40* 11.22 6.58 0.08 1.70* SUBNORM -3.47 3.37 -0.06 -1,03 3.71 3.67 0.05 1.01 MATEFF 24.73 4.12 0.33 6.01* 24.77 4.03 0.32 6.14* ANXMAT -8.46 3.68 -0.12 -2.3* -18.06 4.07 -0.23 -4.45* MATBEH -6.72 3.46 -0.11 -1.95* -9.62 4.2 -0.12 -2.29* BELONG -6.69 3.87 -0.10 -1.73* -5.07 3.98 -0.07 -1.27 ATSCHL -0.22 4.32 0 -0.05 -7.65 4.21 -0.11 -1.82* ATTLNACT -0.75 4.37 -0.01 -0.17 -1,65 4,14 -0.02 -0.40 PERSEV -4.15 3.71 -0.06 -1.12 -3,14 3,71 -0.04 -0.85
41
group (β = 0.19) in block 1. Also, the lowest relationship belongs to the middle-lower quarter with a value of 0.11 in block 1. When the math-related factors were added, ESCS was most affected in the top quarter. The proportion of change was reduced from 0.19 to 0.11 in the top quarter for ESCS. ESCS decreased after adding math-related factors except for the top quarter. ESCS in the bottom quarter increased from 0.14 in block 1 to 0.15 in block 2. In all groups in block 3, ESCS tends to protect its value.
On the other hand, SUBNORM influence highly problem-solving skill; but it is not in a positive direction. Subjective norms in mathematics have a strongly negative relationship with problem-solving both bottom and middle-lower groups in all blocks. Also, there are statistically significant results between SUBNORM and problem-solving skills in middle-upper group for only block 2. In addition to that, SUBNORM in top group does not have a statistically significant difference with the dependent variable in this study.
MATEFF has a positive relationship with the dependent variable in the study for all groups. Namely, MATEFF has the highest relationship with problem-solving as evidenced by beta values. At the same time, the biggest beta value belongs to mathematics self-efficacy in all blocks for all groups with a positive sign. It means when the students have higher mathematics self-efficacy, the students also have higher problem-solving skill. In bottom group, MATEFF has 0.24 in block 2 and 0.20 in block 3. Also, in the middle-lower group, MATEFF has 0.28 in both block 2 and 3. In addition to that, in the middle-upper group, MATEFF has 0.31 in block 2