DESIGN OF A WAREHOUSE ORDER PICKING POLICY USING GENETIC ALGORITHM
by
Ahmet Can Saner
Submitted to the Institute of Graduate Studies in Science and Engineering in partial fulfillment of
the requirements for the degree of Master of Science
in
Intelligent Systems Engineering
İstanbul Bilgi University 2017
ii
DESIGN OF A WAREHOUSE ORDER PICKING POLICY USING GENETIC ALGORITHM
APPROVED BY:
Assoc. Prof. Dr. Ayhan Özgür Toy ………
(Supervisor)
Dr. Zehra Düzgit ………
(Supervisor)
Assist. Prof. Dr. Deniz Özdemir ………
Assist. Prof. Dr. Umman Mahir Yıldırım ………
Prof. Dr. Yavuz Günalay ………
iii
ACKNOWLEDGEMENTS
I dedicate this thesis to my father, Kemal Saner, MS, CE (1950-1994). My father was a hardworking, benevolent and respected man who had profound love for his family. He is my first and best hero in my life that I had the chance to know only until my secondary school years. He is the one that actually formed my qualities and ambitions, the actual essence of who I am. I owe my everything to my father; my ultimate source of guidance and inspiration, my role model.
After this dedication, I would like to express my gratitude to people who in one way or another contributed and assisted in the preperation and completion of this thesis.
First and foremost, I would like to express my deepest thanks to my advisor Dr. Zehra Düzgit, for her supervision, excellent guidance, patience, support and continuous encouragement to continue and complete this thesis. Above all and the most needed, she guided me in every step of this thesis on each matter that should be focused. She was always ready to answer my questions any time and she patiently corrected all my writing. Without her, this thesis would not have been completed or written within the limited time frame. I cannot think of a better or friendlier advisor to have. I am indebted to her more than she knows. I sincerely hope I continue to have opportunities to interact with her for the rest of my career.
I offer my utmost gratitude to my advisor Assoc. Prof. Dr. Ayhan Özgür Toy, for his guidance from the very early stage of this thesis, for his valuable advices, supervision and crucial contribution to this thesis. His involvement with his extraordinary experiences and feedback throughout the work, his encouragement and support in various ways allowed me to prepare such a detailed work. He provided me an excellent atmosphere for doing research and freedom to work in my own way. I am grateful to him in every possible way.
I would also like to thank my committee members, Prof. Dr. Yavuz Günalay, Assist. Prof. Dr. Deniz Özdemir and Assist. Prof. Dr. Umman Mahir Yıldırım, for their time, interest,
iv
brilliant suggestions and providing insightful discussions and helpful comments about this thesis.
A very special gratitude goes to all my Computer Science instructors, specially to Chris Stephenson, MA, Assoc. Prof. Dr. Mehmet Gençer, and Dr. Elif Pınar Hacıbeyoğlu for showing me, by their example, how a good scientist and person should be. As my teachers and mentors, they have taught me more than I could ever give them credit for here. Special thanks to Mehmet Gençer for convincing me to start Intelligent Systems Engineering program in Bilgi University that gave me the golden opportunity to complete this thesis. Thanks to all my teachers for their intellectual contributions to my development as a scientist.
And finally, last but by no means least, I would like to thank my amazing family, unique in many ways, for their unconditional love and support all these years. My mother Canan has given up many things for me to have a good education, my sisters Cana and Ceren cherished with me in good times and encouraged me with their wishes in bad times. Most importantly, I wish to thank my loving wife, Beyza, who provides me my unending inspiration to work. She is the source of my love, my creativity and my patience. She were there when I felt tired to get me up, she were there when my thoughts are dried to help me find a way out. She were there when sometimes I went mad to calm me down. She were always there cheering me up and stood by me through the good times and bad.
I would like to thank to everybody who was important to the successful realization of this thesis, as well as expressing my apology that I could not mention personally one by one.
v
DESIGN OF A WAREHOUSE ORDER PICKING POLICY
USING GENETIC ALGORITHM
Ahmet Can Saner
Intelligent Systems Engineering, M.S. Thesis, 2017
Thesis Supervisors: Assoc. Prof. Dr. Ayhan Özgür Toy, Dr. Zehra Düzgit
In this study, improving order-picking process is considered which is an essential operation critically impacting warehouse and supply chain performance. The problem of reducing travelled distance of an order picker is examined in a multi-block warehouse. The study is composed of two phases: In the first phase, the shortest path between each pair of items is determined in a pick list leading to the second phase of determining the sequence of all items to be picked. A mathematical model is utilized to find the shortest path between each item pair in a pick list. A genetic algorithm based approach is developed to decide the picking sequence of all items in an order list, given the shortest distance between each pair of items. The performance of the proposed algorithms is compared to popular heuristics used for multi-block warehouses, namely: S-Shape and Largest Gap.
vi
GENETİK ALGORİTMA KULLARAK BİR DEPO SİPARİŞ
TOPLAMA POLİTİKASI TASARIMI
Ahmet Can Saner
Akıllı Sistemler Mühendisliği, Yüksek Lisans Tezi, 2017
Tez Danışmanları: Doc. Dr. Ayhan Özgür Toy, Dr. Zehra Düzgit
Bu çalışmada, depo ve tedarik zinciri verimi için kritik öneme sahip sipariş toplama sürecinin iyileştirilmesi amaçlanmaktadır. Çok bloklu depolarda sipariş toplayıcı tarafından katedilen mesafenin azaltılması problemi incelenmiştir. Çalışma iki fazdan oluşmaktadır: Birinci fazda sipariş toplayıcının sipariş listesindeki her iki ürünün arasındaki en kısa mesafe ve rota hesaplanır ve ikinci fazda bu mesafeler ışığında sipariş listesindeki toplanacak ürünlerin sırası ve rotası belirlenir. Sipariş listesindeki her iki ürünün arasındaki en kısa mesafeyi hesaplamak için bir matematiksel model kullanılmıştır. Sipariş listesindeki ürün ikililerinin arasındaki en kısa mesafeleri kullanarak sipariş listesindeki toplanacak ürünlerin sırasını belirleme aşaması genetik algoritma tabanlı bir yaklaşım izlenerek geliştirilmiştir. Önerilen algoritmanın performansı popüler çok bloklu sipariş toplama rotası sezgiselleri: s-şekilli ve en büyük aralık sezgiselleri ile karşılaştırılmıştır.
vii
TABLE OF CONTENTS
ACKNOWLEDGEMENTS... iii
ABSTRACT... v
ÖZET... vi
TABLE OF CONTENTS... vii
LIST OF FIGURES... ix
LIST OF TABLES... xi
LIST OF SYMBOLS / ABBREVIATIONS... xii
1. INTRODUCTION ... 1
2. LITERATURE REVIEW ... 14
3. PROBLEM DESCRIPTION ... 19
3.1. WAREHOUSE LAYOUT ... 21
3.2. ITEM COORDINATE SYSTEM ... 23
3.3. ASSUMPTIONS ... 24
4. SOLUTION METHODOLOGY ... 25
5. GENETIC ALGORITHM ... 27
5.1. GENETIC ALGORITHM MECHANISMS ... 30
5.1.1. Selection (Reproduction) ... 30
5.1.2. Crossover (Recombination) ... 33
5.1.3. Mutation ... 34
5.1.4. Reinsertion (Survival) ... 35
5.2. ORDERING PROBLEMS AND INVALID (INFEASIBLE) OFFSPRING .... 38
5.3. CROSSOVER OPERATORS FOR PICKING SEQUENCE PROBLEM ... 39
5.3.1. Cycle Crossover (CX) ... 40
5.3.2. Partially-Mapped Crossover (PMX) ... 42
5.3.3. Order Crossover (OX) ... 45
6. PARAMETER TUNING ... 49
viii
8. COMPUTATIONAL TESTS ... 56
9. CONCLUSION ... 64
REFERENCES ... 67
APPENDIX A: PSEUDOCODE FOR S-SHAPE HEURISTIC ... 71
APPENDIX B: FLOWCHART FOR S-SHAPE HEURISTIC ... 72
APPENDIX C: PSEUDOCODE FOR LARGEST GAP HEURISTIC ... 73
ix
LIST OF FIGURES
Figure 1.1. Distribution of Warehouse Operating Expenses, ([2]) ………...……….. 3
Figure 1.2. Classification of Order Picking Systems, ([3])………..…………... 4
Figure 1.3. Distribution of Order Picker’s Time, ([2]) ………..………. 6
Figure 1.4. Routing Policies for Single-block Warehouse, ([3]) ………...……. 8
Figure 1.5. Routing Policies for Multi-block Warehouse, ([9]) ………...……. 11
Figure 3.1. Forward Pick Area Layout ……….. 22
Figure 3.2. Item Coordinate System ……….. 23
Figure 4.1. Junction Points ……… 26
Figure 5.1. An Example of a Tour for Picking Sequence ………. 28
Figure 5.2. Roulette Wheel Representation for Selection Method ……… 32
Figure 5.3. Pseudocode of Genetic Algorithm ……….. 37
Figure 5.4. Steps of Genetic Algorithm ……… 38
Figure 5.5. Invalid Offspring ……… 39
Figure 5.6. Parental Chromosomes for Crossover Examples ……… 40
Figure 5.7. Identifying Cycles for Cycle Crossover ……….. 41
Figure 5.8. Filling Cycles in Offspring for Cycle Crossover ……… 41
Figure 5.9. Listing Missing Values of First Offspring for Partially-Mapped Crossover .. 43
Figure 5.10. Placement of First Missing Value for Partially-Mapped Crossover ………. 44
Figure 5.11. Filling Remaining Genes of the First Offspring for Partially-Mapped Crossover ……….. 45
Figure 5.12. Forming the Second Offspring with Partially-Mapped Crossover ……... 45
Figure 5.13. Forming Offspring with Order Crossover ……… 46
Figure 5.14. Offspring Chromosome for Mutation Examples ……….. 47
Figure 5.15. Mutation of Offspring with Inversion Mutation ………... 47
Figure 5.16. Mutation of Offspring with Swap Mutation ………. 48
Figure 6.1. Parameter Tuning for Population Size ……… 50
x
Figure 6.3. Parameter Tuning for Mutation Probability ……… 53 Figure 7.1. Routing Paths for: (a) S-Shape (b) Largest Gap ………. 54
xi
LIST OF TABLES
Table 5.1. Sample Shortest Distance Matrix for a 4-Item Picklist (in meters) …………. 28
Table 5.2. Total Travelled Distance (in meters) and Fitness Score of the 1st Generation . 30 Table 5.3. Selection Probabilities ……….. 31
Table 5.4. Mating Pool Generation ………... 32
Table 5.5. Implementation of Crossover Probability on the Mating Pool ……… 33
Table 5.6. Implementation of Mutation Probability on Formed Offspring ……….. 35
Table 5.7. Ranking of Chromosomes in Mating Pool for Reinsertion ……….. 36
Table 5.8. Total Travelled Distance (in meters) and Fitness Score of the 2nd Generation 36 Table 6.1. Average Travelled Distance Results per Population Size ……… 49
Table 6.2. Average Travelled Distance Results per Crossover Probability ……….. 51
Table 6.3. Average Travelled Distance Results per Mutation Probability ……… 52
Table 8.1. Performance Comparison for Travelled Distance for 25-Item Pick List (meters) ……… 58
Table 8.2. Running Time for 25-Item Pick List (seconds) ……… 59
Table 8.3. Performance Comparison for Travelled Distance for 50-Item Pick List (meters) ……… 60
Table 8.4. Running Time for 50-Item Pick List (seconds) ……… 61
Table 8.5. Performance Comparison for Travelled Distance for 100-Item Pick List (meters) ……… 62
xii
LIST OF SYMBOLS / ABBREVIATIONS
A Horizontal block index of Item Coordinate System B Vertical block index of Item Coordinate System C Side of block of Item Coordinate System
D Shelf Index of Item Coordinate System K Length of a shelf of warehouse
L Carton flow rack system length of warehouse W Carton flow rack system width of warehouse
S Number of shelf per carton flow rack system of warehouse
AS/RS Automated Storage/Retrieval System CX Cycle Crossover Operator
GA Genetic Algorithm
NP Nondeterministic Polynomial Time OX Order Crossover Operator
P Polynomial Time
P/D Pick-up/Drop-off Point
PMX Partially-Mapped Crossover Operator
RF Radio Frequency
SKU Stock Keeping Unit
1
1. INTRODUCTION
In commerce, supply chain is the distribution and coordination network of goods and resources for delivering from supplier as a point of origin, through intermediaries and third-party service providers to customer as a point of consumption. Supply chain management is the design, planning and management of this flow and its activities in a timely and cost-effective manner. Logistics or logistics management, which is a part of supply chain management, is the combination of activities such as procurement, maintenance, distribution, forward and backward flow and storage of goods in right conditions. In other words, logistics is the management of inventory in motion.
In the past, keeping inventory meant warehousing products in excess quantities that is much more than demand and usually considered as a back-office operation that is undesirable, costly but necessary. Fundamental changes such as competition and emergence of online shopping or e-tailing changed companies of the past to use contemporary just-in-time inventory management and to apply lean thinking on their supply chain management. More global a company is, warehousing of products has more impact on their operations, service level and costs. Today, companies facing great global competition are not treated by sole quality of their products, they are also expected to efficiently deliver products to customers. Due to the growth, globalization and popularity of e-commerce, customer preferences also shifted to companies having more product diversity with less delivery time, meaning more flexible and responsive to customer needs. All these changes required organizations to reinforce logistics operations, to focus much more on warehousing accurate amount and type of products in the right and most strategic locations to gain and sustain competitive advantage.
When viewed in this context, warehousing becomes a critical activity of supply chain. Following demanded quality and customer service improvements, warehouses are not only major components of logistics systems as points of storage in the distribution network, but also are essential for success due to their inventory visibility and accuracy functions.
2
Nowadays, efficient management of warehouses is a key factor for the companies’ success. Keeping the right products available for the customers concerning product popularity, picking and shipping these items to customers on time are considered responsibilities of current warehouses to fulfill customer expectations, therefore increase product sales. Warehouses are accounted as profit-centers instead of cost-centers these days and more companies that are competing for growing e-tail market look to improve productivity and decrease costs within their warehouses through designing and operating their various operations in the most efficient and effective manner.
According to [1], the following standardized operations take place in a typical warehouse: - Receiving: all activities to be done for the task of receiving products such as unloading
and inspecting incoming products and updating records.
- Storage: transferring products from the receiving area to their location in storage and housing products until requested.
- Order Picking: retrieving right amount of right products from their storage locations for a set of independent customer orders.
- Shipping: Packing, accumulating and sorting customer orders.
Among all these operations forming flow of products from supplier to customer, most crucial, highest priority and strategic operation of a warehouse regarding customer expectations is order picking. It is the most labor-intensive, time consuming hence most expensive function of a warehouse impacting for more than a half of the total warehousing costs, as seen in Figure 1.1. According to [2], 55% of all operating expenses are accredited to order picking activity.
3
Figure 1.1. Distribution of Warehouse Operating Expenses, ([2])
The efficient organization and management of order picking operation concluded to less time spent on order picking operation yields less delivery time supporting higher customer service level, thereby directly impacts warehouse's and whole supply chain's performance. Management of order picking operation differs mainly per employed order picking system in the warehouse.
As shown in Figure 1.2, [3] classify order picking systems mainly into two categories, that is, employing humans or automated machines. Self-explanatory automated and robotized picking systems are very specially used for small and delicate items and are not very common. Among the warehouses mostly using order picking systems that is employing humans, sub classifications as picker-to-parts, parts-to-picker and put systems exist. Two types of picker-to-parts system can be recognized: low-level or high-level picking systems. In low-level order picking systems, order picker travels throughout the storage area and picks required items from storage racks. In high-level order picking systems, order picker travels to pick location boarding an order picking truck or crane and perform picking activity with it. Parts-to-picker systems comprise AS/RS (automated storage/retrieval system) that retrieve required unit loads to a Pick-up/Drop-off (P/D) point for order picker to take required number of items from inside and store remaining load back. Put systems are formed of retrieval and distribution process. For retrieval process, parts-to-picker or picker-to-parts system may be used. For the distribution process, pre-picked items are directed to an order picker in order to make them distributed over pick lists. Order picker puts retrieved items to
10%
15%
55% 20%
4
customer packages. Among all these systems, according to [3], low-level picker-to-parts order picking systems employing humans are the most widely used systems and constitute over 80% of all order picking systems in Western Europe.
Figure 1.2. Classification of Order Picking Systems, ([3])
According to [4], in order to effectively minimize the time spent for picking and maximize efficiency of storage space, it is necessary for warehouse managers to solve some management decision problems namely layout design, storage assignment problems which are classified as strategic problems and order picking policies and routing policies problems which are classified as operational problems.
Strategic management decisions are long term decisions aiming to increase competency. Operational decisions are short-term decisions related to warehouse operations.
5
Layout design problem focuses on maximizing efficient usage of warehouse storage layout. Sizing of warehouse, where to place warehouse departments and determining layout of all these departments are all related to layout design. Warehouses are divided by aisles containing shelves where the products are stored for pickers to travel to and retrieve. P/D point is where pick lists are received and are given to order picker to start retrieving them. Usually but not required, there are also cross aisles perpendicular to aisles that enables order picker to change any aisle or move around the warehouse A warehouse layout can be classified as single-block or multi-block warehouse. In single-block warehouses, order picker can change aisles at front and back cross aisle of warehouse having single block between these two cross aisles. That is the reason these warehouses are named single-block warehouses. There can also be one or more cross aisles at positions in between front and back cross aisle. These warehouses with more than two cross aisles are named multi-block warehouses.
Storage assignment policies specify where items will be assigned to storage locations in warehouse layout. According to [4], there are five mostly used storage assignment policies:
1- Random: items are randomly assigned to an eligible empty location. 2- Closest-open-location: items are assigned to the closest empty location. 3- Dedicated: items either in stock or out of stock are assigned to a fixed location. 4- Full-turnover: items are distributed over the storage area according to their turnover.
Simply, products with the highest sales rates are located at the easiest reachable locations, usually near P/D point.
5- Class-based: items are classified into different classes and assigned to a location in a dedicated, fixed area of warehouse that is reserved for each class.
Order picking policies state how order picker behaves in his picking tour for the items in the pick list. Three order picking policies are considered as zoning, batching and routing. Zoning is a way of dividing the total storage area for order picking to retrieve items into smaller units. Zoning takes place when order pickers only pick items from an order that are located in their assigned zone. Using this way, an order is distributed over a number of order pickers and several order pickers work to complete the same order. Batching is to let an order picker
6
combine and retrieve several orders simultaneously at the same time. Using this way, order pickers collects batch of orders, sorting items before or after the retrieval of item.
Routing policies define in which order an order picker will retrieve the items in his pick list. These policies mainly focus on travelling time of an order picker which is typically the most time-spent activity of an order picker in a usual picking tour. Typical distribution of an order picker's time in a typical warehouse with a picker-to-parts human employing order picking system with manual picking operations according to [2] is shown on Figure 1.3. Travelling activity accounts for 50% of total order processing time hence it is counted as a key performance indicator of order picking systems. Compared to other activities during order picking, travelling is the most focused activity to improve and routing policies are specially developed to reduce travelling distance and in consequence to reduce the costs related to travelling activity of order pickers.
Figure 1.3. Distribution of Order Picker’s Time, ([2])
The problem of routing order pickers is generally solved using heuristic methods which are algorithms that solve a problem with a feasible but not guaranteed to be optimal solution. As shown in Figure 1.4, for single-block warehouses, the heuristic methods mainly used are:
5%
10%
15%
20% 50%
7
1. S-Shape (Traversal) Heuristic: Basically, order picker traverses through the entire length of any aisle containing at least one item. Aisles where there is no item to be picked are skipped by order picker.
2. Return Heuristic: Order picker enters any aisle containing at least one item and leaves each aisle from the same end. Aisles where there is no item to be picked are skipped by order picker.
3. Midpoint Heuristic: Warehouse is divided into two halves. Items of an aisle to be picked in the front half are entered from front cross-aisle and items of an aisle to be picked in the back half are entered from the back cross-aisle. Order picker traverses to the back half of the warehouse by the first or the last aisle containing at least one item to be picked.
4. Largest Gap Heuristic: Similar to midpoint heuristic, except order picker enters an aisle containing at least one item as far as the largest gap within an aisle, instead of midpoint of the aisle. A gap represents the distance between any two adjacent items, between the first item of the aisle and the front cross-aisle, or between the last item to be picked and the back cross-aisle. The largest gap within an aisle is the portion of the aisle that is not traversed by order picker. If the largest gap is between two adjacent items to be picked, the picker enters same aisle from both ends. Otherwise, picker enters aisle from either front of back aisle.
5. Combined Heuristic: Order picker enters any aisle containing at least one item and decides whether to leave from the same end or the other end using dynamic programming. Order picker will choose whether to traverse the entire aisle or not according to the next item location on next aisle aiming to have a better starting point for the next aisle.
In addition to these heuristics, an optimal algorithm is proposed by [5], to find shortest picking route for single-block warehouses.
8
Figure 1.4. Routing Policies for Single-block Warehouse, ([3])
All the above heuristic methods, that are initially generated for single-block warehouses, can also be used for multi-block warehouses with some modifications, as shown in Figure 1.5. According to [6], heuristic methods used for multiple block warehouses are:
9
1. S-Shape (Traversal) Heuristic: Order picker first calculates the left-most pick aisle and the farthest block from the P/D point that contains at least one item. Order picker starts his route by traversing the left-most pick aisle until the front cross-aisle of the farthest block and continues to traverse the entire length of sub aisles having at least one item to the back cross-aisle of the farthest block and to returns to the front cross-aisle of the farthest block again while picking items on his route. Sub aisles without any item are skipped. At the last sub-aisle order picker either traverses the entire aisle from back cross-aisle to front cross-aisle or enters from front-cross aisle and leaves from the same end to finish the route of the block on his front cross-aisle and continues the same procedure for the next block. Order picker finishes picking items block-by-block and returns to P/D point.
2. Largest Gap Heuristic: Starting procedure of calculating the left-most pick aisle, the farthest block of warehouse that contains at least one item and traversing the left-most pick aisle until the front cross-aisle of the farthest block is the same with S-Shape heuristic. After order picker starts to pick items for a selected block following starting procedure, picker enters a sub-aisle containing at least one item as far as the largest gap within that sub-aisle instead of entirely traversing it. The last subaisle of the selected block is traversed entirely by order picker to continue to pick non-picked sub-aisle items entering front cross-aisle of the selected block as well. When all items for a selected block are picked, order picker continues to pick items for the next block using the same procedure until he returns to P/D point.
3. Aisle-by-aisle Heuristic: This algorithm proposed by [7] aims to visit every aisle that is having at least one item only once. Order picker similarly starts from the left-most aisle that is having at least one item and continues with selecting the most suitable cross aisle using dynamic programming according to the starting point of the next selected pick aisle.
4. Combined Heuristic: Combined heuristic method differs from S-Shape heuristic by the ability to choose between entirely traversing a sub-aisle or entering and leaving from the same end of a sub-aisle using dynamic programming by looking at the starting point of the next pick sub-aisle ahead. This method uses the same starting procedure as S-Shape method and starts picking items from the left-most pick aisle.
5. Combined+ Heuristic: An improved and more complex version of combined heuristic method that uses dynamic programming method twice due to the fact that warehouse is
10
assumed to be divided into two parts, left and right. Order picker does not start picking items from the left-most pick aisle but instead he uses dynamic programming to select pick aisle of the left part of a selected block to go to the back cross-aisle of that selected block and uses dynamic programming again to select pick aisle of the right part of the selected block to return to the front cross-aisle of the selected block. Order picker continuously picks items of every block using the same selection process determined by dynamic programming.
In addition to these heuristics, an optimal algorithm is introduced by [8] for multi-block warehouses to find the shortest picking route based on the optimal method proposed by [5]. This optimal method is proposed for warehouses having only one-cross-aisle between the front and back aisle.
11
Figure 1.5. Routing Policies for Multi-block Warehouse ([9])
In this study, order picking problem of a company employing manual, low-level, picker-to-parts system in its order picking area having multi-block layout is taken into consideration.
In picker-to-parts order picking systems, determining a suitable sequence of pick locations to minimize total travelling distance is somewhat similar to travelling salesman problem (TSP).
The travelling salesman problem (TSP) searches an answer to: "Given a set of cities and the distances between each pair of these cities, what is the route with minimum total travelling distance while visiting each city exactly once and returning to the starting city?". TSP is a
12
classic example of NP-hard problems in operations research that cannot be solved using a polynomial time algorithm.
To describe what an NP-hard problem is, problem definitions and classes of computational complexity theory should be examined. There are various kinds of computational problems in computational complexity theory that classified according to the possible algorithm to solve that problem. For P (polynomial time) problems, there is a polynomial time algorithm to solve it. For NP (nondeterministic polynomial time) problems, a given solution can be verified as a solution in polynomial time. This means that for NP problems we may not have an efficient way of finding a solution for a NP problem, but if we have any solution we can verify this solution. Nondeterministic polynomial time means when the input size to an algorithm for these problems increases, execution time of the algorithm increases exponentially. NP-hard problems is a class of problems which is neither a sub class of NP problems nor P problems. A problem is NP-hard if it is as hard as any NP-problem, or maybe harder. That means an NP-hard problem is at least as hard as the hardest problems in NP.
The picking sequence problem is a generalization of TSP meaning it is also an NP-hard problem. Usually heuristics and meta-heuristics such as tabu search, simulated annealing, genetic algorithm are commonly used to solve this type of combinatorial optimization problems. In this study, the problem of finding the best picking sequence that minimizes total travelled distance for an order picker in a multi-block warehouse, is solved with one of the most frequently used meta-heuristic methods: genetic algorithm.
There is no known algorithm that can solve picking sequence problem precisely and usually heuristics and meta-heuristics such as tabu search, simulated annealing, genetic algorithms are commonly used to solve this type of combinatorial optimization problems. In this study, the problem of finding the best picking sequence that minimizes total travelled distance for an order picker in a multi-block warehouse, is solved with one of the most frequently used meta-heuristic methods: genetic algorithm (GA).
Although there is an optimal procedure for a two-block warehouse suggested by [8], it is reported that implementation of optimal procedure may lead to unpredictable computation times. Therefore, a comparison of total travelled distance results of picking sequence
13
problem are reported using genetic algorithm under different settings, in comparison to S-Shape and Largest-Gap heuristic algorithms.
The study is organized as follows. In Chapter 2, a literature review is given regarding order picking and genetic algorithm. The problem description takes place in Chapter 3. The proposed solution methodology is presented in Chapter 4. Genetic Algorithm approach is detailed in Chapter 5. Chapter 6 contains parameter tuning. S-Shape and Largest Gap heuristics are explained in detail in Chapter 7. Computational tests are reported in Chapter 8. Conclusions are drawn in the last chapter.
14
2. LITERATURE REVIEW
There are numerous studies in the field of order picking and warehousing. To present classifications of order picking systems and routing heuristics for single block warehouses, review of [3], which is about manual order picking processes regarding layout design, storage assignment techniques, order batching, zoning, routing strategies, order accumulation and sorting methods, is analyzed. A taxonomy developed by [10] is also considered to classify order picking systems into five categories as “Picker-to-parts”, “Pick-to-box”, “Pick-and-sort”, “Parts-to-picker” and “Completely automated picking”. [11] provides a literature review about order picking systems as well. Categorization of order picking systems, components of order picking time, factors affecting order picking process and routing heuristics are topics covered by the survey which is broadly used for the introduction part of this study.
This study is focused on improving order picking performance of a multi-block warehouse so a performance basis for multi-block warehouses is needed to compare the proposed solution. To analyze solution approaches for multi-block warehouses, various studies for multi-block warehouses are examined. [6] considers a parallel-aisle warehouse. Average travel time is compared for warehouses with and without a middle aisle, through a simulation. Three factors are taken into account: warehouse size, warehouse layout (the presence or absence of a middle aisle; the number of aisles), pick list size. A routing algorithm is proposed where aisle changing is allowed, due to cross aisles. Also [8] introduces combined and combined+ routing heuristics in this study for warehouses with more than two cross aisles where items are stored randomly. The proposed heuristics use dynamic programming. The performance of the proposed heuristics is compared to a branch-and-bound algorithm under different warehouse layouts and pick list sizes. [12] studies order picking problem and compare optimal and heuristic algorithms, in terms of average travel time and total route time (which includes other activities such as administrative tasks, acquisition and dropping off pick carriers, in addition to travel time). [9] describes routing policies and storage assignment policies for multi-block warehouses. A simulation study
15
takes place to evaluate several storage assignment policies and routing policies for various layouts.
To analyze different management decision problems that warehouse managers encounter to improve warehouse productivity, reviews and studies based on main warehouse activities and policies are examined. [13] mentions basic warehouse functions, order picking strategies, automation, classification of order picking systems and warehouse equipment. [14] presents a literature review including classification of warehouses, strategic-tactical-operational warehouse decisions, storage location assignment problem, order batching, routing and sequencing issues. Storage location assignment is considered as an intermediate range management decision whereas routing, sequencing and order batching are considered as short range operational decisions. [15] reviews literature on warehouse design and control systems, focusing internal warehouse structure and operations. Warehouse characteristics regarding warehouse processes, warehouse resources, warehouse organization issues are covered. Warehouse design problems at strategic, tactical and operational level are examined. [16] presents a review and categorize operational level warehouse operation planning problems, based on four warehouse activities: receiving, storage, order picking and shipping. [17] compares several picking, storage and routing policies in manual order picking systems via a simulation study. The effect of these three decisions are examined on order picker travel time, with regards to reduction in total picking time by comparing to a baseline policy. The baseline policy refers to the actual policy of the firm which employs traversal routing and random storage. A sensitivity analysis is also conducted to explore the effect of order size, warehouse shape, location of pick-up/drop-off point, and demand distribution on order picker travel time.
[18] focuses joint order batching and order picking problems. A mathematical formulation is proposed for the joint problem, based on integrating bin packing problem and TSP. It is stated that bin packing problem is equivalent to order batching problem where bin represents the order picking vehicle and items to be packed are items to be picked. The aim is to find the assignment of orders to batches to minimize the number of batches subject to not exceeding the capacity of the vehicle. TSP is equivalent to obtaining the sequence of items to be picked. Moreover, two heuristic algorithms are suggested to be able to solve the problem within reasonable running time. This is because order batching and order picking
16
problems are said to be two key operational problems which must be solved frequently and require fast solutions.
[19] considers order picking problem where items can be stored in multiple locations, as opposed to general setting. A model is suggested for simultaneous determination of location assignments and picking sequence. However, given the complexity of the problem, TSP heuristics such as nearest neighbor and shortest arc are modified for the problem setting. Also, a tabu search algorithm is developed for the problem.
In terms of studies that describe and implement GA, [20] examines evolutionary algorithms, in specific, genetic algorithms. Steps and process of genetic algorithm, genetic operators, advantages of genetic algorithms and selection methods are explained. This study is mainly used to have a brief introduction to GA and to understand the functioning of GA.
Among diverse applications of GA to solve different problems in literature, studies proposed for warehousing problems using GA are concerned majorly. To be able to decide on selection method, crossover and mutation operators and to determine the value ranges of parameters to be used in GA in parameter tuning for crossover and mutation probability, the following studies are examined. [21] considers order picking problem in an automated single-block warehouse by taking travelling time into account. A GA is implemented which uses roulette wheel as selecting strategy, with the optimal individual preserving strategy (in other words, elitism). Solutions’ convergence situation in terms of total travel time is reported under different iteration times. [22] considers order batching problem where customer orders are grouped into batches optimally to minimize total travel distance by the help of a GA. The proposed algorithm can be applied to not only single-aisle or rectangular but any type of warehouse layout.
[23] proposes an order batch picking model which takes earliness and tardiness penalties into account, in addition to travel cost. Retrieving items earlier than their due date leads to piled up items around the warehouse. Retrieving items after their due date leads to transportation delays and customer dissatisfaction. Roulette wheel selection approach is employed. A multiple-GA method, which consists of two different GA-based algorithms, is constructed to solve the proposed model. The first GA algorithm is used to find an optimal order batching plan to minimize earliness and tardiness penalties and travel cost. The second
17
GA algorithm is utilized to obtain the optimal travel path within an order batch to minimize travel distance. A parameter tuning takes place to find best parameter combinations, regarding maximum number of iterations, crossover probability, mutation probability and population size.
[24] focuses on order batching problem in a low-level, picker-to-parts, single-block rectangular warehouse. A GA is presented which applies parameterized uniform crossover operation that mixes the information of two parents according to a fixed mixing ratio. An immigration operator is employed, instead of a mutation operator, by generating some new chromosomes as initial solution generation phase in order to provide genetic diversity and not to get stuck in local optima. [25] considers storage allocation and order picking problems in a single-block fast-moving consumer goods warehouse. Elitism is implemented by copying the first best two chromosomes to the next generation.
[26] focuses on order picking multi-objective optimization problem. The number of order pickers per shift and the best retrieving sequence of items are to be determined. Roulette wheel is used as a parent selection technique and order crossover is employed to generate offspring. Inversion mutation is incorporated. [27] proposes a dynamic mathematical model to solve small-size order picking problems by taking product life, customer importance, probabilistic demand and backordering strategy into account. A GA is proposed to solve similar large-size problems. Three metrics are used for performance comparison of two methods: Elapsed CPU time, number of fulfilled orders, quality of objective function.
[28] examines order picking problem in a multi-aisle automated warehouse to minimize total travel time of storage/retrieval machine. In the warehouse, each item can be retrieved from several storage locations. A GA is constructed which uses roulette wheel as selection method and partially matched crossover as crossover operator. Two performance measures, CPU time and travel time, are analyzed.
[29] considers the problem of a film-copy deliverer, as an extension of TSP. There is an analogy between order picking problems and TSP such that order picker is analogous to salesman whereas items to be picked are analogous to cities to be visited. Therefore, film-copy delivery problem is also similar to order picking problem. In this problem, there are
18
several cinemas and only one film-copy. The duty of the deliverer is to bring the film-copy to each cinema based on the predetermined show times. A GA is developed for which a new crossover operator is designed to prevent illegal offspring and a new mutation operator is designed to mutate offspring. [30] investigates the relationship between order picking problem inside warehouse and vehicle routing problem outside warehouse for conventional single-block and multiple-cross aisle warehouses. A GA-based approach is proposed to solve these problems in a hierarchical manner. [31] solves order batching and pick routing problems simultaneously via GA based methods. Two new GA-based methods are proposed that can be employed for both conventional single block and multi-block warehouses. Roulette wheel is used as selection method.
Based on the examined studies in literature, it can be said that order picking is a popular subject among researchers and a real problem encountered by warehouse practitioners in logistic companies. Moreover, GA is one of the mostly preferred meta-heuristics to solve combinatorial problems, like order picking.
19
3. PROBLEM DESCRIPTION
This study is focused on improving order picking routing strategy of Ekol Logistics, an integrated logistics company providing warehousing services in Turkey. One of its distribution warehouses, namely Mimoza, is examined as a case for its order picking and routing policies.
Similar to most distribution warehouses, the facility has its forward pick area and reserves storage area separated. In reserve storage area, items are kept in large container boxes placed on racks and in stacks loaded on pallets from which case picks are done to restock forward pick area when needed. In forward pick area where order picking activity takes place, random storage assignment policy is used to replenish SKUs (stock keeping units) that are stocked on multi-level carton flow racks. A well-established stock-location system is actually being used to keep track of SKU locations supported by labeled carton flow racks with definite stock-location address.
Manual, low-level, human employing picker-to-parts system is established as order picking system in forward pick area. SKUs are actually item cartons of identical size that contains multiple quantities of same product that order pickers extract required number of products from them in order to retrieve items on their pick list. Order pickers use equipment such as radio frequency (RF) hand terminals and picking carts to run their order picking operations. RF hand terminals are used to track assigned pick lists efficiently and to document picking transactions. Picking carts with a maximum capacity of 100 items are used to gather and carry items.
Order pickers start and finish their route on P/D point where pick lists are generated and finalized as a required operation for pickers to proceed and terminate travelling activity. On the assigned pick list that order picker can access through RF hand terminal, order picker selects any main aisle having at least one pick location and can see any pick item address with its block number and shelf number. During travelling activity, order pickers can traverse
20
all aisles in both directions, can change direction within vertical sub-aisles any time and can change their main aisle in any of cross aisles, at the front end and at the rear end of pick area. Order pickers having pick item location decide their route to that location themselves.
When order picker finishes his route to the pick location, there is no reaching or bending activity for order pickers to access pick locations traversing vertical sub-aisles. These vertical sub-aisles are narrow enough for order pickers to extract and pick from both sides of them without changing position. When picker finishes collecting all pick items in a sub-aisle of a block, usually he proceeds to the sub-sub-aisle of next block until he reaches the rear aisle, selects any other main aisle having at least one pick location through RF hand terminal and changes main pick aisle at the rear end to that selected main aisle. Following this behavior, routing strategy of warehouse may be named to S-Shape (traversal) heuristic due to its resemblance. If there is no pick location in the sub-aisle of next block, he may also change pick aisle in cross aisle to pick any pick item nearby before returning to P/D point to deposit all picked items. An order picker does not always turn back to deposit point with fully loaded (100 items) picking cart. Sometimes, when the picking cart is quarterly loaded (25 items) or half loaded (50 items), he may go to the deposit point to unload the cart due to size or urgency of the order.
For the investigated warehouse facility, some detected problematic points need to be fixed to improve the performance of order picking process. Order pickers decide their route to reach any pick location. Minimum travel time and travel distance to any pick location of pick list is not guaranteed. Without any specific routing policy, when order picker decides his own route for any pick item in a pick list during daily travelling activity, travelled time and travelled distance may become excessive. Order picker may decide to change his route any time according to subjective proximity of next pick location on pick list. Order picker does not know which picking sequence of pick items ensures minimum total travelling distance. He only takes action observing the next pick location's closeness.
Taking the aforementioned problems into account for the warehouse under consideration, a generalized solution to increase order picking productivity is formulated, which can be used for all multi-block warehouses.
21
For enhancing order picking performance through an order picker routing policy, this study concentrates on answering the following question:
“Given a set of item locations of a pick list, what is the best picking sequence (accordingly, the best route) to follow by an order picker to minimize total travelled distance during order picking process?”
3.1. WAREHOUSE LAYOUT
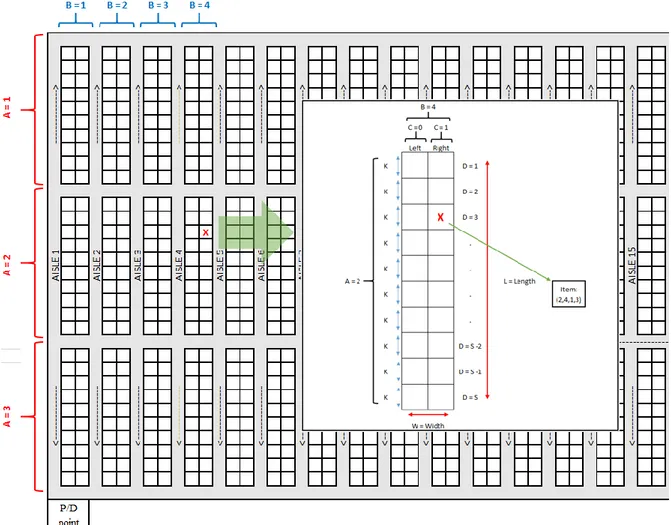
As seen in Figure 3.1, a P/D point takes place in the front aisle in the lower left corner when order picking area is seen from top projection. In the order picking area, there are 3 blocks of totally 30 carton flow rack systems that are all two-sided. These 30 carton flow rack systems form 31 vertical aisles on each block. There is a front and a rear aisle and 2 cross aisles in-between which make up 4 horizontal aisles. Each carton flow rack system has equally sized 10 locations to store on any side.
Properties of layout can be summarized as: • Number of blocks: 3
• Number of carton flow rack system in a block: 30 • Number of vertical aisles: 31
• Number of horizontal aisles: 4
• Number of shelf per carton flow rack system: 10
The dimensions of the warehouse are as follows:
• S: Number of shelf per carton flow rack system (S = 10) • K: Length of a shelf (K = 2.77 m)
• W: Carton flow rack system width (W = 1.2 m) • L: Carton flow rack system length (L = 27.7 m)
22 F igure 3. 1 . F orw ard Pi ck Ar ea L ayout
23
3.2. ITEM COORDINATE SYSTEM
An item coordinate system is developed to address any possible pick location on any carton flow rack system on pick area layout. An item is represented by a quartet (A,B,C,D) where:
• A: Horizontal block index, (A=1,2,3)
• B: Vertical block carton flow rack system index, (B=1,2,…,29,30) • C: Side of carton flow rack system, (C=0: Left; C=1: Right) • D: Shelf index, (D=1,2,…,10)
An example of an item representation is given in Figure 3.2.
24
The proposed item coordinate system is used in computationl tests while generating random pick lists to measure the performance of the constructed solution methodology. There are 1800 item locations inside the order picking area. Items in pick lists are generated randomly based on these possible item locations.
3.3. ASSUMPTIONS
The following assumptions hold within the framework of this study:
• All order data and pick lists are known beforehand. • The locations of items are known a priori.
• Items are retrieved from storage locations with horizontal travel; vertical movement of picking is disregarded.
• A picker-to-parts warehouse system is assumed. • The storage size in each location is identical.
25
4. SOLUTION METHODOLOGY
A two-phase solution methodology is proposed to solve the picking sequence and routing problem. In the 1st phase, a mathematical model takes place which is taken from the study, entitled “An Application of Warehouse Order-Picking Route Optimization Design at Ekol Logistics” by [32]. The mathematical model gives the shortest path and the shortest travelled distance between only two items whose coordinates are given through the item coordinate system mentioned in Section 3.2. The warehouse dimensions K, S, W and L that are shown in Figure 3.2. are parameters of the mathematical model to be solved in first phase and are given as input to this mathematical model. This model is solved for each pair of item in the pick list and a distance matrix is constructed which shows the shortest distance between every item pair. This distance matrix is a symmetric matrix since total travelled distance as going from the first to the second item is equal to the total travelled distance while going from the second to the first item.
While solving the optimization model for the 1st phase, an assumption is stated. It is assumed that there are “junction points” in the cross section of each aisle. A picker going from one item to another, firstly goes the starting item to the closest junction point, then passes from junction points until the last junction point closest to the ending item and goes to the ending item.
Let (i,j) represent the coordinate of a junction point where “i” and “j” values represent horizontal and vertical coordinates of a junction point, respectively. Value of ‘i’ runs up to 4 since the warehouse has 4 horizontal aisles and it increases when it goes to down direction, as shown in Figure 4.1. Value of ‘j’ runs up to 31 since the warehouse has 31 vertical aisles and it increases when it goes to right hand side.
26
Figure 4.1. Junction Points
In the 2nd phase, the aim is to find the picking sequence and the routing path of all items in a pick list during order picking so as to minimize total travelled distance. The outputs of the 1st phase, namely the shortest distance and the corresponding routing between each pair of items, become inputs for the 2nd phase where a genetic algorithm is implemented to find the picking item sequence of items in the pick list.
27
5. GENETIC ALGORITHM
If a pick list contains “N” items, the number of possible different picking sequences is (N!). In such combinatorial problems, meta-heuristics such as genetic algorithm, works well in general. As mentioned before, order picking is a short-term decision and must be frequently done in daily warehouse operations. The company picks on the average 6000 items daily. The picking cart can take at most 100 items, which means that this problem must be solved at least 60 times in a day, on the average. Therefore, running time is an important factor for order picking problem. Genetic algorithm does not guarantee optimality but it gives good solutions within tolerable computer running times. GA imitates natural evolution process in computer environment. GA is developed based on ideas regarding natural selection and genetics. GA grounds on the survival of the fittest among individuals.
In GA methodology, each individual represents a possible solution to picking sequence problem in terms of a picking route and is encoded as a chromosome. A chromosome is composed of a set of genes representing items to be picked. Chromosome and individual are used interchangeably. The evolution is an iterative process generating new individuals from present individuals of the population. A population is a set of individuals with the same length of genes to be mated to form individuals, referring a set of potential solutions to evolve toward better solutions. Population size is the number of chromosomes to be generated in a population. Population in each iteration is a generation.
For picking sequence problem domain, permutation encoding works better among other encodings because picking sequence is an ordering problem. Each solution is basically a tour starting from P/D point and ending on P/D point as well, where a picking sequence tour is encoded by a sequence of integers indexing all pick locations. P/D point is considered to be a pick location, as well. The concepts and mechanisms of GA will be given through an example as follows. For this example, P/D point is represented by index 1. An important characteristic of a tour is the order of the genes but not their absolute position hence (15432) and (54321) represent the same solution, since (1 5 4 3 2 1) and (5 4 3 2 1 5) represent the same cycle as shown in Figure 5.1.
28
Figure 5.1. An Example of a Tour for Picking Sequence
The first step of GA is to create an initial population and to identify it as the first generation of the population. Consider a 4-item pick list where each chromosome is composed of 5 genes encoded with path representation. Let N represent the population size. For a population size of N = 4, suppose the following four chromosomes are generated randomly as the initial population: {(15432) – (32451) – (24513) – (43521)}. Then, these chromosomes are identified as the 1st generation.
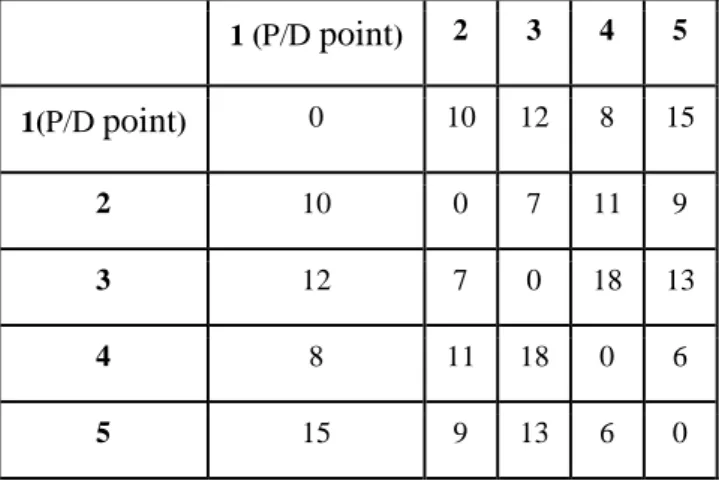
Suppose that, Table 5.1 shows the shortest distance matrix between each pair of 5 pick locations which is obtained from the 1st phase of solution methodology.
Table 5.1. Sample Shortest Distance Matrix for a 4-Item Picklist (in meters)
1 (P/D point) 2 3 4 5 1(P/D point) 0 10 12 8 15 2 10 0 7 11 9 3 12 7 0 18 13 4 8 11 18 0 6 5 15 9 13 6 0
29
Having a new generation ready, GA always evaluates each chromosome of the new generation using fitness function and tests for the termination criterion to decide whether to continue to evolve one more generation or to terminate the process.
A fitness function is an evaluation function that determines which solutions are better than others. It is generally a utility function to be maximized. The objective in order picking problem is to minimize total travelled distance during picking all items in a pick list. Therefore, this minimization problem must be converted into a maximization problem. Fitness function of each individual can be computed using the formula below:
𝑭𝒊𝒕𝒏𝒆𝒔𝒔 𝒔𝒄𝒐𝒓𝒆 𝒐𝒇 𝒊𝒕𝒉 𝒄𝒉𝒓𝒐𝒎𝒐𝒔𝒐𝒎𝒆: 𝒇(𝒙𝒊) =
𝟏
𝑻𝒓𝒂𝒗𝒆𝒍𝒍𝒆𝒅𝑫𝒊𝒔𝒕𝒂𝒏𝒄𝒆(𝒙𝒊)
𝒘𝒉𝒆𝒓𝒆 𝒊 = 𝟏, 𝟐, … , 𝑵
TravelledDistance(xi) gives the total distance travelled, based on ith chromosome. If TravelledDistance(x1) < TravelledDistance(x2), then f(x1) > f(x2), which means x1 is preferable to x2 (that is, x1 is fitter). Then, a fitter chromosome (a better picking sequence) has a larger fitness value (equivalently, less total travelled distance). Based on the given shortest distance matrix, total travelled distance for the chromosome (15432) is calculated by adding all shortest distances of picking sequence of all items. As given in Table 5.1, all shortest distances from source item to destination item for (15432) are:
• 1 5 : 15 • 5 4 : 6 • 4 3 : 18 • 3 2 : 7 • 2 1 : 10
The total travelled distance and fitness score of each chromosome for the 1st generation are computed in Table 5.2.
30
Table 5.2. Total Travelled Distance (in meters) and Fitness Score of the 1st Generation
Chromosome Total travelled distance
(meters) Fitness score
15432 15+6+18+7+10 = 56 1/56 = 0.01785714
32451 7+11+6+15+12 = 51 1/51 = 0.01960784
24513 11+6+15+12+7 = 51 1/51 = 0.01960784
43521 18+13+9+10+8 = 58 1/58 = 0.01724138
In this study, termination criterion is selected as meeting a condition such that fitness of the chromosome with the best fit does not change during a pre-defined number of generations (in other words, reaching a pre-defined number of stagnant iterations). For the example GA run, pre-defined number of stagnant iterations is specified as 2. Since (32451) and (24512) yield the same fitness score, based on an arbitrarily selection between these two choromosomes, the chromosome with the best fitness is set as (32451) with fitness value: 0,01960784. GA test termination criterion is not met since generation count having stagnant fitness value of 2 is not reached yet so GA continues to evolve one more generation.
To form new individuals (offspring) for the next generation, GA operates 4 successive mechanisms:
1. Selection (Reproduction) 2. Crossover (Recombination) 3. Mutation
4. Reinsertion (Survival)
5.1. GENETIC ALGORITHM MECHANISMS
5.1.1 Selection (Reproduction)
Selection is the process of determining how to choose parents for mating. Each parent is evaluated based on their fitness score. Then, a mating pool is created. The expectation is that average fitness is to be increased in successive generations, due to the fact that, the best parents are selected for breeding to produce better children.
31
In this study, roulette wheel selection method is preferred where the probability of selection is proportional to fitness value of a chromosome. By this way, a fitter chromosome (corresponding to a shorter travel distance) has a larger chance to be chosen for mating. To implement this method, sum of fitness values over all individuals is calculated. Probability of being selected is calculated as shown below:
𝑷𝒓𝒐𝒃𝒂𝒃𝒊𝒍𝒊𝒕𝒚 𝒐𝒇 𝒔𝒆𝒍𝒆𝒄𝒕𝒊𝒏𝒈 𝒊𝒕𝒉 𝒄𝒉𝒓𝒐𝒎𝒐𝒔𝒐𝒎𝒆: 𝑷(𝒙𝒊) =
𝒇(𝒙𝒊) ∑𝑵𝒊=𝟏𝒇(𝒙𝒊)
𝒘𝒉𝒆𝒓𝒆 𝒊 = 𝟏, 𝟐, … , 𝑵
Fitness value of each chromosome over sum of all fitness values gives the probability of being selected for that chromosome. The larger fitness value the chromosomes has, the higher chance to be selected and the bigger slice of the roulette wheel they fall into. Cumulative probabilities are calculated to map individuals to contiguous intervals in the range of [0,1]. Then, for each individual to be selected, a random number is generated in the interval [0, 1] and the individual whose segment spans the random number is selected as a parent for reproduction. This process is repeated until the number of chromosomes equals to the population size.
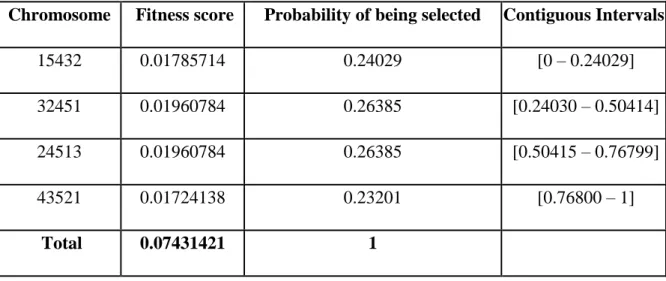
For the example GA run, selection probabilities and intervals are listed in Table 5.3:
Table 5.3. Selection Probabilities
Chromosome Fitness score Probability of being selected Contiguous Intervals
15432 0.01785714 0.24029 [0 – 0.24029]
32451 0.01960784 0.26385 [0.24030 – 0.50414]
24513 0.01960784 0.26385 [0.50415 – 0.76799]
43521 0.01724138 0.23201 [0.76800 – 1]
32
Figure 5.2 shows so-called roulette wheel of the selection mechanism reflecting the selection of chromosome’s chance of being selected. Pie chart is selected as a tool to present roulette wheel due to its analogy.
Figure 5.2. Roulette Wheel Representation for Selection Method
4 random numbers are generated between [0,1] to select from roulette wheel: {0.638425, 0.48754, 0.045572, 0.439298}. Chromosomes for which any random number falls between their mapped interval of probability are selected to mating pool. Table 5.4 shows how to select chromosomes for mating pool at the end of selection process.
Table 5.4. Mating Pool Generation
Random number Fallen mapped interval
Corresponding chromosome to be selected (Mating pool) 0.638425 [0.50415 – 0.76799] 24513 0.48754 [0.24030 – 0.50414] 32451 0.045572 [0 -0.24029] 15432 0.439298 [0.24030 – 0.50414] 32451 [ 1 5 4 3 2 ] [ 3 2 4 5 1 ] [ 2 4 5 1 3 ] [ 4 3 5 2 1 ] [ 1 5 4 3 2 ] [ 3 2 4 5 1 ] [ 2 4 5 1 3 ] [ 4 3 5 2 1 ]
33
Selection (reproduction) process ensure the population is enriched with better individuals. Reproduction makes clones of better solutions but does not search for new solutions. The search of the solution space is mainly done by crossover mechanism. Selection mechanism supplies mating pool to crossover mechanism as an input of individuals with better genes.
5.1.2 Crossover (Recombination)
Crossover is combining pairs of parents to create new individuals or offspring. Two children are produced from two parents through a crossover operator which is a function that gets some of genes from one parent and the rest from the other parent to form two offsprings. The expectation is that the newly formed chromosomes have good genes of old chromosomes.
It is a good practice not to allow crossover mechanism to be performed for all individuals in a population to keep some selected chromosomes of a population as genetic memory. Here comes a question about which chromosomes will be subject to crossover operation and which survival mechanism will be used for chromosomes that will not be crossed over. Crossover probability, represented by Pc, is the parameter of GA that states how often crossover mechanism will be performed. For the example GA run, crossover probability is taken as 0.7. A random number is generated between (0,1) for each chromosome pair in the mating pool and if that random number is less than or equal to the crossover probability, crossover operation is performed. Otherwise, crossover operation is not performed for that pair of chromosomes. Table 5.5 shows how GA decides to perform crossover operation on selected chromosomes of old population in mating pool.
Table 5.5. Implementation of Crossover Probability on the Mating Pool
Chromosome pairs in mating pool
Crossover
Probability Random number Selected for Mating?
(24513 & 32451) 0.7 0.214939833 0.214939833 <= 0.7 Yes (15432 & 32451) 0.7 0.790672194 0.790672194 > 0.7 No
34
As seen in Table 5.5, (24513 & 32451) chromosome pair is selected for mating so two parent chromosomes (24513) and (32451) are selected for mating. Suppose that, a crossover operation is performed and the produced offspring turn out to be (34521) and (52413), which become two individuals of the next generation. If the number of new indiviuals formed is not equal to the population size as in this example, a reinsertion operation is required to reach a population size of 4.
Following crossover operation, two offspring resulting from crossover operation are subjected to mutation operation. Crossover mechanism supply generated offspring to mutation mechanism as input.
5.1.3. Mutation
Mutation is introducing new genetic material in the population by randomly altering some selected genes of offspring chromosomes generated by crossover operation. An original offspring turns into a mutated offspring. Usually mutation operator maintains genetic diversity in the population and prevents to get stuck in a local optimum.
Mutation probability represented by Pm, is the parameter of GA that determines which offspring will be subject to mutation operation. For the example GA run, mutation probability is taken as 0.01. Likewise crossover probability, a random number is generated between (0,1) for each offspring that are formed at the end of crossover operation and if that random number is less than or equal to the mutation probability, mutation operation is performed. Otherwise, mutation operation is not performed for that offspring and it stays as it is.
There are only 2 newly generated offspring chromosomes out of crossover operation. Table 5.6 shows how GA decides to perform mutation operation on generated offspring by crossover operation. No mutation operation will take place for (34521). (52413) is selected to mutate. Suppose that, through a mutation operator the mutated offspring turns out to be (53412).
35
Table 5.6. Implementation of Mutation Probability on Formed Offspring
Mated Chromosomes
Mutation
Probability Random number Selected for Mutating?
34521 0.01 0.394763129 0.394763129 > 0.01 No 52413 0.01 0.008672194 0.008672194 <= 0.01 Yes
From one generation to another, population size should remain fixed. However, during crossover operation, if one of the generated random numbers is less than the crossover probability for a chromosome pair and that pair is not selected for mating, fewer individuals than population size may be produced. Then, reinsertion mechanism is the remedy for inserting remaining chromosomes to complete the population size.
5.1.4. Reinsertion (Survival)
The difference between population size and the number of chromosomes reproduced through evolution is termed a generation gap. Reinsertion mechanism is used to decide which chromosomes should survive and be inserted to the next generation, in case of a generation gap.
Reinsertion mechanism to be used in this study is preferred to be elitist method. Elitist reinsertion keeps the fittest parents to the next generation. It enables preserving a few best chromosomes ever encountered to the successive generations.
For the example GA run, the population size is 4 and 2 offspring chromosomes are produced through crosoover operation, hence generation gap to be filled is 2 chromosomes. To select fittest parents, GA ranks all chromosomes of the mating pool accordin to their fitness value and inserts 2 top-valued chromosomes of this ordered list to the next generation. Table 5.7 shows how GA runs elitist reinsertion to select chromosomes to be reinserted to the next generation.
![Figure 1.1. Distribution of Warehouse Operating Expenses, ([2])](https://thumb-eu.123doks.com/thumbv2/9libnet/4251797.67568/15.892.203.752.146.418/figure-distribution-warehouse-operating-expenses.webp)
![Figure 1.2. Classification of Order Picking Systems, ([3])](https://thumb-eu.123doks.com/thumbv2/9libnet/4251797.67568/16.892.152.832.299.712/figure-classification-order-picking-systems.webp)
![Figure 1.3. Distribution of Order Picker’s Time, ([2])](https://thumb-eu.123doks.com/thumbv2/9libnet/4251797.67568/18.892.212.754.629.932/figure-distribution-order-picker-s-time.webp)
![Figure 1.4. Routing Policies for Single-block Warehouse, ([3])](https://thumb-eu.123doks.com/thumbv2/9libnet/4251797.67568/20.892.150.809.144.905/figure-routing-policies-single-block-warehouse.webp)
![Figure 1.5. Routing Policies for Multi-block Warehouse ([9])](https://thumb-eu.123doks.com/thumbv2/9libnet/4251797.67568/23.892.151.837.148.757/figure-routing-policies-multi-block-warehouse.webp)