Special Issue on Applied Economics and Finance
An Integrated AHP-TOPSIS Approach for Terminal Selection
Problems in the Logistics Management Perspectives of Marine
Container Ports: A Case Study for Turkey’s Container Ports
and Terminals
1
Deniz Konteyner Limanları Perspektifinde Terminal Seçimi için Entegre bir
AHP-TOPSIS Yaklaşımı: Türkiye’nin Konteyner Liman ve Terminalleri İçin
Örnek bir Uygulama
Omer Faruk GORCUN, Kadir Has University, Turkey, [email protected]
Abstract: This study focuses on the strategic importance of container port selection with regard to container operator companies, logistics firms and other actors of a supply chain. The main focal point of this paper deals with two important questions: how a container port and terminal is selected by logistics and marine container operators and what is the most important factors for decision makers. When an answer is seeking to these questions, initially it should be necessary to determine the selection criteria and decision alternatives in detail. In order to select proper and optimal container port and terminal, the Analytic Hierarchy Process (AHP) theory and Technique for Order Preference by Similarity to Ideal Solution (TOPSIS) method were selected and these methodologies were integrated to solve decision-making problem that related to container port selection. This study consists of five stages. In the first stage, a literature review was made. AHP and TOPSIS methods were defined and their steps of these methodologies were shown in the second stage of this study. In the third stage, numerical analysis was realized by using an integrated AHP-TOPSIS methods as a hybrid method. In the fourth stage, the obtained results were evaluated and depth analysis was made by the member of the board of experts. In the final stage, this study was summarized and final results were shown and the contribution of this hybrid method to the literature concerning with the container port selection process was evaluated. In this study, the board of experts that consisted of seven members was constructed and they are professionals who play an important role in the decision making processes in their companies. Therefore, while the members of the board of experts were selected by the researcher, to be the senior executive or company owner in the field of the maritime transportation sector was determined as the main rule. All selection criteria, decision alternatives and the main goal of this study were determined in the roundtable meetings that realized with together the board of experts. Pairwise comparison questions were prepared by the researcher and were directed to the selected thirty decision makers who work in the field of maritime as the senior executive.
Keywords: AHP-TOPSIS Methods, Container Port Selection, Logistics, Maritime Transportation
Öz: Bu çalışma konteyner operatörü işletmeler, lojistik firmalar ve tedarik zinciri aktörleri ile ilgili konteyner liman seçiminin stratejik önemine odaklanmaktadır. Bu çalışmanın temel odak noktası iki önemli soruyla ilgilidir: denizyolu ve lojistik konteyner operatörleri konteyner liman ve terminallerini nasıl seçiyorlar ve karar vericiler için en önemli faktörler nelerdir? Bu sorulara bir cevap arandığında, ilk olarak seçim kriterleri ve karar noktalarının detaylı bir biçimde tanımlanması gerekmektedir. Optimal ve en uygun konteyner limanı ve terminalini seçmek için Analitik Hiyerarşi Prosesi (AHP) ve İdeal Çözüme Benzerlik Yaklaşımı Tekniği (TOPSIS) yöntemleri seçilmiş ve bu metodolojiler konteyner limanı seçimi ile ilgili karar verme problemini çözmek için entegre edilmişlerdir. Bu çalışma beş bölümden oluşmaktadır. Birinci aşamada bir literatür taraması yapılmıştır. Bu çalışmanın ikinci aşamasında AHP ve TOPSIS metotları tanımlanmış ve bu metodolojilerin uygulama adımları gösterilmiştir. Üçüncü aşamada hibrid bir metot olarak entegre AHP ve TOPSIS yöntemleri kullanılarak sayısal bir analiz gerçekleştirilmiştir. Dördüncü aşamada elde edilen sonuçlar değerlendirilmiş ve uzmanlar kurulu üyeleri ile derinlemesine analiz edilmiştir. Son aşamada bu çalışma özetlenmiş ve nihai sonuçlar gösterilmiş, bu hibrid metodun konteyner limanı seçimi ile ilgili literatüre katkıları değerlendirilmiştir. Bu çalışmada yedi üyeden oluşan uzmanlar kurulu oluşturulmuştur. Bunlar kendi şirketlerinde karar alma süreçlerinde önemli rol oynayan profesyonellerdir. Bu nedenle uzmanlar kurulu üyeleri araştırmacılar tarafından seçilirken, deniz taşımacılığı sektörü alanında şirket sahibi ya da üst düzey yönetici olmaları temel kural olarak belirlenmiştir. Bütün seçim kriterleri, karar alternatifleri ve çalışmanın temel amacı uzmanlar kurulu ile gerçekleştirilen yuvarlak masa toplantılarında belirlenmiştir. İkili karşılaştırma soruları araştırmacı tarafından hazırlanmış ve denizcilik alanında üst düzey yönetici olarak çalışan otuz seçilmiş karar vericiye yönlendirilmiştir.
Anahtar Kelimeler: AHP-TOPSIS Yöntemleri, Konteyner Liman Seçimi, Lojistik, Denizyolu Taşımacılığı
1. Section Heading
Ports and terminals have always played a vital role in international transportation and continue to play an important role in global transport chains. After the second half of this century, container transportation has started to gain ever-increasing importance compared to other transportation modes due to it has led to gain time for operators and other actors of supply chains. Therefore, container ports and terminals have become an extremely important element of global logistics activities,
1Bu çalışma Ömer Faruk Görçün özet bildirisi olarak, “ICOAEF’18, IV. International Conference on Applied Economics and Finance &
EXTENDED WITH SOCIAL SCIENCES, November 28 – 29 – 30, 2018 / Kuşadası – Turkey” Kongresinde sanal oturumda sunulmuştur ve kongre procedia özet kitapçığında basılmıştır.
34
in parallel with using larger ships in maritime transport activities and rapid growth in container flows. Performance and effectiveness of container ports can determine the competitive power of logistics firms as well as companies.
Selecting the best or proper container port has become obligated for container operators in order to maintain their competitive position in the maritime transportation market. Essentially, the container port selection is one of the critical decisions for international container transport operators. Selecting the best container port is extremely important in order to obtain some advantages such as lower transportation costs, the more secure transport environment, higher quality in logistics services, the velocity of logistics flow at high speed, and so on. Therefore, the selection of proper and optimal marine container port has become one of the vital issues for not only the global maritime transportation sector, but also all global supply chains because a container port where selected in an optimal way provides sustainability, flexibility and operational perfection and it can bring the competitive advantages from the viewpoint of members of the supply chain in addition to maritime container operators.
Essentially, container port selection is an extremely complex process because many factors and variables can affect results, more importantly, they can lead to change the results. Therefore, the decision-making problem relating to it cannot be solved without using a multi-criteria decision-making method. In this study, the AHP (the analytical hierarchy process) and TOPSIS (Technique for Order Preference to Similarity by Ideal Solution) methods were integrated as a hybrid mathematical model and the container port selection process was analyzed by using this hybrid methodology. Turkey's container ports were selected to use for a case study. The main objective of this study is to determine container port selection criteria and decision alternatives as well as their relative priority values.
This paper presents an extensive solution way to determine the selection criteria and decision alternatives. All factors that have the potential to affect the results have been determined by the board of experts that consists of seven members. Members of this working group were selected among the professionals who play important roles in their maritime transport companies as a senior executive or company owner. Selection criteria are determined as the sufficient draft, total vehicle capacity, the total length of quays, maximum length of ships that can berthing, number of liners, total storage capacity, total operational costs, safety and security of container port, container port location. The decision alternatives can be listed as the Port of Mersin, Port of Haydarpaşa, Port of Samsun, Ambarlı Port, Port of Gemlik, Port of Tekirdağ, Port of Marmara Ereğli, Port of Derince, Port of Aliağa.
The study consists of five sections. In the second section this study has been summarized and the literature review is shown. In addition to that, its contributions to literature relating to container port selection are discussed in this section. In the section of the third, the hybrid model is defined and its applying steps are shown. Numerical analysis is carried out in accordance with obtaining data in the fourth section and the priority values of the selection criteria are calculated and they are ranked according to their importance levels.
After that, the decision alternatives are evaluated from the perspective of the selection criteria and their importance levels by using a proposed hybrid mathematical model that integrated AHP and TOPSIS methods. As a result, all decision alternatives are ranked and the best decision alternative relating to container port selection is determined. In the fifth section, the obtained results are evaluated by the board of experts. The results of this study are discussed in the sixth and final section.
2. Literature Review
When the previous studies relating to container port selection process are considered, it can be seen that most of them focused on various and different selection criteria and decision options. On the other hand, some factors that focused on the previous studies are the same. Brian's study (Brian 1985) considered the eleven selection criteria such as port safety and security, the size of a port area, inland freight rates, charges, service quality, free time, congestion of ports, number and capacity of handling equipment, number of quays, port locations, and multimodal transport links.
The selection criteria such as accessibility, operational capabilities, available logistics infrastructure were determined in the study that prepared by Hayuth (Hayuth 1980). Jansson and Shneers argued that feeder container transportation can provide some advantages only in exceptional cases depends on the sea route characteristics (Jansson and Shneers 1987). According to James and Gail, giving more frequent shipping service is the most important factor for container port selection (James and Gail 1988). In addition to that, reducing some problems that can occur in the container port can increase service demand relating to a port. Also, these problems can be accepted as the selection criteria. In the Thomson’s study, some factors, such as berthing time, length of quays, loading and discharge rate, the number of quays, containerization rate of cargo, the working time of ports, links between customers and ports, physical characteristics of ports have been accepted as the selection criteria (Thomson 1998). According to Sternberg, the geographical location of ports, competitive power of container operators, the advanced infrastructure of ports, the operational capability of companies that operate marine containers are the most important factors in order to be the most preferable container port (Sternberg 2000).
Malchow and Kanafani suggested that as an important factor, distances between ocean and inland can lead to negative effect concerning with the container port selection in their study that focused on US ports (Malchow and Kanafani 2004). Murphy et al. evaluated the port selection criteria from the viewpoint of all maritime transportation actors (Murphy et al. 1992). 47 selection criteria were determined in the study that conducted by Lirn et al (Lirn et al 2004). These criteria were evaluated by using the AHP method and some of them such as handling costs, available advanced logistics infrastructure, proximity to commercial centers, and feeder networks were determined as the most important selection criteria.
35
While Ha conducted a research related to port selection, he analyzed seven selection criteria such as quick information flow, variations in port services, port location, administration of port, operational costs and charges, the operating time between berthing and discharge, extra advantages (Ha 2003). Chou has suggested a fuzzy Multiple Criteria Decision Making (MCDM) method in order to find an optimal solution to the decision-making problems relating to port selection. This study was very successful compared to the previous studies and it has given extremely applicable results. According to the finding of this study, the most important factors concerning with port selection are costs, port efficiency and port location (Chou 2007).
Yeo et al. argued that the most important selection factors are advanced port services, operational costs, connectivity, and accessibility in the study that evaluated the competitive power of the major ports of North-East Asia (Yeo et al. 2014). Tongzon's study has analyzed the major factors that affect the port selection process and its main finding can be shown that port location, port efficiency, port services, charges, logistics infrastructure were determined as the most important factors that play key roles in the port selection process (Tongzon 2009). He carried out an empirical research about the port selection process together with shipping companies and this study has shown that are the most important selection criteria for the maritime transport operators.
Ernst found that if the cargo flow rate is increased in a port, this port can become a more preferable seaport by customers. Therefore, increasing the frequency of port service, providing the connectivity among the transport modes, increasing the cooperation among the logistics elements such as vessels, warehouses, storage areas, terminals, and etc. can lead to increase the cargo and the logistics flow rate (Ernst 2001).
Slack has surveyed marine ports, customers, and shipping companies that organize the marine container flow between European and American Ports to determine the container port selection criteria (Slack 1985). According to the Bird's study, the frequency of port services is the most important selection criterion relating to the port selection process (Bird 1988). There have been similar researches such as Willingale's study (Willingale 1984) and a study that conducted by Murphy et al (Murphy et al 1991).
In general, the most of these studies focused on the shipper's choices and their focal point is the selection of the best marine port from the viewpoint of maritime transport operators, freight forwarders, and carriers. Some studies that conducted by researchers such as Saleh and Lalonde (Saleh an Lalonde 1972), (Bardi 1973), (Brooks 2004), and (D’Este and Meyrick 1992) can be shown as successful examples of these kinds of researches. In some researches, common factors that affected results concerning with the container port selection found and they can be listed as capacity, frequency, flexibility, transit time, reliability, safety and security, quick response to demands, creating a quick solution for problems, strength cooperation, and monitoring operational process. The best examples of these studies were conducted by (McGinnis 1979), (Ogden and Rattray 1982), (Gilmour 1976), (Wilson et al 1986), and (D’Este and Meyrick 1992). They have found that the most important factor is the risks such as safety risks, operational risks, and financial risks. In addition to that, according to some researchers such as (Cook 1967), (Bayliss and Edwards 1970), Brooks, (Wilson et al 1986), and (D’Este and Meyrick 1992), port service quality should also be taken into consideration as an important factor in the port selection process.
According to D'Este and Meyrick's study, depending on the conducted survey of maritime transportation companies in Ro-Ro service, the selection criteria may be both qualitative and quantitative (D’Este and Meyrick 1992). Quantitative factors such as costs, distance, number of quays, and etc. Have measurable numerical values, on the other hand, qualitative factors are based on verbal judgments of the decision makers. These factors have not comparable numerical values, at least in the beginning. Rimmer showed that there are significant relations between port selection and port location and the location of a port can affect the decisions of shipping companies (Rimmer 1998). Chang argued that intermodality and transshipment can be accepted as the critical factors for the development of port infrastructure and competition power (Chang 2008). According to him, if intermodal cargo flow increases in a region, the marine port can reach to the more advanced level depending on the development of intermodality because an intermodal marine port can collect extra cargo from other feeder marine ports.
Heaver et al presented that there are two important and critical criteria can be determinative for the port selection and these factors can be defined as port location and network strategies (Heaver et al. 2001). According to them, if the port is close to their customers, it can have an important advantage in the way of being a selectable port. Nir et al conducted a research from the perspective of the choice behavior of maritime operators and shippers concerning with port selection (Nir et al 2003). Decision-making problems of decision makers about shipper, port, and carrier selection were examined by Tiwari et al by using a discrete choice model (Tiwari et al. 2003). According to them, the distance from the port is the most important factor and some factors such as traffic congestion in port, the service quality of port and line's fleet size are following this criterion from the point of importance values of these factors.
Another study that used a hybrid multi-criteria decision-making method is the research which carried out by Barysiene. She used an integrated method that consists of AHP and COPRAS methods. On the other hand, she evaluated the container terminal's technologies using this method. Therefore, it cannot be accepted as directly related to container port selection (Barysiene 2012). Ergin et al. conducted a study by using the ELECTRE Technique that is one of the multi-criteria decision-making methods. They determined some selection multi-criteria such as Infrastructure condition (IC), Port facilities and equipment (PFE), Port berthing time length (PBTL), Container handling efficiency (CHE), Container yard efficiency (CYE), Charge (PC), EDI computer system (EDI), Good reputation related to damage and delays (GRDD), Personnel quality (PQ). They found that the most important criterion is Charge, while the least important criteria are Port berthing time length and EDI computer system (Ergin et al 2016).
36
When the literature is reviewed, it can be seen that most of them focused on the similar selection criteria and mostly, they can discrete from each other in the terms of the number of the evaluated factors. On the other hand, because all of these studies focused on different seaports where located different area around the world, the obtained results are different from each other. The main reason for that is the selection process for each marine port can be influenced by different conditions, factors, and variables. On the other hand, most of these studies used the AHP method as a multi-criteria decision-making methodology in order to determine the most important selection criterion and relative importance value of these factors in addition to showing the best selection alternative. There are extremely few studies using a hybrid or integrated model. Perhaps, the one of the most successful examples of them is the study that conducted by Sayareh and Alizmini by using a hybrid method that consists of AHP and TOPSIS methodologies, they analyzed sixteen selection criteria and implemented this methodology in order to determine the most important selection criterion and the best decision alternative as a case study of the Iranian ports (Sayareh and Alizmini 2014). They found that the TOPSIS analysis has shown that working time, stevedoring rate, safety, port entrance, sufficient draft, capacity of port facilities, operating cost, number of berths, ship chandelling, and international policies are the top ten port selection attributes in the ports of the Persian Gulf, respectively. As another finding of this study, the AHP analysis has shown that shipping lines prefer to berth their container vessels on Jebel Ali, Shahid Rajaee, Dammam, Bushehr, Bik, and Jubal, respectively.
3. Research Methodoly
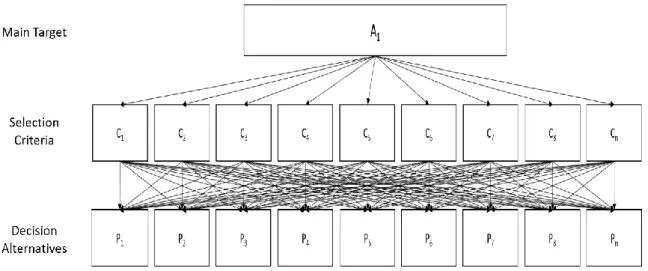
In order to evaluate the container port selection criteria, decision alternatives and determining the best and optimal container port in Turkey, a hybrid model that consists of AHP and TOPSIS methodologies that are the multi-criteria decision-making techniques was selected. The chosen methodology consists of eight steps. In the first step, a hierarchical model is constructed using the AHP methodology. The main target is to determine the selection criteria, decision alternatives, and the main aim of this research. In order to reach the more realistic, applicable, and rational results, this research was carried out together with professionals who play important roles in the maritime industry. Therefore, the board of experts was constructed by the researcher of this study. This working group consists of seven members, and they are professionals who working, at least for fifteen years as the senior executive or company owner in the field of maritime transportation. All factors and decision options have been determined by the board of experts in the roundtable meetings and workshops that realized in the way of brainstorms. They also determine the profiles of decision-makers who will direct the pairwise comparison questions. Correspondingly, thirty professionals who work in the maritime industry as a senior executive or company owner were selected. Also, a hierarchical model that is shown relations and connections among the factors was constructed in this step.
Figure 1. A Hierarchical Model for AHP
In the second step, the pairwise comparison questions have been prepared and directed to selected decision makers, taking into consideration the determined selection criteria and decision alternatives. They have given the answer to these questions and gave a score for relative importance value of each factor in the frame of the Saaty's 1-9 pairwise comparison scale. After the survey was completed, the geometric mean of giving scores for each comparison question is calculated and the numerical values of elements of the decision matrix that is an nxn dimensional square matrix are determined.
After the decision matrix was constructed, normalization operation is realized by dividing all elements of the decision matrix to the sum value of their column and B vectors for each column are obtained. Normalized matrix is constructed by collecting the all these vectors. The arithmetic mean of each row of this matrix shows the importance value of each selection criteria. At the end of this step, consistency analysis is done in order to determine this evaluation whether consistent or not. If the consistency ratio is equal to 0.10 or under the value of 0.10, conducted evaluation is accepted as
37
consistent. If it has exceeded this value, evaluation is not consistent and it should be necessary to return to the beginning steps of this process in order to make a re-evaluation of these factors. Applied steps from the first step to the fourth step are the steps of the AHP method. In addition to that, the importance value of the criteria also shows the weighted values of the factors that will be used in the next steps of this hybrid method.
The steps of the TOPSIS Technique are implemented from the third step to the sixth step. In the third step, a decision matrix that is the mxn dimensional rectangle matrix is constructed and while rows show the decision alternatives, columns represent the selection criteria. In the fourth step, the decision matrix is normalized and all elements values of this matrix are converted to the comparable values in this way. After that, elements of the normalized matrix are multiplied by the weighted value of selection criterion and the weighted normalized matrix is constructed. In order to determine distance values of the positive and negative ideal solutions are determined, this matrix is used.
In the fifth step, the distance values of the ideal and negative ideal solutions are calculated. If our expectation is the maximum value for any factor, it can be accepted as the maximum value in each column is the ideal solution, on the other hand, the minimum value of each column is the negative ideal solution. On the contrary, if the expectation is the minimum value of a factor, the minimum value of the column is the ideal solution and the maximum value is the negative ideal solution. After that, the relative distance of each element of the matrix from ideal/negative ideal solutions is calculated. In the sixth step, decision alternatives are ranked according to the obtained results and the alternative that has the highest score is defined as the best decision option. In the seventh step, all results are reviewed and analysis is completed.
3.1. The AHP Method
The AHP method is the multi-criteria decision-making (MCDM) methodology that was presented by Myers and Alpert in 1968 and was developed by Thomas L. Saaty in 1970. It has been the most preferred MCDM methodology. The AHP method can convert the verbal judgements of decision makers to the numerical and comparable values and it can include these verbal judgments in the decision making process. It can be accepted that it is the most important advantage of the AHP method. Consequently, it provides an opportunity to evaluate the decision making processes in a more rational and realistic perspective.
The AHP method applies in six steps. In the first step, the main aim, selection criteria, and decision options are determined. A hierarchical model that shows all relations among factors is constructed. In order to determine these factors, the board of experts that called as the working group is constructed. As well as all factors decision-makers who will give answers to the pairwise comparison questions are also determined by the board of experts.
At this stage, the pairwise comparison questions that prepared in the frame of determined factors by the board of experts are directed to the decision makers. They should make an evaluation between two factors in each question and should give a score for importance value of these factors that are compared according to the Saaty’s 1-9 pairwise comparison scale. The numerical values of elements of the decision matrix are determined by calculating the geometric mean of the obtained scores.
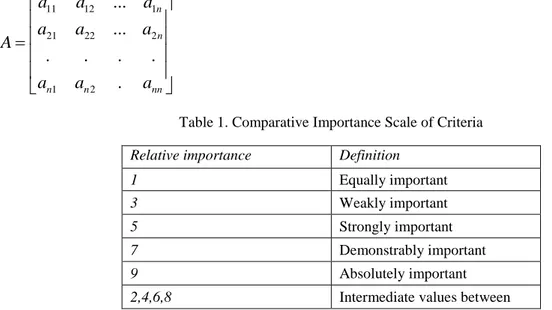
In the frame of the obtained results, the decision matrix can be constructed as shown below. Each element of the matrix shows the value that obtained as a result of the comparison between factor i and factor j.
11 12 1 21 22 2 1 2
...
...
.
.
.
.
.
n n n n nna
a
a
a
a
a
A
a
a
a
(1)Table 1. Comparative Importance Scale of Criteria
Relative importance Definition
1 Equally important
3 Weakly important
5 Strongly important
7 Demonstrably important
9 Absolutely important
2,4,6,8 Intermediate values between
If the score of the jth criterion is above the 1, the jth criterion is more important to kth criterion. On the contrary, if
this value is under the 1, the jth criterion is less important than the kth criterion. In addition to that, if both of them is taken
a score as 1, they have equal importance. In order to compute the importance value of the kth criterion compared with the jth criterion, the importance score of the jth divides into the 1 by using the Eqs 2. Finally, decision matrix can be constructed
38 1 ij ij n ij i a b a
(2)At the next step, each element of the decision matrix is divided into the sum of own column and this operation is called as the normalization. The normalization of all elements of the matrix A provides an opportunity for the calculation of the eigenvalue and the eigenvector. The sum of the obtained vectors constructs the normalized matrix C.
11 12 1 21 22 2 1 2
...
...
.
.
.
.
.
n n n n nnc
c
c
c
c
c
C
c
c
c
(3)Finally, the arithmetic mean of each row of the normalized matrix represents the importance score of each selection criteria. A selection criterion that takes the maximum score can be considered as the most important selection criterion. The sum of the scores should be equal to 1. These values also represent the weight value of selection criteria.
The consistency analysis is computed at the next stage. Calculating the consistency is extremely important in the perspective of to be usable of the obtained results in the evaluation process. İn order to calculate the consistency rate, decision matrix a is multiplied with vector w and the matrix D is constructed. Where w is the eigenvector, wi is the
eigenvalue of criterion i, and max is the largest eigenvalue of the pairwise comparison matrix. Firstly, the eigenvector and relative weights are computed and λmax is calculated by using the equation 4.
1 max
;
1, 2,..., ;
n i i i i ie
d
e
i
n
w
n
(4)After calculating the value of λmax, the value of consistency index is calculated according to the equation 5. Finally,
in order to compute the consistency rate, the value of consistency index is divided into the value of the random consistency index that obtained from the random index table of Saaty as shown in Table-2.
;
1
n
CI
CI
CR
n
RI
(5)Table 2. Random Index (Saaty 1980)
n RI n RI 4 0.88 10 1.48 5 1.11 11 1.51 6 1.25 12 1.53 7 1.34 13 1.56 8 1.40 14 1.57 9 1.45 15 1.58
If the CR value is under or equal to the 0,1, evaluation can be accepted as consistent and if this value is over the 0,1 consistency is not ok and evaluation should be repeated again.
3.2. The TOPSIS Method
TOPSIS (technique for order preference by similarity to an ideal solution) is one of the multiple criteria decision-making methods. It was presented by Hwang and Yoon in 1981 and was revised by Chen and Hwang in 1992. The main idea of this methodology is that the selected option should have the shortest geometric distance from the ideal solution and farthest geometric distance from the negative ideal solution. This method is based on comparing a set of decision options by calculated weights of each selection criteria, normalizing scores for each factor that can affect the results, and determining the distance from the ideal and negative ideal solutions, that is the best score in each factor concerning with the selection process. The TOPSIS methods consist of the seven steps as shown in below:
(Step-1). Determining all selection criteria and decision options that can affect the result of the selection process: in this step, open-ended questions that related to issues can be directed to the decision makers who are the member of the board of experts. Actually, organized meetings that realized in the way of a brainstorm with them can be evaluated as the best way to obtain the selection criteria and decision options which available in the real world.
39
(Step-2). In the second step, a decision matrix is constructed based on the opinions of the board of experts for each selection criteria. While the rows of the decision matrix are shown all decision alternatives, the columns of the decision matrix are allocated for the selection criteria. An element of the decision matrix describes the score of ith options with
respect to jth selection criterion.
11 12 1 21 22 2 1 2
...
...
.
.
.
.
.
n n m m mns
s
s
s
s
s
S
s
s
s
(6)(Step-3). In the third step, the normalization procedure is realized for each element of the decision matrix and normalized decision matrix is obtained by using the equation 7.
2 1 ij ij m kj k s r s
(7)The normalized value of each element of the decision matrix is symbolized with rij. The normalized value of each
element of the decision matrix is symbolized with rij. Initially, square of each element of the decision matrix is calculated
and the total value of each column is obtained. After that, it is required to take the square root of these values and each element of the decision matrix is divided into these values at the end of this stage in order to construct the normalized matrix. After these calculations, the normalized matrix can be shown as seen below:
11 12 1 21 22 2 1 2 ... ... . . . . . . ... n n m m mn r r r r r r R r r r (8)
(Step-4). In this step, the values of the weight of the selection criteria are determined by using the AHP method. Pairwise comparison questions are prepared to determine these values and they are directed to the decision makers. Finally, the geometric mean of the importance scores of selection criteria that given by the decision makers for each comparison is calculated and the decision matrix is constructed. The arithmetic mean of each row shows the weight value of selection criteria as well as the importance levels. At the end of this phase, whether these values are utilizable for an evaluation of the selection process is evaluated by using the consistency analysis method. It has to be taken into consideration that the sum of the weight value of selection criteria should be equaled to the 1.
(Step-5). At the 5th stage, the weight value of selection criteria is multiplied with each element of the normalized matrix and the weighted normalized matrix is constructed by using the equation 9.
. ij ij ij v w r (9) 1 11 2 12 1 1 21 2 22 2 1 1 2 2 ... ... . . . . . . ... n n n n m m n mn w r w r w r w r w r w r V w r w r w r (10)
(Step-6). The ideal and negative ideal solution is determined at this stage. While the ideal solutions show the best options, the negative ideal solutions symbolize the worst options. If the taking of the maximum value is our expectation for any options, the maximum value of the column of the weighted normalized matrix can be defined as the ideal solution. On the contrary, if the expectation is to get the minimum value for any selection alternative, the minimum value of each column of the matrix shows the negative ideal solution.
* ' (max ij ), (mini ij i A v jJ v jJ (11)
* * * * 1, 2 ,...n A v v v40
As shown above, the values of the ideal solution are the maximum values of each column. The values of the negative ideal solution are the minimum values of each column as shown below:
'
(min ij ), (max ij i i A v jJ v jJ (12)
1, 2 ,... n
A v v v(Step-7). In this step, while the distance of each option from ideal and negative ideal solutions is calculated, the n dimensional Euclidean distance is used. It can be calculated by using the equations 13 and 14, respectively. The geometric distance of each option from ideal solution is given as:
* * 2 1 ( ) n i ij j j S v v
(13) 2 1 ( ) n i ij j j S v v
(14)It should be taken into consideration that the numbers of S*i and S-i should be equal to the number of decision options.
(Step-8). The relative closeness of an option to the ideal solution is computed as follows:
* * i i i i S C S S (15)
While the closeness of an option to the ideal solution is calculated, the relative geometric distance of each option from ideal and negative ideal solution is taken into consideration. 𝐶𝑖∗ symbolizes the closeness to the ideal solution and
it should take a value between 0 and 1.
If this value is 1 or near to the 1, decision option is close to the ideal solution. On the contrary, if it is closer to 0, it can be considered that it is far from the ideal solution and is closer to the negative ideal solution. Finally, it can be said that the option with the highest relative closeness is the best alternative.
4. Numerical Illustration for Container Port Selection
This paper discusses the container port selection problem in the field of logistics and supply chain. The main aim of this research is to determine the best container port that can be selected by maritime shippers and companies. In the fact, the selection of the container port is an extremely difficult process and any mistake can lead to happen problems for these companies seriously. At the same time, many of the existing selection criteria and decision options are also led to increasing the complexity of the marine container port selection process. As a result, it can be seen that the selection of a container port is a multi-criteria decision-making problem and this problem should be solved by using any multi-criteria decision-making problem method. Therefore, a hybrid model that integrated the AHP and TOPSIS methods is selected to solve the container port selection problem.
Initially, a working group was created and it included the experts, researchers, and operators who are related to this field. This group that consisted of seven members was defined as a board of experts. A large number of roundtable meetings that realized in the way of brainstorm were organized. Answers were searched to the questions such as what are the selection criteria and decision alternatives that taken into consideration by decision-makers exist in the mobile crane selection process. At the end of these meetings, fifteen selection criteria and eight decision options were determined.
At the next stage, pairwise comparison questions related to determined selection criteria were prepared and directed to the decision makers. At the same time, values of decision options for each selection criteria were obtained with the fieldwork and the help of the experts and decision makers. At the end of this stage, the hierarchical model which shown the aim, selection criteria and decision options for mobile crane selection were constructed and it is shown in figure-2.
41
Figure 2. A Hierarchical Model for Container Port Selection
Both selection criteria and decision options are shown in Table-4. While the columns show the selection criteria, rows show the decision options. Both of them are aggregately shown in the decision matrix. Elements of the matrix were determined according to pairwise comparison questions and data that obtained from fieldworks.
In totally 30 decision makers were selected to direct these pairwise comparison questions. According to the board of experts, being an owner of a marine container operations company or being a senior executive in this kind of firm is an important criterion in order to select as an expert. The second important criterion is to have a key role in the container port selection process.
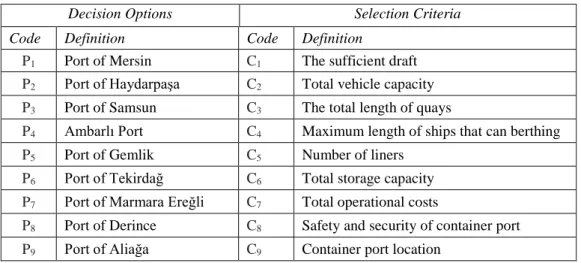
Table 3. Selection Criteria and Decision Alternatives for Container Port Selection
Decision Options Selection Criteria Code Definition Code Definition
P1 Port of Mersin C1 The sufficient draft
P2 Port of Haydarpaşa C2 Total vehicle capacity
P3 Port of Samsun C3 The total length of quays
P4 Ambarlı Port C4 Maximum length of ships that can berthing
P5 Port of Gemlik C5 Number of liners
P6 Port of Tekirdağ C6 Total storage capacity
P7 Port of Marmara Ereğli C7 Total operational costs
P8 Port of Derince C8 Safety and security of container port
P9 Port of Aliağa C9 Container port location
All data and information were collected from official reports and documents, which were published by international and local maritime institutions as well as seaport authorities. In addition to that, for data, which are non-numeric and depend on verbal judgments of decision makers, pairwise comparison questions were prepared and were directed the decision makers. Finally, obtained results were converted to the numerical values and they have included to the scope of this study. After the pairwise comparison questions are directed to the decision makers, the values of elements of the decision matrix can be determined by calculating the geometric mean of the scores that given to each comparison as shown below:
42 1.00 2.07 2.26 1.55 0.91 0.71 0.48 1.00 0.46 0.56 2.56 1.6 0.44 2.19 1.00 0.83 0.64 0.65 1.79 1.21 1.00 0.46 1.10 0.39 1.56 2.19 1.00 1.41 0.60 2.16 2.86 2.70 1.68 1.04 0.92 2.77 1.68 1.11 .067 1.36 3.11 1.93 2.35 2.00 2.14 2.63 2.73 A 0.60 0.90 0.43 7 0.96 1.49 0.50 0.46 1.09 0.73 0.47 0.35 0.36 0.32 0.38 0.37 0.59 0.52 0.37 1.00 0.54 0.65 0.47 1.85 1.00 0.63 0.66 1.54 1.60 1.00 10.22 11.76 13.07 17.48 0.54 2.12 1.51 1.86 1 1.00
4.62 10.07 8.25 8.10 4.81The normalized decision matrix (C), generated using the elements of the decision matrix (A), is obtained by using equations 2. All elements of the matrix A divided by the sum of their column and normalized matrix can be constructed as shown below: 0.0979 0.1760 0.1730 0.0885 0.0624 0.0705 0.0723 0.1110 0.0884 0.0473 0.0850 0.0349 0.0319 0.1751 0.1662 0.1161 0.1837 0.1042 0.0433 0.1865 0.0765 0.0473 0.0439 C 0.0459 0.1324 0.0906 0.0970 0.0633 0.1526 0.0925 0.0572 0.0313 0.0348 0.0437 0.0397 0.0791 0.1073 0.0332 0.1193 0.1251 0.0684 0.0368 0.0720 0.0639 0.0761 0.1380 0.0508 0.1654 0.1633 0.1847 0.0993 0.0656 0.0802 0.0982 0.1640 0.0888 0.0700 0.1584 0.1152 0.1833 0.1212 0.0774 0.1374 0.1089 0.0572 0.1043 0.1779 0.1321 0.1530 0.1933 0.1235 0.1117 0.2302 0.1698 0.1640 0.1504 0.1869 0.2102 0.1834 0.2299 0.2 1.00 1.00 1.00 1.00 1.00 1.00 079
1.00 1.00 1.00After the normalization operation, w vector that called as the Eugen vector has been constructed by calculating the arithmetic mean of each row of the matrix C. At the same time, w vector shows also the percentage value of the relative importance level of each selection criterion.
1 2 3 4 5 6 7 8 9 0.1044 0.1049 0.0848 0.0660 0.0780 0.1162 0.1240 0.1291 0.1925 C C C C w C C C C C
As is also understood from the W vector that shown in the above, the selection criterion that determined as Location of Port (C9) has taken the highest score as 19.25% and while it is the most important selection criterion. The second important criterion is Safety & Security (C8), in addition to that, the selection criterion which defined as Total Operational Costs (C3) that applied by port authorities is the third important criterion.
In order to determine whether judgments of decision-makers consistent and they are proper to the real life, it is necessary to realize a consistency analysis according to the AHP method. Initially, the first step of consistency analysis is to construct the E vector. In order to obtain the E vector, elements of each row of the decision matrix A is multiplied by elements of the eigenvector w and the obtained value divided into the element value of the row of the w vector.
43 9.9672 9.8372 9.8963 10.0001 9.7946 9.9034 9.8650 9.8191 9.81 88 71 .90 E
1 88.90 9.8778 9 n i i mak E n
9.8778 9 0.1097 1 9 1 mak n CI n
0.1097 0.071 1.54 CI CR RI As shown above, the value of consistency ratio was calculated as 0.039 and evaluation can be accepted as consistent because this value is under 0.10 and it can pass to the next step. In the third step, decision matrix is constructed according to the TOPSIS method. While all rows represent the decision options, the columns of the decision matrix show selection criteria. 1 2 3 4 5 6 7 8 9 1 2 3 4 5 6 7 8 9 15,8 2.600.000 3370 400, 0 46 35, 0 120 3 0, 0837 12, 0 655.000 3413 150, 0 2 42, 6 120 2 0,1515 12, 0 250.000 1756 184,5 3 32 ,5 9 5 2 0, C C C C C C C C C P P P P S P P P P P 0690 16,5 2.100.000 3075 294, 0 33 31, 2 245 3 0, 2078 12,5 600.000 1051 450, 0 32 70, 0 114 1 0,1185 18, 0 2.500.000 2010 275, 0 15 30, 0 120 1 0, 0721 20, 0 200.000 1498 185, 0 7 10, 0 100 1 0, 0782 15, 0 2.500.000 1360 450, 0 2 45, 0 100 1 0,1418 10, 0 450.000 820 410, 0 5 8, 2 95 1 0, 0773 131,8 11855000 18353 2798,5 145 304,5 1109 15 1
After that, normalization operation was realized to construct the normalized matrix by using the equation 7. and the matrix C was constructed as shown as shown below:
1 2 3 4 5 6 7 8 9 1 2 3 4 5 6 7 8 9 0, 352 0, 522 0, 500 0, 403 0, 682 0, 306 0, 306 0, 539 0, 233 0, 267 0,132 0, 506 0,151 0, 030 0, 373 0, 306 0, 359 0, 421 0, 267 0, 05 0 0, 260 0,18 C C C C C C C C C P P P P R P P P P P 6 0, 044 0, 284 0, 242 0, 359 0,192 0, 368 0, 422 0, 456 0, 296 0, 489 0, 273 0, 624 0, 539 0, 578 0, 278 0,121 0,156 0, 453 0, 475 0, 612 0, 290 0,180 0, 330 0, 401 0, 502 0, 298 0, 277 0, 222 0, 262 0, 306 0,180 0, 200 0, 446 0, 040 0, 222 0,186 0,104 0, 087 0, 255 0,180 0, 218 0, 334 0, 502 0, 202 0, 453 0, 030 0, 394 0, 255 0,180 0, 394 0, 223 0, 090 0,122 0, 413 0, 074 0, 072 0, 242 0,180 0, 215
In the next step, in order to determine the weight value of the selection criteria AHP method was used and prepared pairwise comparison questions were directed to the decision makers who play an important role in the mobile crane selection process. Given answers to these questions by decision makers provide a basis to determine the weight value of
44
the selection criteria. These values can be computed by using the equation 2 and other steps of the AHP method. After constructing the decision matrix, normalization operation is realized with Eqs. 2. Finally, the arithmetic mean of each row of the normalized matrix is given the weight values of each selection criteria (w).
C1 C2 C3 C4 C5 C6 C7 C8 C9
0,104 0,105 0,085 0,066 0,078 0,116 0,124 0,129 0,193
max max max max max max min max max
If expectation of the decision makers is the minimum value for a selection criterion, the minimum value of each column shows the ideal solution and maximum value of these columns show the negative ideal solution. If they expect the maximum value for a criterion, maximum value of each column represents the ideal solution and minimum value of these columns represent the negative ideal solution. The weighted normalized matrix can be constructed by using equation 9. The values of the columns of the normalized matrix are multiplied by weight values of each column.
1 2 3 4 5 6 7 8 9 1 2 3 4 5 6 7 8 9 0, 0367609 0, 0548194 0, 0424072 0, 0265957 0, 053 C C C C C C C C C P P P P V P P P P P 2246 0, 0355791 0, 0378705 0, 0695705 0, 0448193 0, 0279197 0, 0138103 0, 0429483 0, 0099734 0, 0023141 0, 0433048 0, 0378705 0, 0463803 0, 0691545 0, 0279197 0, 0052711 0, 0220971 0, 0122673 0, 0034712 0, 0330377 0, 0299808 0, 0463803 0, 0691545 0, 0383896 0, 0442772 0, 0386950 0, 0195479 0, 0381829 0, 0317162 0, 0773189 0, 0695705 0,1037317 0, 0290830 0, 0126506 0, 0132255 0, 0299202 0, 0370258 0, 0711581 0, 0359770 0, 0231902 0, 0345772 0, 0418796 0, 0527109 0, 0252933 0, 0182846 0, 0173559 0, 0304963 0, 0378705 0, 0231902 0, 0345772 0, 0465328 0, 0042169 0, 0188505 0, 0123005 0, 0080994 0, 0101654 0, 0315587 0, 0231902 0, 0345772 0, 0348996 0, 0527109 0, 0171139 0, 0299202 0, 0023141 0, 0457445 0, 0315587 0, 0231902 0, 0345772 0, 0232664 0, 0094880 0, 0103187 0, 0272606 0, 0057853 0, 0083357 0, 0299808 0, 0231902 0, 0345772
For each decision alternative, computed relative closeness values that calculated by using Eqs 14 and 15 can be shown as below: 1 2 3 4 5 6 7 8 9 0, 04653 0, 05482 0, 04295 0, 02992 0, 05322 0 , 07116 0, 0 C C C C C C C C C İdeal Solution İdeal Solution 2998 0, 06957 0,10373 0, 02327 0, 00422 0, 01032 0, 00997 0, 00231 0, 00834 0, 07732 0, 02319 0, 03458
By using equation 15, the values of C*
i were calculated for each decision alternative and the decision option that has
the maximum value is defined as the best decision option.
1 2 3 4 5 6 7 8 9 0, 6017 2 0, 4641 3 0, 4180 6 0, 6198 1 0, 4595 4 0, 4156 7 0, 2922 8 0, 4334 5 0, 2815 9 Score Rank P P P P P P P P P
In the end, relative importance values of options were calculated and it can be seen that the best selection option is the Ambarli Port. It has been taken the maximum importance score and it was recorded as 0.6198. According to importance value, other options can be ranked as Ambarli Port>Port of Mersin>Port of Haydarpaşa>Port of Gemlik>Port of Derince>Port of Samsun>Port of Tekirdag>Port of M. Eregli>Port of Aliağa.
5. Findings and Conclusion
It can be seen that optimal container port selection to perform the more effective and productive marine container operations involves some difficulties. Initially, there is no tolerance to make the mistake when a decision maker will evaluate the marine container port selection factors to choice a container port. It can be seen that container port selection
45
is a multi-criteria decision-making problem. Therefore, in this paper, optimal solution way is trying to show in order to solve the decision-making problem relating to the container port selection process.
A hybrid model that integrated the AHP and the TOPSIS methods that are the multi-criteria decision-making methodologies were selected and determined selection criteria and decision options were evaluated in the light of this method. There are few studies about a container port selection process by using a hybrid multi-criteria decision-making methods. In addition to that, there are several studies that related to marine port in the framework of any methodology.
When the obtained results of this study are evaluated, it can clearly be seen that the most important selection criterion is the port location. The decision makers attach a great importance to this criterion compared to the other selection criteria because the location of the port can be determinative to carry out successful logistics operations, more importantly, customers always want to reach a container port easily and quickly. The selection criterion can be ranked in accordance with their importance values: port location> port safety >total operational costs>total storage area>total vehicle capacity>the sufficient draft>total length of quays>number of liners>Maximum length of ships that can berthing.
It can be said that the best selection alternative is the Port of Ambarli in the light of this information about container port selection criteria. It is the nearest container port to commercial, industrial, and trading centers compared to other alternatives in addition to that its safety level (ISPS III) is higher than the others. On the other hand, charges and operational costs are a little high compared to the other decision alternatives.
This study can seriously contribute the scientific researches and literature in the field of logistics and decision-making problems. In the near future, it can be utilized as a systematic methodology concerning with container port selection process and may be developed to select an optimal container port. More importantly, it can be used for other port types such as dry bulk ports, liquid Cargo ports, and Ro-Ro ports and so on.
46
REFERENCES
Slack, Brian. 1985. “Containerization: Inter-Port Competition and Port Selection”. Maritime Policy and Management, 12, 4.: 293-303.
Hayuth, Yehuda. 1980. “Container Traffic in Ocean Shipping Policy,” in: International Conference on Ports for Europe, Brugge.
Jansson, Jan. O., Shneers, Daniel. 1987. Liner Shipping Economics. Chapman and Hall Ltd, New York.
James, Bicheno Francis, Gail, Saltz. 1988 “The Perception of Route Competition Via Seaports in The European Communities.” Maritime Policy and Management, 15: 35-55.
Thomson, Brian. 1998. “Structure Changes in The Maritime Industry’s Impact on the Inter-Port Competition in Container Trade.” International conference on shipping development and port management.
Sternberg, Richard W. 2000. “The Successful Factors of an Ocean Transshipment Center, the Case Study of One Italian Port,” The Journal of Chinese Ports, 29, 2.: 13-18.
Malchow, Matthew Brian, Kanafani, Adib. 2004. “A Disaggregate Analysis of Port Selection,” Transportation Research
Part E, 40: 317-337.
Murphy, Paul R., Daley, James, M., Dalenberg, Douglas R. 1992. “Port Selection Criteria: An Application of a Transport Research Framework.” Logistics and Transportation Review, 28: 237-255.
Lirn, Tae. C., Thanopoulou, H. A., Beresford, Anthony K. C. 2003. “Transshipment Port Selection and Decision-Making Behaviour: Analyzing the Taiwanese Case.” International Journal of Logistics - Research and Applications, 6: 229-244.
Lirn, T. C., Thanopoutou, H.A., Beynon, M. J., Beresford, A.K.C. 2004. An Application of AHP on Transshipment Port Selection: A Global Perspective. Maritime Economics and Logistics, 6: 70-91.
Ha, Myung-Shin. 2003. “A Comparison of Service Quality at Major Container Ports: Implications for Korean Ports.”
Journal of Transport Geography, 112: 131-137.
Chou, Chien-Chang. 2007. “A Fuzzy MCDM Method for Solving Marine Transshipment Container Port Selection Problems.” Applied Mathematics and Computation, 186, 1: 435-444.
Yeo, Gi-Tae., Ng, Adolf K.Y., Lee, Tae-Woo and Yang, Zaili. 2014. “Modelling Port Choice in an Uncertain Environment.” Maritime Policy & Management, 41, 3: 251-267.
Tongzon, Jose. L. 2009. “Port Choice and Freight Forwarders.” Transportation Research Part E-Logistics and
Transportation Review, 45, 1: 186-195.
Ernst, Fred. G. 2001. “Economics of Transportation in Container Shipping Logistics,” in: International Conference on Port and Maritime R&D and Technology, Singapore.
Bird, James. 1988. “Freight Forwarders Speak: The Perception of Route Competition via Seaports in The European Communities Research Project.” Maritime Policy and Management, 15, 1: 12-27.
Willingale, Michael, C. 1984. “Ship-Operator Port-Routing Behavior and the Development Process.” In: Hoyle, B.S. and Hilling, D. eds. Seaport Systems and Spatial Change. John Wiley & Sons: New York, 43-59.
Murphy, Paul R., Daley, James M., Dalenberg. 1991. “Selecting Links and Nodes İn İnternational Transportation: An Intermediary’s Perspective.” Transportation Journal, 31: 33-40.
Saleh, Al-Dhahri, LaLonde, Bernard J. 1972. “Industrial Buying Behavior and The Motor Carrier Selection Decision.”
Journal of Purchasing, 8: 18-33.
Brooks, Mary R. 2004. “The Governance Structure of Ports.” Review of Network Economics, 3, 2: 168-183.
D’Este, Glen, Meyrick, Samuel. 1992. “Carrier Selection in A RO/RO Ferry Trade Part 1. Decision Factors and Attitudes.” Maritime Policy and Management, 19, 2: 115–126.
D’Este, Glen. 1992. “Carrier Selection in A Ro/Ro Ferry Trade Part 2: Conceptual Framework for The Decision Process.”
Maritime Policy and Management, 19, 2: 127–138.
McGinnis, Michael. 1979. “Shipper Attitudes Towards Freight Transport Choice. A Factor Analytic Study.” International
Journal of Physical Distribution and Materials, Management, 10: 25–34.
Ogden, Kenneth W., Rattray, Anna. 1982. “Analysis of Freight Mode Choice”. In: Proceedings of the 7th Australian Transport Research Forum, Hobart, Australia: 249–276.
Gilmour, Peter. 1976. “Some Policy Implications of Subjective Factors in the Modal Choice for Freight Movements.”
The Logistics and Transportation Review, 12: 39–57.
Wilson, Fred R., Bisson, Brain J., Kobia, Klein B. 1986. “Factors that Determine Mode Choice in The Transportation of General Freight” Transportation Research Record, 1061: 26–31.
Cook, William R. 1967. “Transportation Decisions of Certain Firms İn The Black Country.” Journal of Transport
Economics and Policy, 1: 325–344.
Bayliss, Eddie J., Edwards, Samuel L. 1970. Industrial Demand for Transport. Ministry of Transport: London.
Chang, T.S. 2008. “Best Routes Selection in İnternational Intermodal Networks.” Computers & Operations Research, 35, 9: 2877-2891.
Rimmer, Peter J. 1998. “Ocean Liner Shipping Services: Corporate Restructuring and Port Selection/Competition.” Asia
Pacific Viewpoint, 39, 2: 193-208.
Heaver, Trevor, Meersman, Hilda, Voorde Eddy Van D. 2001. “Co-Operation and Competition in International Container Transport: Strategies for Ports.” Maritime Policy & Management, 28, 3: 293-305.
47
Nir, An-Shuen, Lin, Kuang, Liang, Gin-Shuh. 2003. “Port Choice Behavior – From The Perspective of the Shipper.”
Maritime Policy and Management, 30, 2: 165–173.
Tiwari, Piyush, Itoh, Hidekazu, Doi, Masayuki. 2003. “Shippers’ Containerized Cargo Transportation Behavior in China: A Discrete Choice Analysis.” Journal of Transportation Economics and Statistics, 6 1: 71–87.
Barysienė Jurgita. 2012. “A Multi-Criteria Evaluation of Container Terminal Technologies Applying the Copras-G Method.” Transport, 274: 364–372.
Ergin, Ayfer, Eker, İpek, Alkan, Güler. 2015. “Selection of Container Port Using ELECTRE Technique.” International Journal of Operations and Logistics Management, 4, 4: 268-275.
Sayareh, Jafar., Alizmini, Hamed Rezaee. 2014. Hybrid Decision-Making Model for Selecting Container Seaport in the Persian Gulf.” The Asian Journal of Shipping and Logistics, 30, 1: 75-95.