i
CHARACTERIZATION OF CHEMOSENSITIVITY
PROFILES OF BREAST CANCER CELL LINES, WITH
AND WITHOUT STEM CELL LIKE FEATURES
A THESIS
SUBMITTED TO THE DEPARTMENT OF MOLECULAR
BIOLOGY AND GENETICS AND THE GRADUATE SCHOOL
OF ENGINEERING AND SCIENCE OF BILKENT UNIVERSITY
IN PARTIAL FULFILLMENT OF THE REQUIREMENTS FOR
THE DEGREE OF MASTER OF SCIENCE
BY
MUHAMMAD WAQAS AKBAR
August, 2014
ii
I certify that I have read this thesis and that in my opinion it is fully adequate, in scope
and in quality, as a thesis for the degree of Master of Science.
Assist. Prof. Dr. Ali Osmay GÜRE
(Advisor)
I certify that I have read this thesis and that in my opinion it is fully adequate, in scope
and in quality, as a thesis for the degree of Master of Science.
Assoc. Prof. Dr. Burçak VURAL
I certify that I have read this thesis and that in my opinion it is fully adequate, in scope
and in quality, as a thesis for the degree of Master of Science.
Assist. Prof. Dr. Özgür ŞAHIN
Approved for the Graduate School of Engineering and Science
Prof. Dr. Levent ONURAL
Director of the Graduate School
iii
ABSTRACT
CHARACTERIZATION OF CHEMOSENSITIVITY PROFILES OF BREAST CANCER
CELL LINES, WITH AND WITHOUT STEM CELL LIKE FEATURES
Muhammad Waqas Akbar
Supervisor: Assist. Prof. Dr. Ali Osmay GÜRE
August, 2014
Breast cancer is the second most common cause of death worldwide from cancer due to
complications with its diagnosis and resistance to therapy. Recent studies have shown that
breast tumors when compared with other solid tumors also contain a subpopulation termed as
cancer stem cells (CSCs). CSCs are hard to kill due to their therapy resistant capacities. These
unharmed cells then result into relapse of tumor after treatment. Some established breast
cancer cell lines also behave in similar fashion to CSCs in overall manner thus termed as CSC
like cell lines. This study primarily focuses on characterizing CSC like cell lines from non CSC
like cell lines based upon their gene expression and prediction of drugs which can target these
groups separately. In this study two databases, Cancer Cell Line Encyclopedia (CCLE) and
Cancer Genome Project (CGP), were used which contain gene expression data and drugs
cytotoxicity data for most of the established cancer cell lines. Breast cancer cell lines gene
expression data was used to predict two gene lists which can separate breast cancer cell lines
into CSC like and non CSC like cell lines by in silico analysis. These gene lists were named as
Patentable and Non Patentable. Additionally four drugs were predicted which can target CSC
like group (Midostaurin and Elesclomol) and non CSC like group (Panobinostat and Lapatinib)
separately. Later these findings were validated in vitro. Non Patentable gene list could not be
validated due to low concordance with microarray data. On the other hand, Patentable gene list
was validated and was found concordant with microarray data. Out of four selected drugs,
Panobinostat and Lapatinib showed increased toxicity to non CSC like cell lines while only
Midostaurin showed toxicity to CSC like cell lines. To investigate further that cell lines were
grown in 3D cell culture conditions, to increase their stem cell like properties (stemness). But
only one cell line MDA-MB-157 which was found as CSC like, showed expected behavior.
Additionally this cell line increased resistance to Lapatinib and Panobinostat and became more
sensitive to Midostaurin. Correlation analysis showed some genes as potential biomarkers for
selected drugs. In conclusion, in this study various genes are proposed to differentiate CSC like
iv
cell lines from non CSC like cell lines. And Midostaurin can be potential drug to treat CSC like
cells while Lapatinib and Panobinostat showed increased activity against non CSC like cell
lines.
Keywords: Breast cancer, Cancer stem cells, Midostaurin, Elesclomol, Lapatinib, Panobinostat,
3D cell culture, mammosphere, CCLE, CGP, qPCR.
v
ÖZET
KÖK-HÜCRE ÖZELLIĞI OLAN VE OLMAYAN MEME KANSERI HÜCRE
HATLARININ ILAÇ HASSASIYET PROFILLERININ TANIMLANMASI
Muhammad Waqas Akbar
Danışman: Assist. Prof. Dr. Ali Osmay GÜRE
Ağustos, 2014
Meme kanseri, teşhisindeki zorluk ve tedaviye direncinden dolayı dünyada en ölümcül ikinci
kanserdir. Literatürdeki son çalışmalar göstermiştir ki meme tümörleri diğer katı tümörler gibi
kanser kök hücresi (KKH) olarak adlandırılan bir sup-grup içermektedir. KKH`lerinin kanser
tedavilerine dirençli yapılarından dolayı öldürülmesi güçtür. İlacın etki etmediği bu grup hücreler
tedavi sonrası tümörün nüksetmesine neden olmaktadır. Bilinen bazı meme kanseri hücre
hatları ise genel olarak KKH gibi davranmakta ve kanser kök hücresi-benzeri hücre hatları
olarak adlandırılmaktadırlar. Bu çalışmada temel olarak KKH benzeri ve KKH benzeri olmayan
hücre hatlarını, gen ifadesi ve bu iki gruba ayrı ayrı etki eden ilaçlara verdikleri cevaplara
dayanarak karakterize etmeyi amaçladık. Bilinen hücre hatlarının çoğunun gen ifade ve ilaçlara
hassasiyet bilgisini içeren iki veritabanı kullandık, Kanser Hücre Hatları Ansiklopedisi (Cancer
Cell Line Encyclopedia, CCLE) and Kanser Genom Projesi (Cancer Genome Project, CGP).
Meme kanseri hücre hatlarının gen ifade bilgisi, bu hücre hatlarını KKH benzeri ve KKH benzeri
olmayan gruplara ayırabilen 2 farklı gen listesini in siliko analizler sonucunda elde etmek için
kullanılmıştır. Bu gen listelerini Patentlenebilen ve Patentlenemeyen listeler olarak adlandırdık.
Buna ek olarak KKH benzeri hücrelere ve KKH benzeri olmayan hücrelere ayrı ayrı etki
edebilecek ikişer ilaç (sırasıyla, Midostaurin, Elesklomol, Panobinostat ve Lapatinib) belirledik.
Daha sonra bu bulguları in vitro çalışmalarla doğruladık. Patentlenemeyen gen listesini
mikroarray bilgisi ile uyumlu olmamasından dolayı doğrulayamadık. Öte yandan,
Patentlenebilen gen ifadesi mikroarray verisiyle uyumlu sonuç verdi. Aynı zamanda iki grup
arasında istatistiksel olarak anlamlı ifade farkı elde ettik. Seçilen 4 ilaçtan, Panobinostat ve
Lapatinib KKH benzeri olmayan hücre hatlarına daha etkili iken, Midostaurin KKH benzeri hücre
hatlarında yüksek toksisite gösterdi. Daha derin araştırmak için hücre hatlarını kök hücre
özelliklerini arttırmak amacıyla 3 boyutlu kültürde büyüttük. Ancak KKH benzeri olarak belirlenen
hucre hatlarından sadece MDA-MB-157 hücre hattı beklenen sonucu verdi. Buna ek olarak, bu
hücre hattı Lapatinib ve Panobinostat ilaçlarına karşı direnç artışı gösterirken, Midostaurin
vi
ilacına karşı daha hassas hale geldi. Korelasyon analizleri gösterdi ki bazı genler seçilen ilaçlar
için potansiyel biyobelirteç görevi görebilir. Sonuç olarak, bu çalışmada KKH benzeri hücre
hatlarını KKH benzeri olmayan hücre hatlarından ayırabilecek çeşitli genler önerilmiştir. Uzun
vadede Midostaurin KKH benzeri hücreleri; Lapatinib ve Panobinostat KKH benzeri olmayan
hücreleri hedefleyen potansiyel ilaç olabilir.
Anahtar kelimeler: Meme kanseri, Kanser kök hücreleri, Midostaurin, Elesklomol,Lapatinib,
Panobinostat, 3B hücre kültürü, mammosphere, CCLE, CGP, qPCR.
vii
viii
ACKNOWLEDGMENTS
I have great pleasure to express deepest gratitude to my caring and helpful supervisor Assist. Prof. Dr. Ali Osmay Güre. I am very grateful to him for his valuable guidance, keen interest, persistent guidance and ever willing support throughout the course of this project. His ever optimistic and evocative views for completion of this project in time have made possible a living dream. He always encouraged me to look in broader perspective. I learned a lot under his supervision. It is a privilege for me to be a part of his lab. Secondly I owe my profound regards to Assoc. Prof. Dr. Burçak Vural and Assist. Prof. Dr. Özgür Şahin for their valuable counsel and insights for the preparation of this thesis and project future plans.
I cannot thank enough my lab member; Murat İşbilen for his valuable contributions to this project and for his support and motivation which made my stay a lot easier in Turkey. He is my true kind, caring and loyal brother.
I would like to extend heartiest thanks to all members of AOG Lab, Mehdi Ghassemi, Kerem Mert Şenses, Sinem Yilmaz, Şükrü Atakan, Seçil Demirkol, Barış Küçükkaraduman and Alper Poyraz. They were real support and caring. Especially Kerem, Secil and Mehdi guided me a lot with their experiences and they were always there when I needed them the most. Presence of Alper and Barış in lab made every moment memorable.
I am sincerely thankful to Umar Raza who encouraged and supported me at every turn of events. He made my stay in Bilkent quite peaceful. I would also like to thank Huma Shehwana, Gurbet Karahan, Nilufer Sayar, Emre Yurdusev and Erol Eyüpoğlu for their help and support.
I also thank Asad Ali, Ali Haider, Naveed Mehmood and Naveed-ul-Mustafa from the core of my heart. I cannot forget the moments we spent together “while killing waves”.
Last but not least, I admit that I owe all my achievements to my sincere and most loving parents and my sisters, whose prayers and motivational support always remained a source of determination for me.
ix
TABLE OF CONTENTS
1
Introduction
1.1 Breast Cancer ... 1
1.2 Classification of Breast Cancer ... 1
1.3 Cancer Stem Cells ... 1
1.4 Breast Cancer Stem Cells ... 2
1.5 Markers for Breast Cancer Stem Cells ... 2
1.6 Epithelial - Mesenchymal Transition and Cancer Stem Cells ... 3
1.7 Factors Associated With Induction of Stemness Phenotype ... 3
1.8 Resistance of Cancer Stem Cells to Therapy ... 4
1.9 Cancer Stem Cells in Cell Lines... 5
1.10 Cancer Stem Cell Culturing ... 6
1.11 Cancer Cell Line Encyclopedia and Cancer Genome Project ... 6
1.12 Patentable Gene List and Non Patentable gene lists ... 7
2
Aims of the study
...
8
2.1 Scheme Of the study ... 8
3
Materials ... 9
3.1 General Laboratory Reagents and Equipment ... 9
3.2 General Laboratory Solutions ... 9
3.3 Cell Culture Materials and Reagents ... 9
3.4 Cell Culture Media and Solutions ... 10
4
Methods ... 13
4.1 Cell Culture Techniques ... 13
4.2 Culturing Preserved Cells ... 13
4.3 Culturing Cells in 2D Culture ... 13
4.4 Cryopreservation of Cells ... 13
4.5 Culturing Cells in 3D Culture ... 14
x
4.7 RNA Extraction ... 15
4.8 DNAse Treatment ... 15
4.9 RNA Quantification by Qubit ... 15
4.10 cDNA Synthesis ... 16
4.11 End Point Polymerase Chain Reaction ... 16
4.12 Agarose Gel Electrophoresis ... 16
4.13 Quantitative Real time Polymerase Chain Reaction (qRT-PCR) ... 17
4.14 Cell Counting ... 19
4.15 Drug Cytotoxicity ... 19
4.16 Calculation of Cytotoxicity Parameters ... 20
4.17 Software Programs Used in this Study ... 23
4.18 GraphPad Prism 6.0 ... 23
4.19 Principle Component Analysis ... 23
5
Results ... 24
5.1 In Silico Results ... 24
5.1.1 Determination of Gene lists differentiating CSC and Non CSC like breast cancer cell lines 24 5.1.2 Validation of Gene Lists ... 29
5.1.3 Molecular Subtyping of Breast Cancer Cell Lines ... 32
5.1.4 Prediction of Drug Response ... 33
5.2 In vitro validation ... 37
5.2.1 Validation in 2D cell culture conditions... 38
5.2.2 Validation in 3D cell culture conditions... 55
5.3 Correlation between Gene expression and cytotoxicity data ... 63
5.4 Principle Component Analysis ... 64
5.5 Concordance of Microarray Data with SybrGreen and TaqMan qPCR Data ... 68
5.6 Conclusion ... Error! Bookmark not defined.
6
Discussion & Future Perspectives ... 73
xi
6.2 Patentable Gene List ... 74
6.3 Drugs selected for CSC like and non CSC like cell lines ... 75
6.4 Correlation Analysis ... 77
6.5 Concordance of Microarray Data with qPCR Validation Data ... 77
6.6 Future Perspectives ... Error! Bookmark not defined.
7
References ... 78
8
Appendix ... 83
8.1 Validation of drug response in 2D cultured cells ... 83
8.2 Comparison of gene expression between 2D and 3D culture conditions of Non Patentable Gene List 90 8.3 Comparison of gene expression between 2D and 3D culture conditions of Non Patentable Gene List 92 8.4 Drug cytotoxicity for 3D cell culture conditions ... 98
xii
LIST OF FIGURES
Figure0.1: Cancer stem cells niche………..2
Figure0.2: Targeting cancer stem cells and non-cancer stem cells………. ………….5
Figure 1.3: Parameters used for determination of drug’s cell cytotoxicity. ………..7
Figure 4.1: Percent Viability curves for HCC1937 treated with Lapatinib………... 22
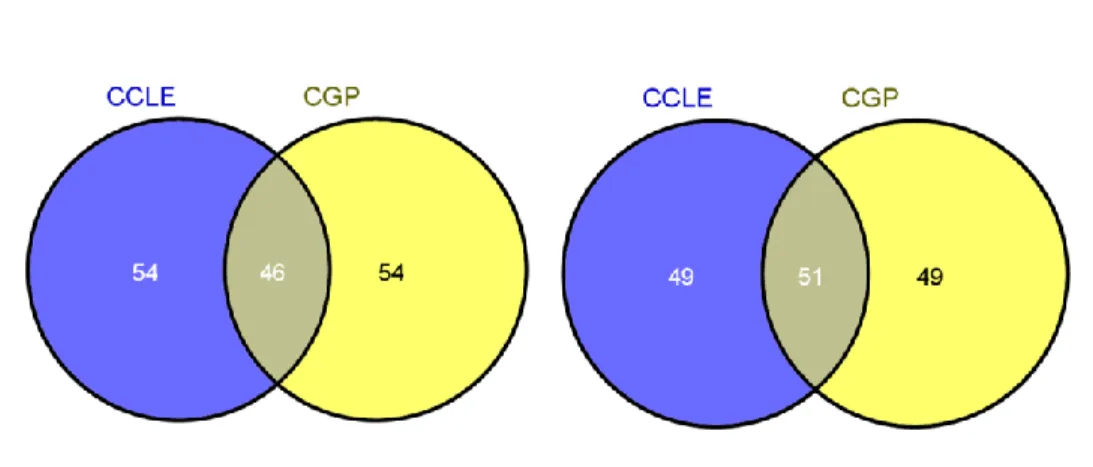
Figure 5.1: Common genes between genes selected from CCLE and CGP datasets………. 25
Figure 5.2: CCLE and CGP Datasets were clustered by using Non-Patentable Gene List. ………….26
Figure 5.3: CCLE and Datasets were clustered by using Patentable Gene List……… 28
Figure 5.4: Validation with Bhat-Nakshatri et al dataset with Non-Patentable Gene List………. 29
Figure 5.5: Validation with Bhat-Nakshatri et al dataset with Patentable Gene List……….. 30
Figure 5.6: Comparison of Elesclomol cytotoxicity against Breast cancer cell lines……….. 34
Figure 5.7: Comparison of Midostaurin cytotoxicity against Breast cancer cell lines………. 35
Figure 5.8: Comparison of Lapatinib cytotoxicity against Breast cancer cell lines………36
Figure 5.9: Comparison of Panobinostat cytotoxicity against Breast cancer cell lines……….37
Figure 5.10: Comparison of expression of PVRL3, FBN1, EMP3 and GNG11 across breast cancer cell lines……….38
Figure 5.11: Comparison of expression of RAB25, SPINT1, CLDN7 and GRHL2 across breast cancer cell lines………..39
Figure 5.12: Correlation of genes of Non Patentable genes with each other………40
Figure 5.13: Comparison of VIM, FN1, E-CAD and CLDN4 between breast cancer cell lines…………..42
Figure 5.14: Comparison of BNC2, DDR2, PVRL3, DKK3, SLIT2 and TMEM158 in breast cancer cell lines……….43
Figure 5.15: Comparison of ST14, BSPRY, IRF6, ZNF165 and AP1M2 in breast cancer cell lines……..45
Figure 5.16: Correlation between 2D and 3D gene expression for Patentable gene list………..46
Figure 5.17: Bar plots showing Comparison of Drug IC50 Midostaurin, Elesclomol, Lapatinib and Panobinostat against CSC like and non CSC like cell lines………50
Figure 5.18: Bar plots showing Comparison of Drug EC50 Midostaurin, Elesclomol, Lapatinib and Panobinostat against CSC like and non CSC like cell lines………51
Figure 5.19: Bar plots showing Comparison of Drug Activity area Midostaurin, Elesclomol, Lapatinib and Panobinostat against CSC like and non CSC like cell lines………52
Figure 5.20: Bar plots showing Comparison of Drug Amax Midostaurin, Elesclomol, Lapatinib and Panobinostat against CSC like and non CSC like cell lines………53
xiii
Figure 5.21: Cumulative drug response of drugs parameters against non CSC like vs. CSC like IC50,
EC50, Activity area and Amax……….54
Figure 5.22: Mammosphere formed by Breast cancer cell lines………56
Figure 5.23: Comparison of VIM, FN1, E-CAD and CLDN4 between breast cancer cell lines………...57-58 Figure 5.24: Comparison of selected genes VIM, FN1, E-CAD and PVRL3, ST14, BSPRY and IRF6 in MDA-MB-157 breast cancer cell line………..59
Figure 5.25: Bar plots showing Comparison of Drug parameters for Midostaurin, Lapatinib and Panobinostat against MDA-MB157 cells cultured in 2D and 3D culture conditions………62
Figure 5.26: Pearson correlation analysis results between gene expression and drug cytotoxicity parameters………..63
Figure 5.27: Correlation of PC1 of AP1M2 and SLIT2 with Elesclomol IC50………..65
Figure 5.28: Correlation of PC1 of ZNF165 with Midostaurin EC50………..66
Figure 5.29: Correlation of PC1 of E-CAD, SLIT2 and TMEM158 with Panobinostat Activity area……….67
Figure 5.30: Correlation of PC1 of PVRL3 and SLIT2 with Panobinostat Amax……….68
Figure 5.31: Analysis for explaining concordance between microarray data and TaqMan qPCR data…..69
Figure 5.32: Analysis for explaining concordance between microarray data and SybrGreen qPCR data...70
Figure 8.1: Percent Cell Viability curves for Panobinostat against breast cancer cell lines………..83
Figure 8.2: Percent Cell Viability curves for Lapatinib against breast cancer cell lines……….85
Figure 8.3: Percent Cell Viability curves for Midostaurin against breast cancer cell lines……… 87
Figure 8.4: Percent Cell Viability curves for Elesclomol against breast cancer cell lines………..89
Figure 8.5: Comparison of PVRL3, FBN1, EMP3 and GNG11 in both 2D and 3D……….91
Figure 8.6: Comparison of RAB25, SPINT1, CLDN7 and GRHL2 in both 2D and 3D cultured cells……..92
Figure 8.7: Comparison of BNC2, DDR2, PVRL3, DKK3, SLIT2 and TMEM158 in breast cancer cell lines in both 2D and 3D………93-95 Figure 8.8: Comparison of ST14, BSPRY, IRF6, ZNF165 and AP1M2 in breast cancer cell lines in both 2D and 3D……….96-98 Figure 8.9: Percent Cell Viability curves for Panobinostat against breast cancer cell lines………..99
Figure 8.10: Percent Cell Viability curves for Lapatinib against breast cancer cell lines……….101
Figure 8.11: Percent Cell Viability curves for Midostaurin against breast cancer cell lines……….103
Figure 8.12: Percent Cell Viability curves for Elesclomol against breast cancer cell lines………..105
Figure 8.13: Comparison of not selected genes CLDN4, BNC2, DDR2, DKK3, SLIT2, TMEM158, IRF6 and AP1M2 in MDA-MB-157 breast cancer cell line………..106
xiv
LIST OF TABLES
Table 0.1: Materials purchased for use in general cell culture procedures and the companies……… 9
Table 3.2: Cell culture medium and reagents………10
Table 3.3: Composition of media for 3D culture………11
Table4.1: Predesigned TaqMan probes……….17
Table 4.2: Sequence and melting temperature of each gene used with SybrGreen assay…………..18-19 Table 4.3: OD values for HCC1937 treated with Lapatinib……….………20
Table 4.4: % viability values for HCC1937 treated with Lapatinib……….…21
Table 4.5: Standard error of model, log (IC50), log (EC50), Activity area and Amax values for HCC1937 treated with Lapatinib………21
Table 5.1: Non-Patentable Gene List……….………...25
Table 5.2: Patentable Gene List. ………..27
Table 5.3: Details of the datasets selected for further validation………...31
Table 5.4: Comparison of selected genes behavior among different datasets (Downregulated in CSC like cells)……….31
Table 5.5: Comparison of selected genes behavior among different datasets (Upregulated in CSC like cells)……….32
Table 5.6: Comparison of Molecular subtypes of breast cancer cell lines with CSC like characterization for both CCLE and CGP datasets……….32
Table 5.7: Selected drugs, their mode of action and molecular subtype of breast cancer cell lines targeted………33
Table 5.8: Capability of Non Patentable genes to separate CSC like from non CSC like……….40
Table 5.9: Concordance between microarray and qPCR gene expression data for Non Patentable gene list……….41
Table 5.10: Capability of Non Patentable genes to separate CSC like from non CSC like………..47
Table 5.11: Concordance between microarray and qPCR gene expression data for Patentable gene list47 Table 5.12: Genes showed clear difference in graph bars between CSC like and non CSC like…………48
Table 5.13: IC50, EC50, Activity area and Amax values for Panobinostat, Lapatinib, Midostaurin and Elesclomol in 2D cell culture conditions……….49
Table 5.14: Comparison of drug parameters for CSC like cells vs. non CSC like cells using 2 sided T.Test……….55
Table 5.15: IC50, EC50, Activity area and Amax values for Panobinostat, Lapatinib, Midostaurin and Elesclomol in 3D cell culture conditions……….61
xv
Table 5.16: Concordance analysis of Microarray with TaqMan Probes result……….71 Table 5.17: Concordance analysis of Microarray with SybrGreen result………..71
xvi
ABBREVIATIONS
0
C Degree Centigrade
CSC Cancer Stem Cell
PCR Polymerase Chain Reaction
TNBC Triple Negative Breast Cancer
ALDH Aldehyde Dehydrogenase
BCSC Breast Cancer Stem Cells
CO2 Carbon dioxide
Conc. Concentration
ddH2O Double Distilled Water
DMSO DimethylSulphoxide
EDTA Ethylene diamine tetra acetic acid
EGF Epidermal Growth Factor
ER Estrogen Receptor
PR Progesterone Receptor
FACS Fluorescent Activated Cell Sorting
FBS Fetal Bovine Serum
HDAC Histone Deacetylase Inhibitor
HER2(ERBB2) Human Epidermal Growth Factor Receptor 2
IC50 The half maximal inhibitory concentration
EC50 The half maximal effective concentration
1
1 INTRODUCTION
1.1 Breast Cancer
Among all the causes of morbidity and mortality in women, role of breast cancer is highly intense. Its importance is huge as it is, after lung cancer, the most deadly cancer around the globe1. According to Cancer statistics, 2014, estimated onset of breast cancer cases will be 235,030 (2,360 cases in men and 232,670 cases in women) and estimated deaths are 40,430 (430 in men and 40,000 in women) in USA only2.
1.2 Classification of Breast Cancer
Breast cancer is mostly classified based on clinical and pathological characteristics. Estrogen receptor (ER), progesterone receptor (PR) and ERBB2 receptor are the markers which are being used for early stratification of breast tumors. But this kind of classification cannot reflect true heterogeneous nature of breast tumors. This heterogeneity between tumors arises due to transcriptional variations in biological programs3. Molecular characterization of breast tumors has led us to better classification which relates with prognosis and drug response. Currently, based upon gene expression analyses of tumors, breast tumors are divided into different groups such as Luminal A, Luminal B, Basal, ERBB2 enriched, Claudin low and normal like4, 5.
1.3 Cancer Stem Cells
Various studies have made it clear that breast tumors contain a subpopulation of cancer stem cells (CSCs). CSCs are defined as “a cell within a tumor that possess the capacity to self-renew and to cause the heterogeneous lineages of cancer cells that comprise the tumor”6
. These cells have many features similar to their normal counterparts, normal adult stem cells. Asymmetrical division is one of these characteristics by which these cells produce more CSCs and also phenotypically diverse cells (non CSCs) which compose the major portion of tumor. These CSCs are also responsible for malignancy, metastasis, aggressive tumors and breast cancer relapse 7, 8.
2
Figure 1.1: Cancer stem cells niche
1.4 Breast Cancer Stem Cells
Breast cancer stem cells (BCSCs) were first reported by Al hajj et al based on cell surface markers in 2003. They sorted CD44+/CD24- presenting cells through FACS and found that these cells produce aggressive tumors when injected in mammary fat pad of NOD/SCID mice even when injected as low as 200 cells. But the cells showing CD44+/CD24+ failed to form tumors even at high numbers such as 20,000 and unsorted cells when injected at 10,000 number could form tumors only in 25% of animals upon injections9. There are different theories about the origin of CSCs. First one is cancer stem cell hypothesis that states that CSCs originate through transformation of normal stem cells or early progenitor cells. Second theory states that CSCs originate from epithelial-mesenchymal transition (EMT)7. Another theory against CSC hypothesis is clonal evolution model which states that tumors arise from deviant normal cells which under the influence of accumulated mutations divide insanely. The progeny of that deviant cell will acquire more mutations giving rise to heterogeneous tumor bulk10, 11. But this bias in concepts has been justified by combining CSC and clonal evolution model. This new concept reveals that frequency of CSCs in patients, differ dramatically. And this is also dependent upon dominant mutation, gene amplifications and deletions. So only the dominant CSCs survive and emerge as resistant ones12. Claudin low tumors have been reported as highly enriched for cancer stem cells in breast cancer13.
1.5 Markers for Breast Cancer Stem Cells
CSCs are identified by various cell surface markers but there is not a single universal marker. This may be because of the heterogeneous nature of breast cancer. But the most accepted marker which is being used by many research groups is CD44+/CD24- , first discovered by Al Hajj et al9. Other cell surface markers include are aldehyde dehydrogenase1+ (ALDH1), CD49f+, CD133+, GD+, CD271, PKH+ and
3
ANTXR114-20. These markers identify CSC phenotypes differently on the basis of cell differentiation21. These markers are used in various combinations. Among the techniques which are used for characterizing cells with the help of above mentioned markers are Fluorescence-activated cell sorting (FACS) and immunohistochemistry. Microarray and RT-PCR can also be used for specifying CSCs from Non CSCs. Most of the studies conducting research over breast cancer stem cells (BCSCs), cell are sorted over expression of stem cell markers and then used for further experiments.
1.6 Epithelial - Mesenchymal Transition and Cancer Stem Cells
Epithelial - mesenchymal transition (EMT) is the process of transformation of non-mobile epithelial like cells into mobile mesenchymal like cells. This process was first recognized due to its role in embryogenesis. Opposite of EMT is mesenchymal - epithelial transformation (MET)22. Apart from natural role of EMT, this process also plays its part also in caner development. In tumors EMT and MET coexist. But the most alarming part is CSC cells share a lot of similar characteristics with the cells undergone EMT. Both kinds show characteristics like capability to generate whole tumors, metastasis, lack of differentiation, participation in formation of mammosphere and resistance e to anti-cancer therapies23. Additionally anoikis is any type of apoptosis which can be inhibited by cell to matrix interaction and is critical for tumor metastasis. Anoikis is suppressed both in EMT and CSCs and this is one of the reason that spheres can be generated from these CSC cells24. Previously in a study, human mammary epithelial cells (HMLE) cells were induced for ectopic expression of Twist or Snail (EMT inducers), most of the resultant mesenchymal cells also expressed CD44high/CD24low. Additionally, these cells were also capable of generating basal and luminal lineage cells25. Moreover stem like cells isolated from mouse and human mammary glands were found to express EMT markers. p53 inactivation, EMT and stem cell like properties are also related closely26. From these evidences, at least this can be concluded that EMT and CSCs are induced by same mechanism.
1.7 Factors Associated With Induction of Stemness Phenotype
Various factors which are known to be associated with induction of stemness properties have been reported in literature previously. For instance Transforming growth factor-beta (TGF-β) plays its role in increasing breast CSCs through EMT especially in Claudin low tumors27. BRCA1 mutant or deficient cells, are reported as well for increased accumulation of stem cells. This factor can be arisen due to loss of double stranded DNA repair in these cells28. Cytokines have also been previously reported as key regulators for BCSCs. Most important of these cytokines is IL629. IL8 is also reported to be excreted at 10 fold higher amounts when MCF7 cells were cultured on collagen scaffold as compared to culturing in adherent conditions30. Additionally, overexpression of IL8, also plays an important role in EMT as well31. IL6 also has been reported to impart resistance for HER2+ breast cancers by increasing the number of BCSCs population32. SLUG/SNAI2 and Tumor necrosis factor (TNF) are also reported to generate
4
BCSCs. MCF10A cells when transfected with SLUG, showed CD44+/CD24- high signature and same pattern was seen when these cells were treated with TNF33.
1.8 Resistance of Cancer Stem Cells to Therapy
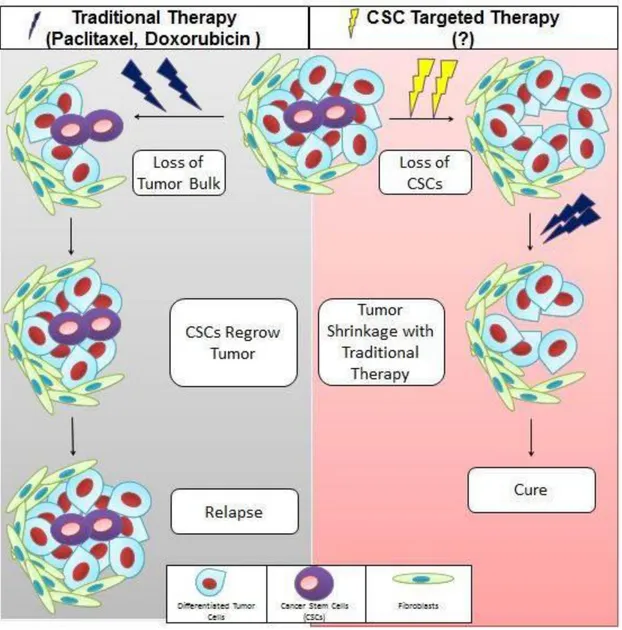
Conventional drugs used for breast cancer only target non CSCs in most of the cases. So CSCs causes relapse of tumor by differentiation. These CSCs are resistant to chemotherapy, radiation therapy, endocrine therapy and apoptosis. Wnt, Notch, Hedgehog and TGF beta signaling pathways interact with each other in CSCs aiding their mechanisms of evasion from cancer therapies22, 23, 34. So to target these cells, different strategies should be opted. CSC signaling pathways are important target for therapeutic agents. Among other targets to treat CSCs some are differentiation therapies, DNA repair mechanisms, apoptotic resistance and CSC microenvironment12. Additionally cellular surface markers from which CSCs are identified, can be used as targets to destroy these cells35. So by combining traditional therapy with CSC targeted therapy, CSC issue can be overcome.
5
Figure 1.2: Targeting cancer stem cells and non-cancer stem cells.
1.9 Cancer Stem Cells in Cell Lines
It has been shown in many studies that Breast cancer cell lines also contain CSCs. Fillmore et al showed presence of stem cells in eight different breast cancer cell lines using CD24, CD44 and epithelial-specific antigen (ESA) expression. Stem cells present in cell lines were referred as CSC like cells and these cells when cultured, can grow to parental cell line36. Jauffret et al later showed presence of stem cells in 33 different breast cancer cell lines using ALDH1 marker. And when ALDH1+ cells were injected in mice, very small number of these cells could generate tumors in mice37.
6
1.10 Cancer Stem Cell Culturing
Sorted CSCs are mostly cultured in absence of attachment as spheres in vitro (also referred as 3D culturing). In breast cancer cells these spheres are called as mammosphere. This culturing method enriches CSCs but when cells from these spheres are re-cultured in form of monolayers (2D culturing) they lose their stem cell phenotype16. Among several methods to culture spheres, some are: gel based culture, low binding plates, rotary culture and hanging drop method38. Culturing spheres is a faster and cheaper method but it has some limitations as important factors required for in vivo growth for these cells are not provided and time required for these cells to grow and differentiate is more as compared to in vivo systems. CSCs are also transplanted in immunodeficient mice where even in smaller numbers they can generate tumors. And these tumors can metastasize and resemble parental cancer cells. But this method also has some limitations such as mice short life, altered niche for CSCs and lack of cytokines etc.39.
1.11 Cancer Cell Line Encyclopedia and Cancer Genome Project
Role of human cancer cell lines in understanding tumor biology and various discoveries of drug is irrefutable. In 2012 two databases were published containing genomic and cytotoxicity data for cell lines. One of these data is Cancer Cell Line Encyclopedia (CCLE). CCLE contains genomic data for 947 human cancer cell lines. These cell lines cover 36 different types of tumor. Further, around 500 of these cell lines are profiled for 24 different pharmacological compounds. Mutational data for cell lines is also provided. Only for breast cancer, this database contains 56 cell lines40. Second database is Cancer Genome Project (CGP). This database contains genomic information for 639 cell lines and these cell lines were screened with 130 different compounds. Mutational data for these cell lines was also provided. This database contains 39 breast cancer cell lines41. In our project both of these databases were used for their gene expression datasets and drug profiling.
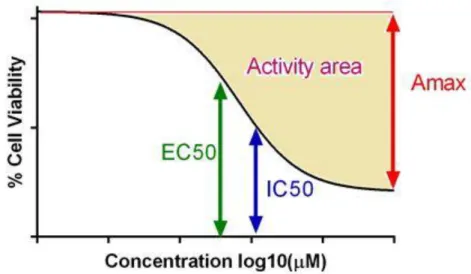
In CCLE, Dose responses curves were fitted using two different models (called as 3 and 4 parameter). Additionally, four different parameters were used to describe cytotoxic effects of drugs. These parameters were half maximal inhibitory concentration (IC50), half maximal effective concentration (EC50), maximum activity (Amax) and Activity area. Amax is the maximal activity reached within a dose response curve model and Activity area is referred to as area between activities at lowest concentration up to maximum tested concentration.
7
Figure 1.3: Parameters used for determination of drug’s cell cytotoxicity.
1.12 Patentable Gene List and Non Patentable Gene Lists
Previously our group has published a paper based only on in silico data only, which shows that based upon their gene expression, some breast cancer cell lines also behave as stem cell like. Later breast cancer cell lines were divided into Basal A, Basal B and Luminal subtypes. And to our surprise, all cell lines in Basal B subtype showed CSC like characteristics42. Only CCLE data for 27 cell lines, was included in this paper.
In this project, we used more number of breast cancer cell lines as compared to previous, 56 cell lines from CCLE and also included CGP data, 39 cell lines. To characterize breast cancer cell lines into stem cell like and non-stem cell like groups, two gene lists were proposed. These gene lists were named as Non Patentable and Patentable gene lists. Non Patentable gene list was the one which contained best genes which can differentiate these groups into two but genes in this list were found to be described previously for their role in separation of CSC like cells from non CSC like. But we wanted to patent some genes which can separate these groups, so for this reason other genes were determined which could do the same and named this gene list as Patentable gene list.
8
2 Aims of the study
CSCs have been identified in many cancers including breast, heart, pancreas, lung, liver, skin and testes43. To get rid of tumors, targeting these cells is prerequisite. Like other cancers, in breast cancer, these cells lead to self- renewability, giving rise to different phenotypes causing tumor heterogeneity and resistance to therapies. When breast tumors are treated with traditional therapy, these cells get away unharmed and then result into relapse of tumor. So targeting these cells with traditional therapy rotationally seems to be perfect solution for CSC problem.
Generally BCSCs are sorted through FACS and then sorted cells are used for further studies. But in this project, one of our objectives is to characterize breast cancer cell lines in terms of their CSC behavior. To characterize these cells based upon said characters, we will define set of biomarker genes by which cell lines can be clustered in CSC or non CSC like phenotypes. Additionally other objective is to predict drugs which can specifically target those CSC like and non CSC like cells separately. And in the end these findings (both genes and drugs) will be validated in breast cancer cell lines.
2.1 Scheme of the Study
Breast cancer cell lines will be first stratified into CSC like and non CSC like by using a previously published gene list which is capable of dividing CSC from non CSC cells. Then differentially expressed genes will be determined between those stratified cell lines. Minimum number of genes will be determined which can cluster those cell lines into same manner. Additionally drugs will be identified which can target these subclasses specifically. Both drugs and genes will be then validated in vitro.
9
3 MATERIALS
3.1 General Laboratory Reagents and Equipment
Various reagents were bought from different sources. Chloroform, Isopropanol and Ethanol were bought from SIGMA-ALDRICH (St. Louis, MO, USA). DMSO (Dimethyl sulfoxide) was procured from AppliChem (Darmstadt, Germany). RNAse Zap and Nuclease Free Water were purchased from Ambion (Carlsbad, CA, U.S.). Qubit™ RNA BR Assay Kit and DNA-free™ Kit were purchased from Invitrogen (Carlsbad, CA, USA). Agilent RNA 6000 Nano Kit was purchased from Agilent Technologies (Santa Clara, CA, USA). RevertAid First Strand cDNA Synthesis Kit was purchased from Thermo Scientific (Waltham, MA, USA). OneTaq Quick-Load 2X Master Mix with Standard Buffer was purchased from New England BioLabs (Ipswich, MA, USA). TaqMan Gene Expression Assays and TaqMan Universal PCR Master Mix were used from Applied Biosystems (Carlsbad, CA, U.S.).
To evaluate the purity and quantity of RNA samples NanoDrop (Thermo Scientific, Wilmington, USA) was utilized. Additionally to measure the more explicit value of RNA samples Qubit Fluorometer (Invitrogen, Carlsbad, CA, USA) was used. Gel electrophoresis system was supplied by Hoefer Inc. (Holliston, MA).
3.2 General Laboratory Solutions
For preparation of 100 ml of 1% Agarose gel, 5 µl of Ethidium bromide was used from 10mg/ml stocks.
50X Tris Acetate EDTA was prepared by dissolving 37.2 g of Tritiplex III (EDTA), 242 g of Tris Base and 57.1 ml of glacial acetic acid in 1 liter of ddH2O.
3.3 Cell Culture Materials and Reagents
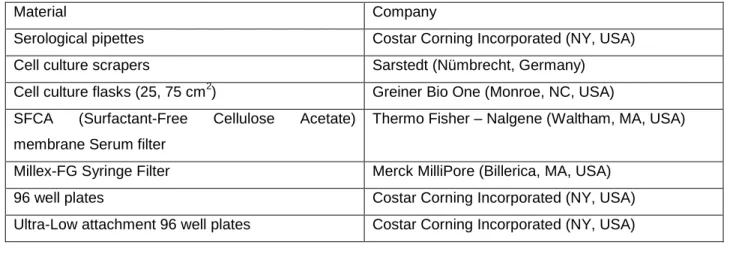
Table 3.1: Materials purchased for use in general cell culture procedures and the companies.
Material Company
Serological pipettes Costar Corning Incorporated (NY, USA)
Cell culture scrapers Sarstedt (Nümbrecht, Germany)
Cell culture flasks (25, 75 cm2) Greiner Bio One (Monroe, NC, USA) SFCA (Surfactant-Free Cellulose Acetate)
membrane Serum filter
Thermo Fisher – Nalgene (Waltham, MA, USA)
Millex-FG Syringe Filter Merck MilliPore (Billerica, MA, USA)
96 well plates Costar Corning Incorporated (NY, USA)
10
Ultra-Low attachment 75 cm cell culture flasks Costar Corning Incorporated (NY, USA)
Cell Strainer, 40 µm Becton Dickinson (NJ, USA)
10, 20 , 200 and 1000 µl filtered tips for micropipettes
Greiner Bio One (Monroe, NC, USA)
Cell culture medium and reagents were purchased from mentioned companies for routine cell culture as mentioned in table 3.2.
Table 3.2: Cell Culture Medium and Reagents
Reagents Company
Dulbecco's Modified Eagle Medium (DMEM) Lonza (Basel, Switzerland) Rosswell Park Memorial Institute Medium (RPMI) GIBCO (Carlsbad, CA, USA) B27 spheroid media supplement Invitrogen, Carlsbad, CA, USA
Epidermal Growth Factor human (EGF) SIGMA-ALDRICH (St. Louis, MO, USA) Fibroblast Growth Factor-Basic human (FGF) SIGMA-ALDRICH (St. Louis, MO, USA)
Heparin sodium salt SIGMA-ALDRICH (St. Louis, MO, USA)
Trypsin-EDTA SIGMA-ALDRICH (St. Louis, MO, USA)
Fetal Bovine Serum (FBS) GIBCO (Carlsbad, CA, USA)
L-Glutamine HyClone (Rockford, USA)
Fetal Bovine Serum (FBS) (Carlsbad, CA, USA)
Penicillin –Streptomycin HyClone (Rockford, USA)
CellTiter-Glo® Luminescent Cell Viability Assay Promega (Fitchburg, Wisconsin, USA) TrypLE™ Select Enzyme (1X), no phenol red Life Technologies (Waltham, MA,USA)
TRIzol® Reagent Life Technologies (Waltham, MA,USA)
3.4 Cell Culture Media and Solutions
Breast cancer cell lines, MDA-MB-157, MDA-MB-231, MDA-MB-453, MDA-MB-468, CAMA-1 and MCF7 were cultured in DMEM media. T47D and HCC1937 cell lines were cultured in RPMI media.
11
Growth media for 2D cell culture was prepared by filtering 10% FBS, 1% L-Glutamine and 1% Penicillin – Streptomycin of the total media, through 0.2 µm syringe filters. This filtrate was then added to respective media.
EGF stock solution was prepared in ddH2O as 1 µg/µl. And from this intermediate and working stock
solutions were prepared as 20ng/µl and 4ng/µl respectively.
FGF stock solution was prepared in Phosphate Buffer as 1 µg/µl. And from this intermediate and working stock solutions were prepared as 20ng/µl and 2ng/µl respectively.
Heparin stock solution was prepared in ddH2O as 100µg/µl. And from this intermediate and working stock
solutions were prepared as 10µg/µl and 4µg/µl respectively.
To prepare Phosphate buffer, 5.52 g of monobasic sodium phosphate (NaH2PO4) was dissolved in 100 ml
ddH2O and 5.68 g of dibasic sodium phosphate (Na2H2PO4) was dissolved in 100 ml ddH2O separately.
Then both solutions were added to each other to make 0.2 M Phosphate buffer which was then diluted 1:1 to make 0.1 M Phosphate buffer.
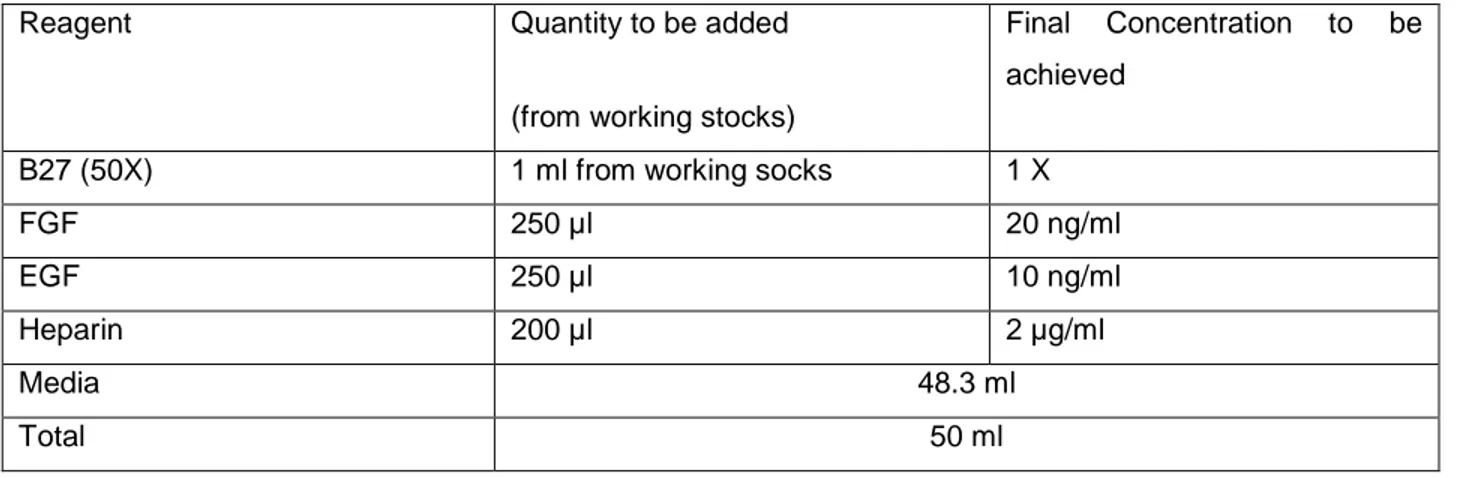
To prepare Growth media for 3D culture 1% L-Glutamine and 1% Penicillin –Streptomycin of the total media was filtered through 0.2 µm syringe filters. Later to prepare working media, EGF, FGF, Heparin and B27 supplement were added in the amount described in the following table 3.3.
Table 3.3: Composition of media for 3D culture
Reagent Quantity to be added
(from working stocks)
Final Concentration to be achieved
B27 (50X) 1 ml from working socks 1 X
FGF 250 µl 20 ng/ml EGF 250 µl 10 ng/ml Heparin 200 µl 2 µg/ml Media 48.3 ml Total 50 ml
12
10X Phosphate buffered saline (PBS) was prepared by mixing 80g of Sodium Chloride (NaCl), 2g of Potassium Chloride (KCl), 2.4g of Mon potassium Phosphate (KH2PO4) and 14.4g of sodium phosphate
(Na2HPO4) in 1 liter of ddH2O. 10X PBS was then diluted to 1X and then autoclaved. Before use in cell
culture, it was also filtered through SFCA membrane Serum filter.
Freezing medium for cells was prepared by adding 10% DMSO to 90% FBS of total volume of media.
For cell cytotoxicity analysis of 4 drugs, Panobinostat, Lapatinib, Elesclomol and Midostaurin were purchased from Selleck Chem, CAYMAN, Medchemexpress and Sigma-Aldrich respectively. All drugs were dissolved in DMSO. Stock concentration of Panobinostat, Lapatinib and Elesclomol was 50mM and Midostaurin stocks were made at 5mM.
13
4 METHODS
4.1 Cell Culture Techniques
Breast cancer cell lines used in this study are MDA-MB-157, MDA-MB-231, MDA-MB-453, MDA-MB-468, CAMA-1, T47D and HCC1937. These cell lines were grown in both 2D and 3D culturing conditions. All cell lines were incubated in 5% CO2 incubator at 37
0
C.
4.2 Culturing Preserved Cells
Cryovials containing specified cell lines were previously stored in liquid nitrogen Tank. These were removed from there and frozen cells were thawed immediately by placing them in water at 37 0C. These cells were then added to 15ml falcon tubes and 5 ml pre warmed growth medium was added on top of them very slowly. Each falcon tube was centrifuged for 3 minutes at 1500 rev/min. The Cells settled down and formed a pellet. Supernatant freezing medium containing DMSO was removed by aspirator and cell’s pellet was re-suspended in 1 ml of fresh medium and this was added to 25 cm2 flasks containing 5 ml media. Then that flask was placed in CO2 Incubator at 37
0
C. After achieving 80-90% confluency, cells were transferred to 75cm2 flasks.
4.3 Culturing Cells in 2D Culture
Cell lines were cultured in either DMEM or RPMI-1640 as illustrated in materials section. On achieving more than 70% confluency, cells were passaged. Passaging ratios was based upon the population doubling time of those cell lines. Fast growing cell lines were passaged 1:5 while cell lines whose doubling time was high were passaged 1:2. For passaging cells, growth media was removed by aspirator and 1X PBS was used to wash the cells. To detach cells from flask surface, pre-warmed 1ml Trypsin-EDTA was poured on the top of cells and spread to each corner of flask. Then flask was placed in CO2
incubator at 37 0C for 1-2 minutes. After observing detached cells through microscope, 5 ml fresh media was added to that flask to inactivate trypsin. This media now containing cells was pipetted up and down a few times to disperse cells. Then this media was transferred to 15ml falcon and centrifuged at 1500 rev/min for 3 minutes. Later supernatant was removed and cell pellet was re-suspended in 2 ml media and transferred in 75 cm2 flasks containing 8ml media.
4.4 Cryopreservation of Cells
After passaging cells were incubated for 24 hrs. Growth media was removed confluent cell lines flasks and then cells were washed with 1X PBS. This was followed by trypsinization of those cells by using 2ml trypsin-EDTA. Cells were incubated for 2 min to detach. Later 5 ml fresh media was added to inactivate trypsin and this was transferred to 15ml falcon tubes. This tube was the centrifuged at 1500 rev/min for 3
14
minutes. Supernatant was removed and pellet of cells was re-suspended in freezing medium. The amount of freezing media was adjusted relative to confluency of cells. 1 ml form this was then transferred to each cryovial. These vials were labeled with name, passage number and date. After that, these vials were stored at -20 0C for 1-2 hrs. and then at -800C or liquid nitrogen for long term storage.
4.5 Culturing Cells in 3D Culture
Sphere media or 3D media was prepared as described in materials part. For initiating 3D culturing of cells, cells were plated into ultra-low attachment flasks. To initiate this culture cells were first cultured in 2D culture. On achieving 80-90% confluency, these cells were trypsinized and centrifuged at 800rev/min for 4 minutes. Supernatant was removed and cells were re-suspended in 2 ml of sphere media. Then this was transferred to 75cm2 ultra low attachment flask containing 8 ml media. This flask was then placed in CO2 incubator. After 3 days, cells had formed spheres but there were single cells as well. To separate
these spheroids from single cells and subculture them, a 40 µm cell strainer was put on top of a 50 ml falcon tube. Then spheroid suspension was taken out from flask and poured onto strainer. This way single cells having size less than 40 µm, went through strainer with media but spheroids left on the strainer. These spheroids were then transferred to a petri dish by inverting that strainer over petri dish and 1X PBS was poured on top of strainer. PBS containing spheroids was collected form petri dish and transferred to 15 ml falcon tube. Strainer was washed one more time, the same way, with 5 ml of PBS and that was also collected into same falcon tube. Then that tube was centrifuged at 800rev/min for 4 minutes. Later supernatant was removed. 3 ml of TrypLE was added and pipetted up and down to dissociate spheres both chemically and physically. Then this suspension was placed in incubator at 37
0
C. Then 6 ml of 1X PBS was added and mixed by pipetting. That tube was again centrifuged at 800rev/min for 4 minutes to collect pellet of spheroid cells. Then supernatant was removed and cells were re-suspended in 2 ml of sphere media. Then this was transferred to 75cm2 ultra low attachment flask containing 8 ml media. Same procedure was repeated for sub culturing of spheroids one more time but for later passages, only filtration step was removed from protocol. Spheres were passaged 12 times post 1st filtration. Cells were not diluted for passaging, as number of cells decreased for some cell lines along the time. 1/3rd of pellet was separated for RNA isolation at 3rd, 6th, 9th and 12th passages and after these passages, cell cytotoxicity values were measured with these cells for four drugs38.
4.6 Collection of Cells for RNA Extraction
For collection of cells from monolayer adherent culture, to 75cm2 flask containing 80% confluent cell lines growth media was removed and washed with 1X PBS to remove dead cells. Then 6 ml ice cold 1X PBS was added and cells were scratched using cell scratcher. Scratched cells were later collected into PBS and transferred into 15 ml falcon tubes which were later centrifuged at 1500 rev/min for 4 minutes at 4oC. PBS was then removed by aspirator and pellet was stored at -80 oC for later RNA extraction.
15
For RNA extraction from spheroid, cells were separated during passaging protocol. For this purpose, 1/3rd spheroid suspension was separated and centrifuged at 1500 rev/min for 4 minutes at 4oC. Later by removing supernatant, 6 ml ice cold 1X PBS was used to re-suspend pellet and then again centrifuged at 1500 rev/min for 4 minutes at 4oC. Then supernatant PBS was removed and cell pellet was stored at -80
o
C for later RNA extraction.
4.7 RNA Extraction
The pellet of each cell line was homogenized with 1 ml TRIzol® Reagent (Life Technologies, Waltham, MA, USA), transferred to separate eppendorf for each sample and incubated for 5 minutes at room temperature. Later this was centrifuged at 13000rev/min for 15 minutes at 4oC. On top this then chloroform was added to each sample and 10 minutes incubation was given followed by centrifugation at 13000rev/min for 15 minutes at 4oC. Upper phases containing RNAs from each sample was transferred to a separate eppendorf. Then Isopropanol was added to each tube which was followed by 10 minute incubation at room temperature then centrifugation at 13000rev/min for 15 minutes at 4oC. Now supernatant was removed and Ethyl Alcohol was added to wash extracted RNA. Pellet was incubated for 10 minutes at room temperature and centrifuged at 13000rev/min for 15 minutes at 4oC. Then ethyl alcohol was removed and pellets were air dried. Then depending upon the sizes of pellets, these were dissolved in relative Nuclease Free Water (Ambion Carlsbad, CA, USA). Then each sample was incubated for 15 min at Thermolyne heater. To determine quality and quantity of each sample, RNA concentration was measured by Nanodrop spectrophotometer ND-1000 (NanoDrop Technologies; Wilmington, DE). Then samples were stored at -80 oC.
4.8 DNAse Treatment
RNA isolation can also result in possible contamination of DNA in RNA samples. So to avoid such contamination, DNAse treatment was performed with each sample using DNA-Free kit (Ambion, Carlsbad, CA, USA). Samples were diluted to 200ng/µl. To each sample, 1µl rDNAse I and 5µl DNAse Buffer was added to 44µl of RNA sample. Total reaction of 50µl was prepared. Samples were then incubated at 37 oC for 30 minutes on Thermolyne heater. To terminate the reaction, 5µl DNAse inactivation was added to each sample and pipetted for 2 minutes. Then each sample was centrifuged at 10000rev/min for 2 minutes. Supernatants contained DNA free RNAs. These were separated in new labeled eppendorfs.
4.9 RNA Quantification by Qubit
After DNAse treatment, quantity of RNA samples were quantified again by Qubit Fluorometer (Invitrogen) as it is more explicit to NanoDrop. The advantage of Qubit over NanoDrop comes as fluorescents bind directly to nucleic acid. Qubit® RNA BR Assay Kit (Invitrogen, Carlsbad, CA, USA) was supplied with
16
Qubit™ RNA BR Reagent, Standards and Buffer. Working solutions was prepared by adding 1 µl Qubit BR reagent to 190 µl buffers for every sample. Both standards were prepared by adding 10µl to 190 µl of working solution. 2 minutes incubation was given to both standards and instrument was calibrated. Then 2 µl of each sample was added to 198 µl working solution. 2 minutes incubation time was given to all samples and measured.
4.10 cDNA Synthesis
For each sample, 500ng of total RNA was used to synthesize cDNAs. RevertAid First Strand cDNA Synthesis Kit (Thermo Fisher Scientific, Waltham, MA, USA) was used for this purpose. For each sample triplicates of 20µl was prepared. Random hexamer primers were used. RNA sample, primer and water were incubated for 5 minutes at 65 oC. For RT+ve samples, Master mix was prepared including 5X Reaction Buffer, Ribolock RNase Inhibitor, 10 mMdNTP Mix and Reverse Transcriptase was prepared. For RT-ve controls, separate Master mix was prepared including 5X Reaction Buffer, Ribolock RNase Inhibitor, 10 mMdNTP Mix and water was prepared. To these controls, instead of Reverse Transcriptase, water was added. cDNA synthesis reaction conditions were at 25°C for 10 min, 42°C for 60 min and 70°C for 5 min.
4.11 End Point Polymerase Chain Reaction
To make sure that product of cDNAs were free of genomic DNA. Primers used for this reaction were 18S as they consist of one exon only so these can identify genomic DNA contamination. Sequences of forward and reverse primer were 5 ’CGTGCATTTATCAGATCAAAACCAACC-3’ and 5’-ATGGTAGGCACGGCGACTAC-3’ respectively. OneTaq™ Quick Load® Master Mix (New England BioLabs) Nuclease free water and primers were mixed and allocated to separate reaction tubes. To these tubes, RT+ve and RT-ve samples were added. Conditions for this reaction were initial denaturation at 94°C for 5 minutes, followed by 30 cycles of denaturation at 94°C for 30 seconds, annealing at 60°C for 30 seconds and extension at 72°C for 30 seconds. Final extension was done at 72°C for 5 minutes.
4.12 Agarose Gel Electrophoresis
To detect genomic DNA contamination and visualize End point Polymerase Chain Reaction products, these were run on Agarose Gel. 1% agarose gel solution was prepared in 1X TAE and heated in microwave so that agarose gets dissolve in TAE completely. To this solution then Ethidium Bromide was added as described in materials section. This solution was then poured into gel tray so that it can solidify and gel can be formed. Then this tray containing gel was placed in 1X TAE filled tank. Samples, 8µl, were loaded to wells after mixing with 2µl of loading dye. Gene ruler (#SM0373 Thermo Scientific Waltham, MA, USA), 50bp DNA ladder, was also added, 3µl to one well. The gel was run at 110volt for 30 minutes
17
and then visualized. Samples having band in RT +ve samples and no band in RT-ve controls were further used.
4.13 Quantitative Real time Polymerase Chain Reaction (qRT-PCR)
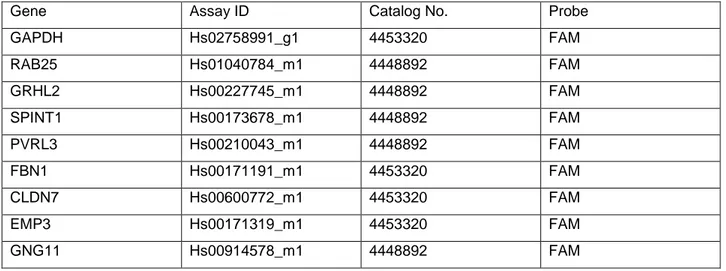
Exicycler™ 96 Real-Time Quantitative Thermal Block (Bioneer, Korea) was used for performing qRT-PCR experiments. Both SybrGreen and TaqMan assays were performed for different genes. Every gene was run in triplicate for each sample. Every sample was diluted 1:4. Each TaqMan reaction consisted of 2µl of diluted sample, 10µl TaqMan Universal Master Mix, 1µl TaqMan gene expression primer probes (Applied Biosystems) and 7µl of Nuclease free water. Predesigned TaqMan probes were ordered for 9 genes whose assay IDs, catalog no and probe dyes are given in table 4.1.
Table 4.1: Predesigned TaqMan probes
Gene Assay ID Catalog No. Probe
GAPDH Hs02758991_g1 4453320 FAM RAB25 Hs01040784_m1 4448892 FAM GRHL2 Hs00227745_m1 4448892 FAM SPINT1 Hs00173678_m1 4448892 FAM PVRL3 Hs00210043_m1 4448892 FAM FBN1 Hs00171191_m1 4453320 FAM CLDN7 Hs00600772_m1 4453320 FAM EMP3 Hs00171319_m1 4453320 FAM GNG11 Hs00914578_m1 4448892 FAM
For TaqMan assay, reaction conditions were holding stage at 50°C for 2 min to block reamplification of carryover PCR products by activating AmpErase UNG enzyme, incubation for inactivation of former mentioned enzyme, followed by 45 cycles of incubation at 95°C for 15 seconds and at 60°C for 1 minute. Reaction was lastly incubated for 1 minute at 60°C. In every PCR plate, for every gene, one template control was run as well.
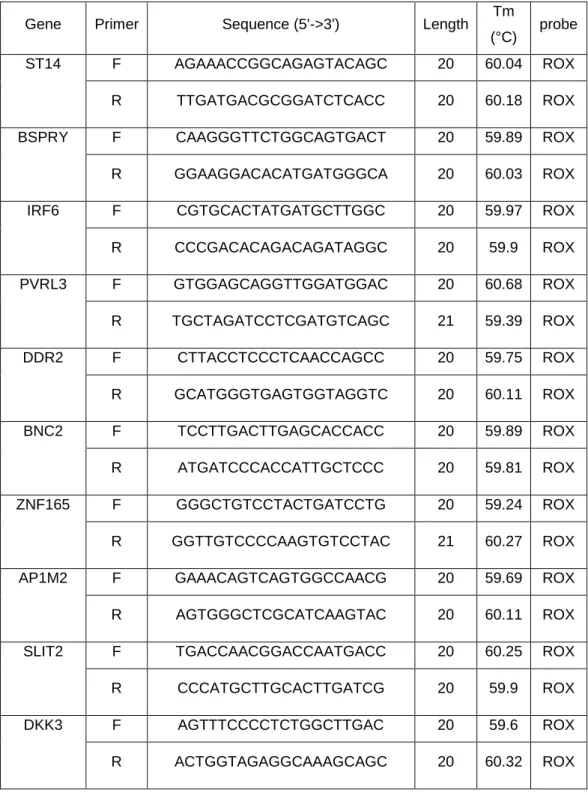
For cyber green assay, primers were custom designed for specific probesets of genes. Sequence of each probe set was downloaded from Batch Query, NetAffyx Analysis Center, Affymetrix (https://www.affymetrix.com/analysis/netaffx/batch_query.affx?netaffx=netaffx4_annot). Then using these sequences, primers were designed using Primer3 online tool (http://primer3.ut.ee/) and then validated again with NCBI Primer-Blast Tool (http://www.ncbi.nlm.nih.gov/tools/primer-blast/). Each qPCR reaction
18
contained 10µl of SYBR® Green Real-Time PCR Master Mix (Life Technologies), 0.6µl of both forward and reverse primer and 6.8µl of nuclease free water. For each reaction, first incubation was at 50°C for 2 minutes, then at 95°C for 10 minutes followed by 40 cycles of incubation at 95°C for 15 seconds and 60°C for 1 minute. Melting stage was 60°C to 95°C, Every 0.5°C per 1 second.
Table 4.2: Sequence and melting temperature of each g ene used with SYBR Green assay
Gene Primer Sequence (5'->3') Length Tm
(°C) probe
ST14 F AGAAACCGGCAGAGTACAGC 20 60.04 ROX
R TTGATGACGCGGATCTCACC 20 60.18 ROX
BSPRY F CAAGGGTTCTGGCAGTGACT 20 59.89 ROX
R GGAAGGACACATGATGGGCA 20 60.03 ROX
IRF6 F CGTGCACTATGATGCTTGGC 20 59.97 ROX
R CCCGACACAGACAGATAGGC 20 59.9 ROX PVRL3 F GTGGAGCAGGTTGGATGGAC 20 60.68 ROX R TGCTAGATCCTCGATGTCAGC 21 59.39 ROX DDR2 F CTTACCTCCCTCAACCAGCC 20 59.75 ROX R GCATGGGTGAGTGGTAGGTC 20 60.11 ROX BNC2 F TCCTTGACTTGAGCACCACC 20 59.89 ROX R ATGATCCCACCATTGCTCCC 20 59.81 ROX ZNF165 F GGGCTGTCCTACTGATCCTG 20 59.24 ROX R GGTTGTCCCCAAGTGTCCTAC 21 60.27 ROX
AP1M2 F GAAACAGTCAGTGGCCAACG 20 59.69 ROX
R AGTGGGCTCGCATCAAGTAC 20 60.11 ROX
SLIT2 F TGACCAACGGACCAATGACC 20 60.25 ROX
R CCCATGCTTGCACTTGATCG 20 59.9 ROX
DKK3 F AGTTTCCCCTCTGGCTTGAC 20 59.6 ROX
19
TMEM158 F ACGTGCCCTAGATTCATGGC 20 60.18 ROX
R AAATCCTTCCCATGCCCTCC 20 59.74 ROX
GAPDH F TTCTTTTGCGTCGCCAGCCG 20 61.4 ROX
R CGACCAAATCCGTTGACTCCGACC 24 66.1 ROX
FN1 F TGTGATCCCGTCGACCAATGCC 22 59.23 ROX
R TGCCACTCCCCAATGCCACG 20 59.62 ROX
VIM F CCAAGACACTATTGGCCGCCTGC 23 60.36 ROX
R GCAGAGAAATCCTGCTCTCCTCGC 24 59.42 ROX
CLDN4 F ACCTGTCCCCGAGAGAGAGTGC 22 59.4 ROX
R GATTCCAAGCGCTGGGGACGG 21 60.11 ROX
E-CAD F TGGGCCAGGAAATCACATCCTACA 24 57.57 ROX
R TTGGCAGTGTCTCTCCAAATCCGA 24 57.8 ROX
GAPDH was used as endogenous reference control for normalization sake. All the data was calculated manually using ΔΔCT Method.
4.14 Cell Counting
To determine the approximate number of cells for culturing, haemocytometer was used. Cells were trypsinized and re-suspended as described previously. Haemocytometer and coverslip, both were cleaned gently with 70% ethyl alcohol. Coverslip was then placed gently over chamber area. The cell suspension was gently mixed so that cells should get distributed equally in suspension. Then 10µl of cell suspension was then loaded into each chamber. The cells in each corner square of chamber were counted under light microscope. Average of these values was calculated and multiplied with 104. This is the approximate number of cells per ml of cell suspension.
4.15 Drug Cytotoxicity
For Drug cytotoxicity in 2D culture, cell lines were cultured into 96 well plates after counting with haemocytometer in separate plates (1200 cells/well in 90µl). 24 hours after seeding, cells were treated with four different drugs (Panobinostat, Lapatinib, Elesclomol and Midostaurin). Different concentrations
20
of drugs were prepared using 1% DMSO. 10µl of drugs were added to each well. 72 hours after drug treatment, plates were taken out of incubator and placed at room temperature. Then using CellTiter-Glo® Luminescent Cell Viability Assay (Promega, Madison, WI, United States of America), OD values were taken using The Reporter Microplate Luminometer (Turner Designs). OD results were then used to calculate percentage cell viability by using formula given below.
% cell Viability = (OD value of drug treated well / OD of 1% DMSO treated control well)* 100
These values were then used to draw dose-inhibition response curves using GraphPad software. Concentrations were transformed into log scale and six models were used for this purpose. For each curve model with least error was selected and graphs were drawn. R based program developed by my lab member “Murat İşbilen”, was used to calculate IC50, EC50, AMAX, Activity Area, IC90 and IC95
44
. 6 models used were 3 parameter, 3 parameter Top 100, 3 parameter Bottom 0, 4 parameter, 4 parameter Top 100 and 4 parameter Bottom 0.
Same procedure was used to calculate cytotoxicity results for 3D culture except cells were cultured in 96 well ultra-low attachment plates.
4.16 Calculation of Cytotoxicity Parameters
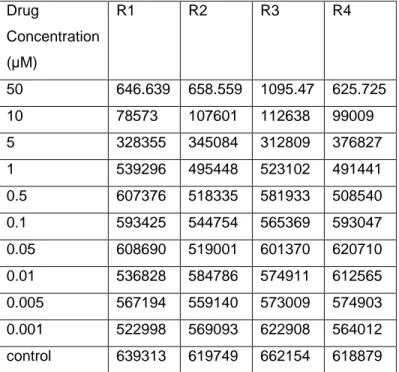
Optical density (OD) values were obtained from The Reporter Microplate Luminometer (Turner Designs).
Table 4.3: OD values for HCC1937 treated with Lapatinib. R1, R2, R3 and R4 show replicates. Drug Concentration (µM) R1 R2 R3 R4 50 646.639 658.559 1095.47 625.725 10 78573 107601 112638 99009 5 328355 345084 312809 376827 1 539296 495448 523102 491441 0.5 607376 518335 581933 508540 0.1 593425 544754 565369 593047 0.05 608690 519001 601370 620710 0.01 536828 584786 574911 612565 0.005 567194 559140 573009 574903 0.001 522998 569093 622908 564012 control 639313 619749 662154 618879
21
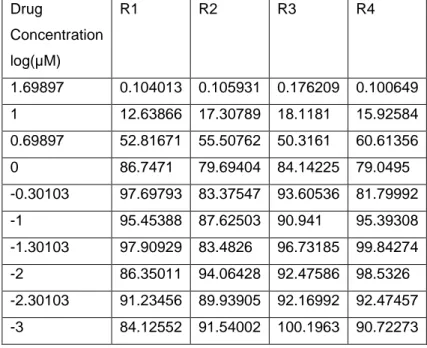
Using % cell viability formula OD values were converted into % cell viability values.
Table 4.4: % viability values for HCC1937 treated with Lapatinib . R1, R2, R3 and R4 show
replicates. Drug Concentration log(µM) R1 R2 R3 R4 1.69897 0.104013 0.105931 0.176209 0.100649 1 12.63866 17.30789 18.1181 15.92584 0.69897 52.81671 55.50762 50.3161 60.61356 0 86.7471 79.69404 84.14225 79.0495 -0.30103 97.69793 83.37547 93.60536 81.79992 -1 95.45388 87.62503 90.941 95.39308 -1.30103 97.90929 83.4826 96.73185 99.84274 -2 86.35011 94.06428 92.47586 98.5326 -2.30103 91.23456 89.93905 92.16992 92.47457 -3 84.12552 91.54002 100.1963 90.72273
6 Graphs using different model were drawn using % cell viability values and model with least error was selected.
Table 4.5: Standard error of model, log (IC50), log(EC50), Activity area and Amax values for HCC1937 treated with Lapatinib. Parameter with least standard error was selected (4
parameter bottom 0).
Model Sample Std. Err of
Model
log(IC50) log(EC50) Activity Area
Amax
3-Parameter Lapatinib HCC1937 5.938 0.646 0.823 102.393 110.452
3-Parameter Bottom 0 Lapatinib HCC1937 7.067 0.608 0.656 101.929 94.685 3-Parameter Top 100 Lapatinib HCC1937 7.434 0.628 0.733 114.402 113.623
4-Parameter Lapatinib HCC1937 3.696 0.726 0.763 85.514 91.731
4-Parameter Bottom 0 Lapatinib HCC1937 3.435 0.727 0.760 84.961 90.833 4-Parameter Top 100 Lapatinib HCC1937 7.942 0.629 0.723 113.796 112.438
22 3 P a r a m e t e r D r u g C o n c e n t r a t io n lo g ( µ M ) % c e ll v ia b il it y - 4 - 3 - 2 - 1 0 1 2 0 5 0 1 0 0 1 5 0 3 P a r a m e t e r T o p 1 0 0 D r u g C o n c e n t r a t io n lo g ( µ M ) % c e ll v ia b il it y - 4 - 3 - 2 - 1 0 1 2 0 5 0 1 0 0 1 5 0 3 P a r a m e t e r B o t t o m 0 D r u g C o n c e n t r a t io n lo g ( µ M ) % c e ll v ia b il it y - 4 - 3 - 2 - 1 0 1 2 0 5 0 1 0 0 1 5 0 4 P a r a m e t e r D r u g C o n c e n t r a t io n lo g ( µ M ) % c e ll v ia b il it y - 4 - 3 - 2 - 1 0 1 2 0 5 0 1 0 0 1 5 0 4 P a r a m e t e r T o p 1 0 0 D r u g C o n c e n t r a t io n lo g ( µ M ) % c e ll v ia b il it y - 4 - 3 - 2 - 1 0 1 2 0 5 0 1 0 0 1 5 0 4 P a r a m e t e r B o t t o m 0 D r u g C o n c e n t r a t io n lo g ( µ M ) % c e ll v ia b il it y - 4 - 3 - 2 - 1 0 1 2 0 5 0 1 0 0 1 5 0
Figure 4.1: Percent Viability curves for HCC1937 treated with Lapatinib. Error bars show mean and
error with 95% confidence interval. Parameter with least standard error was selected which was 4 parameter bottom 0 for this case.
23
4.17 Software Programs Used in this Study
Microarray data downloaded from genomic data hosting websites, ArrayExpress (http://www.ebi.ac.uk/arrayexpress/) and Gene Expression Omnibus (GEO) (http://www.ncbi.nlm.nih.gov/geo/query/acc.cgi?acc=GSE7513) was RMA normalized using BRB tool45. Cluster 3.0 program was used to hierarchically cluster data then heatmaps were generated using Java Treeview. For both genes and samples, Euclidean distances were calculated using complete linkage.
4.18 GraphPad Prism 6.0
GraphPad 6s.0 (GraphPad Software Inc., La Jolla, CA, USA) was used to draw graphs for drug cytotoxicity assays and gene expression analysis. Pearson r correlation was used to relate gene expression and cytotoxicity data. And results were plotted using GraphPad 6.0.
4.19 Principle Component Analysis
Principle component analysis (PCA) was performed to find combination of genes which can be associated with drug cytotoxicity parameters. R based program44 developed by my lab member “Murat İşbilen” was used for this analysis. This program performs PCA with expression of genes. For each possible combination of genes, first principle component (PC1) was determined and this was then correlated with drug sensitivity values.