П і f ^ h ■' •■Vs ( ! f ' . ' ' '•■•Λ ‘ "^ '■■ · l · ^ · ^''· s / t · , ‘i ' -'·· ·. * · · · · * ' i - · ' >/■· . *5 *1 .·■- Λ Т ІЩ f ώ-J ί ' ϊ · 'М -·· U--«w ;··*·'■·■«, ■;?» ;-r'*¿^ /f«)'о,а Ά ;?іѵ,.гі л г·'.·.?. г;: П. .V:·?< '(г* ^-*¿*■ ^ л > ЧіігѴ £ W ■••ь,'·'.‘ •í *·''·’·' «*. ’i·»*· ’«»*' Μ. *' "> ¿ я к ' 'щлл/ »» fc-üí •rt·· «»■<■ ·· ^»..y - ' -· *.»ь -f^ · ?V ."^'''•ϊ *·Λ·“ ··ί sN Λ VV ·7·· Π ;'ş® Γ' я /?·■ 'i» '"· :η'·’ ^ ·*Ι ilv í :> fí -S ‘Ί X. w Ц « 4» ••’.V.v »»;■', .4 S ·Α' ^ i¿.'4i ■*■ -i u C ¿ · ■ *1* ^ ^ ^ ir” ^ <r·?; p * .· P .^P· •i:.·^ :* ;.· ?í f* ‘7 <;;'V i; ■■•'••'я ''·' ‘íf<''*; ÿicU» *-*lÍ¿*’ '*·'^· Ш M '••¿'^· . ■ ■ V ^ ^ ^
AN ANALYSIS OF THE SOURCES OF IMPORT GROWTH IN TURKEY : 1985-90
A THESIS PRESENTED BY OYA CELASUN TO
THE INSTITUTE OF
ECONOMICS AND SOCIAL SCIENCES IN PARTIAL FULFILLMENT OF THE
REQUIREMENTS
FOR THE DEGREE OF MASTER OF ECONOMICS
BILKENT UNIVERSITY JULY, 1995
C)um C^lQ.£xia.. larafir.dcn
Н с M 5 2 _ • CLm6
Qk
I certify that I have read this thesis and in my opinion it is fully adequate, in scope and in quality, as a thesis for the degree of Master of Economics.
Prof.Dr. Suvicky(fhgan
I certify that I have read this thesis and in my opinion it is fully adequate, in scope and in quality, as a thesis for the degree of Master of Economics.
Assoc.Prof.Dr. Nedim Alemdar
I certify that I have read this thesis and in my opinion it is fully adequate, in scope and in quality, as a thesis for the degree of Master of Economics.
Assoc.Prof.Dr. (hm m Zaim
ABSTRACT
AN ANALYSIS OF THE SOURCES OF IMPORT GROWTH IN TURKEY: 1985-90
OYA CELASUN Master of Economics
Supervisor ; Prof Dr. Subidey Togan June 1995
The sources of import growth in Turkey during the 1985-90 period are decomposed into four casual factors domestic demand expansion, export expansion, import substitution and technological change, using the input- output framework. Domestic price indices for imports and gross output were constructed, and the 1990 input-output table was double deflated into constant 1985 prices. The decomposition results are analyzed within the context of the economic conditions in Turkey during the period. It is observed that the structure of the causal factors have changed compared to the previous period of 1979-85. The contribution of export expansion is observed to be negligible, and domestic demand expansion and import substitution are the most prominent sources of import growth between 1985 and 1990.
öz
1985-90 DÖNEMİNDE TÜRKİYE’DEKİ İTHALAT BÜYÜMESİNİN KAYNAKLARININ ANALİZİ
OYA CELASUN
Yüksek Lisans Tezi, iktisat Bölümü Tez Yöneticisi; Prof.Dr.Sübidey Togan
Temmuz 1995
1985-90 döneminde Türkiye’deki ithalat büyümesinin kaynaklan girdi-çıktı çerçevesi içinde dört nedensel faktöre aynştınlmıştır: nihai talep büyümesi, ihracat büyümesi, ithal ikamesi ve teknolojik değişim. İthalat ve gaynsafi çıktı için yurtiçi fiyat endeksleri oluşturulmuş, ve 1990 girdi-çıktı tablosu ikili deflasyon yöntemi ile 1985 fiyatlanna çevrilmiştir. Aynştırma sonuçlan Türkiye’nin o dönemki ekonomik durumu çerçevesinde incelenmiştir. Sonuçlar, nedensel faktörlerde 1979-85 dönemine göre yapısal değişiklikler olduğunu göstermektedir. 1985-90 döneminde, ihracat büyümesinin katkısının ihmal edilebilir, nihai talep büyümesi ve ithal ikamesinin ise en önemli iki kaynak olduğu görülmektedir.
Anahtar kelimeler : Girdi-çıktı, Aynştırma Analizi, İkili deflasyon.
ACKNOWLEDGEMENTS
I wish to express my gratitude to Prof. Dr. Sübidey Togan for his supervision and constant interest. I am grateful to Assoc.Prof. Nedim Alemdar for his valuable comments and constructive suggestions for the improvement of my study. 1 am also grateful to Assoc.Prof. Osman Zaim for his valuable comments. All remaining errors are mine.
Page ABSTRACT...ii O Z... iii ACKNOWLEDGEMENTS...iv TABLE OF CONTENTS... v LIST OF TABLES... vi CHAPTER I : INTRODUCTION... 1
CHAPTER I I : THE BACKGROUND OF DECOMPOSITION ANALYSIS...5
2.1 Introduction... 5
2.2 The Evolution o f Decomposition Analysis and the Import Substitution Measurement Problem...5
2.3 Some Topics in the Empirical Field o f Decomposition Analysis... 13
2.3.1 The Aggregation Problem...13
2.3.2 First Differences versus Deviations Measure for Decomposition... 14
2.3.3 Total versus Direct Decomposition M ethods...14
2.3.4 The Index Number Problem... 15
CHAPTER m : DOUBLE DEFLATION OF THE 1990 INPUT-OUTPUT TABLE...16
3.1 Introduction... 16
3.2 The Construction o f Domestic Price Indices for Imports and Gross Output... 17
3.2.1 The Imports Price Index...17
3.2.2 The Production Price Index...23
3.3 The Construction o f the Composite Price Index and the Deflation o f the 1990 I-O Table... 25
3.3.1 Construction of the Composite Price Index... 26
3.3.2 The Double Deflation Procedure...27
CHAPTER IV : DECOMPOSITION ANALYSIS AND THE RESULTS OF THE SOURCES OF IMPORT GROWTH OF ANALYSIS... 31
4.1 Introduction... 31
4.2 Sources o f Import Growth Between 1985 and 1990... 31
4.3 An Overview o f the Turkish Economy in 1985-90... 32
4.4 Conclusion... 37
REFERENCES... 39 TABLE OF CONTENTS
APPENDICES... 41 APPENDIX A...41 APPENDIX B...42 A PPE N D K C ...43 APPENDIX D ...47 VI
LIST OF TABLES
Table 3.1 1985 and 1990 1-0 Tables at 9x9 Aggregated Level... 18
Table 3.2 Calculation o f Unit $ Prices for Agriculture, Mining, Light Intermediates, Basic Intermediates and Machinery Sectors... 19
Table 3.3 Unit $ price Calculations for Food and Textiles Sectors... 20
Table 3.4 Tax Inclusive Unit TL Import Prices... 22
Table 3.5 The Domestic Import Price Index for 1990 (1985=1)...22
Table 3.6 Construction o f the Production Price Index...24
Table 3.7 The Composite Price Index for 1990 (1985=1)... 27
Table 3.8 Double Deflated 1990 I-O Table Aggregated at 9x9 Level (In 1985 P rices)... 29
Table 4.1 Sources o f Import Growth (Total M ethod)... 32
CHAPTER I INTRODUCTION
The balance o f payments crisis during the late seventies forced the Turkish authorities to abandon the ‘import substitution’ policies followed until 1980, and encouraged them to adopt outward oriented export promoting strategies from then on. As a result, exports surged up from 3.4 percent o f GNP in 1979 to about 16 percent in 1987 and 1988. The growth o f exports was largely facilitated by the devaluations o f the early 1980s. However, the TL was revaluated against the US$ after 1988; the TL appreciated about 40 percent in the 1988-90 period. The 50 percent increase in real wages during the same period contributed to the decline o f competitiveness of the Turkish economy. Although the year 1988 saw a current account surplus o f about 1.5 billion followed by a smaller one in 1989, the balance deteriorated in 1990; exports accounted to only 59 percent o f imports that year. The current account deficit did not recover until the substantial devaluation in early 1994, it reached a peak o f $6.4 billion in 1993.'
The composition o f the foreign trade o f Turkey changed substantially from 1989 onwards in favor o f imports. It is o f considerable policy interest to determine what particular factors contributed to the import boom in 1985-90, and how they differed across sectors. The aim o f the present study is to analyze the sources o f import growth^ o f Turkey in 1985-90 (at the sectoral level) , using the most recent input-output tables available, namely those o f 1985 and
The main method used in this study is decomposition analysis, which distinguishes and estimates the relative weights o f the four causal factors o f import growth:
1. Domestic Demand Expansion (DDE) 2. Export Expansion (EE)
3. Import Substitution (IS) 4. Technological Change (TC)
The first two factors represent the changes in imports caused by the expansion o f demand for domestic final goods and exports respectively, assuming that the import structure o f the economy is constant throughout the period under study. The third factor embodies the changes in the import structure o f the economy. The IS term represents the change in imports induced by the change in the import structure o f final and intermediate goods. Import substitution may be defined as the decreased share o f imports, hence the increased share o f domestic production in satisfying total demand. Then a positive contribution o f the IS factor to import growth implies that there is negative import substitution in the sector, or in other words, import penetration and increased import propensity. The fourth factor represents the changes in imports arising due to the widening and deepening o f interindustry linkages; that is the changes in the input-output coefficients. Such changes in intermediate use requirements may result from technological changes in the production processes, and/or substitution among different intermediates as a result o f the changing conditions in the economy.
The results o f the decomposition analysis o f the sources o f import growth are consistent with the broad conditions in the Turkish economy during 1985-90 .While domestic demand expansion was the most prominent contributor to import growth, export expansion lost its importance compared to the previous period o f 1979-85. Negative import substitution was the second
largest factor in import growth. Technological change was also a positive contributor to import growth.
This method o f decomposing import growth in to four sources, approaches the problem from the sources o f demand side, rather than the
fa cto r supply side.
Another feature o f the analysis carried out in the present study is that imports and domestic production will be formulated as fractions, or in other words as shares o f total demand (or total supply), which may be called as the shares approach.
The decomposition measme employed in this study is ‘first differences’. The four -decomposed- sources include the contributions o f the first differences o f the factors : second period value o f domestic demand, exports, import ratio, and input-output coefficients minus the first period value o f the corresponding factors. Similarly the first difference o f imports will be decomposed^.
The input-output (I-O) framework captures the direct and indirect effects o f demand on growth, and the changes in the structure o f the economy. The indirect backward linkage effects, that is, the induced changes in the demand for the intermediate inputs due to the changes in the demand for the final output o f a sector are incorporated in the decomposition measures. This is the so called total decomposition approach.
In order to be able to carry out the study in real terms, it is necessary to deflate the 1985 and 1990 I-O tables. Since price data are not available for all the 64 sectors in the tables, the tables are aggregated into 9 sectors assuming that a fewer number o f sectors is sufficient to find out the key determinants o f structural shifts in import use. The deflation procedure is carried out in a manner that maintains the balance o f supplies and demands in all sectors, and is thus named as the double deflation procedure. The flows in the 1985 and 1990 I-O tables are measured in producer’s prices, domestic production includes indirect taxes on production. Since imports and exports need to be valued at a consistent manner, imports are measured as the value o f imported goods at c.i.f
prices plus import tariffs, and exports are measured at ex-factory prices. In a consistent manner, price indices need to be constructed for imports, gross output (domestic production), and exports.
A brief literature survey on decomposition analysis is presented in Chapter II, which clarifies the conceptual framework through examining certain contributions to the field o f decomposition analysis. Chapter III describes the construction o f price indices needed to deflate the 1990 I-O table in to 1985 prices, and the double deflation o f the 1990 I-O table. The decomposition results are stated and compared vrith those o f previous studies in Chapter IV .
NOTES
I I he developments in the Turkish economy in 1985-90 were summarized from Hatiboglu (1995). 2. Growth analysis may be applied to the analysis of growth of gross output, imports and value added. 3. The first differences approach is explained in detail in Chapter II.
CHAPTER II
A LITERATURE SURVEY ON DECOMPOSITION ANALYSIS
2.1 Introduction
The models for sources o f growth decomposition are used to decompose the causal factors that altogether lead to differences in the growth rates o f production, value added, imports, factor use and relative prices on a sectoral basis. This framework was originally applied to the analysis o f production, i.e. gross output growth, and later adapted to the analysis o f the growth o f related vectors mentioned above.
The following section briefly summarizes the development o f the technique o f sources o f growth analysis. The debated issue o f the treatment o f import substitution is also briefly covered. Section 2.3 reviews the controversies about the topics o f aggregation, indexation, and briefly reviews certain different methods that may be applied in the sources o f growth analysis.
2.2 The Evolution o f Decomposition Analysis and the Import Substitution Measurement Problem
In this section certain contributions in the evolution o f decomposition analysis are highlighted'. The issue o f the measurement o f import substitution (IS) will also be summarized as a subject o f much debate in empirical research o f the field.
The framework of decomposition analysis was built by Chenery in his ‘Patterns o f Industrial Growth’ (1960). This method o f analyzing structural change takes the material balance equation as the starting p o in t;
(2. 1) X n W i+ D i+ E j-M i
where X; = gross output o f sector i
Wi = intermediate demand for the output o f sector i Dj = final demand for the output of sector i
Ej = export demand for the output o f sector i Mi = total imports o f the commodities in sector i
The identity shows that in each sector, total supply, i.e. the sum o f Xj and Mj equals total demand, the sum o f intermediate and fmal demands, Wj and Di plus export demand Ei.
Chenery assumed that imports in each sector to be a certain fraction , mj, o f the total demand in that sector
(
2
.2
) M, = mi(Di+Wi+Ei)Then production in that sector can be written as
(2.3) Xi = (l-mi)(Di+W i+Ei)
where (l-m;) shows the fraction o f total supply arising from domestic production, or in other words gross output.
As a measure o f structural change, Chenery introduced the ‘deviation from proportional growth’ in each sector. Letting A,=Y'/Y^ denote the growth o f income between the benchmark years, proportional growth in each sector im p lies;
(2.4)
where the superscipt p shows proportional growth, 0 stands for the first year and 1 for the terminal year, and indicate the actual values. Then the following expression shows the deviation from proportional growth in each sector :
(2.5) 6Xi = Xi‘-Xi‘^= X/-?.Xi®= (l-mi'^)( 6Di+6Wi+8Ei) + (m^-mi')Zi:0ч , 0 _ 1
where Z,'== Xj'+Mi*= total supply in sector i
This expression attributes the de\iation o f gross output in the sector i to four factors :
( l-mi^^)( 5Di) = deviation in domestic demand (l-mj^)( 6Wi) = deviation in intermediate demand ( l-m®)(6Ei) = deviation in exports
(mi”-mj*)Zi' = change in the import ratio (IS)
Here the decline in the import ratio between the two benchmark years multiplied by the total supply o f the terminal year is given as the measure o f positive import substitution. This corresponds to the change in the import content o f total supply due to the deviation o f the terminal year import ratio from that of the initial year.
Later, Chenery, Shishido and Watanabe (CSW, 1962) developed the decomposition analysis in the input-output framework, hence incorporating the interindustry linkages. This allowed accounting for not only the direct effects o f the causes o f growth o f output as in Chenery (1960), but also for the indirect effects via the intermediate flows. Hence the Leontief inverse^ enters the picture and the deviation o f gross output from proportional growth becomes.
(2.6) 6Xi = Zj rij‘ ( 5Dj+6Ej -5Mj -?iTj)
where rij = the ith row and jth column entry o f the Leontief inverse Tj = the change in the intermediate use o f commodity j in the
production o f commodity i caused by a change in technology.
The above approach is named as the constant composition method as it does not employ the import ratio m, and thus does not express the imports as a fraction o f total supply. Thus the IS measure becomes -Zj ty* 6Mj , capturing both the direct and indirect effects o f the deviation o f the level o f imports in all the sectors.
Lewis and Soligo (1965) modified the decomposition technique developed by Chenery (1960), rather than the deviations measure, by using the first differences method. Lewis and Soligo start with the following identity:
(2.7) AX = AD + AW + A E -A M
and go on to define the ratio ui=X]/Zi (Zl=total supply) as the ratio o f ‘total domestic production to total supply in the base period’,( 1965:103). Therefore the total change in gross output in any sector i is given by
(2.8) AXi= u"(ADi + AW|) + u"(AE,)+ (Au,)Zi'
Here the demand expansion component o f Chenery(1960) is further broken down into domesic and export demand components. However, both studies ignore the factor o f technological change and the interindustry effects as described by the intermediate flows, two points which were captured by CSW (1962).
Eysenbach(1969) discussed that (Au)Zi‘ was not an exact measure of import substitution, since it implicitly embodied the increase in total supply between the two benchmark periods : Z i'^Zj'^+AZj. Morley and Smith (1970) however, stressed the appropriateness o f using the terminal year demand in the measurement o f IS. Their view was that IS itself was due to the changes in import ratios as well as the changes in total demands.
Morley and Smith criticised Chenery (1960) for not incorporating intermediate demands in their IS measures. They extended the idea o f CSW (1962) in the sense o f incorporating intermediates in to the analysis but opposed the CSW (1962) view o f defining IS, stating that CSW (1962) ‘did not preserve the original notion o f import substitution as a decline in the ratio o f a sectors imports to the total supply o f its products’ (1970:730). They defined IS as ‘ the ex post difference between actual imports in some period t and and what imports would have been had import ratios remained at the levels o f the base period’ (1970:730).
Morley and Smith introduced a redefinition o f imports but maintained the Chenery (1960) approach in the definition of IS. In matrix notation, their redefined imports were M * :
where A is the input output coefficients matrix. Redefined total supply, Z f, then becomes;
(2.10) Z, -X j + Mi*
In this formulation, imports not only supplement, but may also substitute domestic production to satisfy total demand and this may take place for final and/or intermediate use. If imports o f a sector are to be substituted, ‘without induced rises in imported inputs or reductions in the supplies available for final demand in other sectors, production must be increased in not only the industry finally processing the good, but also in its supplier industries and in their supplier industries and so forth’ (1970:729). The IS definition o f Morley and Smith follows as the change domestic production needed to substitute for imports, the final demands being held constant.
(2.11) I S i * = ( M r / Z 0*
Letting X - (iN P ’/GNP^. M orley and Smith state that the CSW definition o f IS measures the changes in Mj/GNP“^, which is problematic as it
could produce contradicting results depending on the relative growth rates of
domestic production, imports and GNP.Syrquin (1976) redefined the import and domestic production ratios. While mi is the fraction o f total demand supplied by the imports in sector i, Uj is the fraction o f total demand supplied by domestic production, or domestic
production for domestic demand:
(2.12) mi = Mi/(Dj+W.)
A similar approach as Syrquin (1976) was adopted by Chenery and Syrquin (1977). Their definition of IS is in a manner ‘that is related to policies affecting import proportions’ (1977:240). Their model employs Uj as the proportion o f total supply produced domestically;
(2.14) Ui = Xj/(Wi+Di+Ei)
Employing the usual material balance equation with W=AX and letting caps (^^) denote diagonalized matrices, they obtain :
(2.15) X = (I -ÛA)· u(D+E) = R‘*û(D+E)
where (I - u A ) '
u(D+E) = final demand supplied from domestic production
Their deviation measure for X is as follows;
(2.16) ÔX = R2‘'Û2§D + R2^Û2ÔE + R2‘*AÛ^, + R2‘^Û2AAX,
R2‘^Û2ÔD = effect o f the deviation of domestic demand with
a constant import structure m all sectors R2‘^Û2ÔE = effect o f the deviation o f exports with
a constant import structure in all sectors
R2‘*AûàZ | = direct and indirect effects of changes in the import structure
R2‘*Û2AAX]= effects o f changes in the input output coefficients
Chenery and Syrquin state that this formulation differs from those in former studies since only the domestic component of the deviation determines
influences on domestic output .This is achieved by the use o f the modified Leontief inverse R‘^= (I -uA) '.
Chenery, Robinson and Syrquin (1986) distinguished between imports for intermediate and final use, denoting them M'^ and M* respectively. Letting Uj'^ and Ui* denote the proportion o f intermediate and final demand produced domestically, they obtain the following material balance equations for domestic production and imports:
(2.17) X, = Ui'^ZjajjXj + Ui‘Dj + Ei
(2.18) Mi = mi'^Wi + m,‘Dj
where mj'^=(l- Uj'^) and m iЦ l- Uj^). In matrix notation
(2.19) (2.20)
X = u'"A X +u‘D + E M = m '"W + m^D
The solution for domestic production is then :
(2.21) X= (I - u" A ) '^ u b + E) = R(u‘D + E)
And output growth is decomposed as follows:
(2.22) AX= R2U2‘AD + R2AE + R2Au‘D, + R2Au'"W, + R2U2'"AAX, R2U2*AD = domestic demand expansion
R2AE = export expansion
R2Aul·)] = import substitution for final goods
R2Au'^Wi = import substitution for intermediate goods R2U2'^AAXi = changes in input output coefficients
where the subscripts show the time periods.
First differences instead o f deviations are used to decompose the causes o f growth in equation (2.22). Chenery, Robinson and Syrquin (1986) point out that import substitution is due to the changes in the ratio o f imports to total demand in each sector which differs from the CSW (1962) formulation.
Syrquin applied the sources o f growth analsis to imports. His adapted formulations will be used in this study. He defines Uj as domestic output for the domestic market:
(2.23) Ui=(Xi-Ei)/(Di+Wi)
and mi equals Mj/(Di+Wi) as usual. Starting from the following equations in matrix form, Syrquin obtains the first difference measures for gross output and imports.
(2.24) X = u (D+W) + E (2.25) M = m (D+W)
The derivations in detail and the decomposition equations that will be used in this study are given in Appendix C.
2.3 Some Topics in the Empirical Field o f Decomposition Analysis
2.3.1 The Aggregation Problem
A common problem is that it may not always be possible to find the input output data on a comparable basis for the benchmark years o f the study. Aggregation on a sectoral basis may be required to ensure comparability. There have been different approaches towards this problem \ In this study, Desai’s
(1969) method will be implemented. The method is characterized by the aggregation o f the row data;
(2.26) AX =
= (Z,X,"/IiZ/’)*(A( Z p,) + A( Z,Wj) + A( ZiE,)) + ((Z jX j'/z ,z/) - (Z ,x /’/z ,z ,”))· ( z z ; >
2.3.2 First Differences versus Deviations Measure for Decomposition
In section 2.2 several studies using either differences or deviations measures were reviewed. Deviations measure quantifies the deviation o f gross output from its proportional growth path in terms o f the causes’ deviations from their own paths. First differences measure takes the increments of the variables between the two benchmark years instead o f the deviations. In this study, the first differences measure will be used for the sources o f growth o f imports analysis.
2.3.3 Total versus Direct Decomposition Methods
Decomposition using the total method gives the effects o f the changes incorporating the indirect linkages via intermediate input flows. In direct decomposition, the interlinked nature o f the economy is ignored, changes in the demands for intermediates is treated as an independent component of sectoral demand. Direct measures are useful when analysing the behaviour of particular sectors^. The total decomposition method is used in the present study.
There is an index number problem implicit in decomposition analysis. The decomposition can be done by ‘terminal year structural coefficients and the initial year volume weights or by initial year structural coefficients and the terminal year volume weights’^. The two versions are analogus to the Paache and Laspeyres indices respectively. The averages o f the two decomposition results will be presented for this study.
2.3.4 The Index Number Problem
NOTES
1 llie notation of the reviewed papers are slightly changed with a common set of notation which is used throughout the chapter.
2 Chenery assumed that the import ratio m, is a function of the income and population size.
.3 The Leontief inverse is R=(I-A)' where I is the identity matrix and A is the matrix of input output coefficients.
4 2r,Am/-mj' )=GNP, (Er./mj^'/GNP^-m/ /GNP'))
5 Lewis and Soligo assume that the sum of the decomposition results at the sectoral level is representative for the aggregated level:
AX=EjAX,=Ej<(ADj+AW, +AEj) +Zj(u/-u“)Z/ 6 Chenery, Robinson and Syrquin (1986), p. 134 7 Ibid., p. 135
CHAPTER III
DOUBLE DEFLATION OF THE 1990 INPUT-OUTPUT TABLE
3.1 Introduction
The input-output (I-O) data compiled by the State Institute o f Statistics (SIS) are tabulated in nominal flows; the entries in the table show nominal payments (in producer’s prices) from a column account to a row account while ‘real’ goods flow from row to column accounts. To ensure comparability over time, it is necessary to derive the corresponding real flows from the nominal flows in the I-O tables.
W hen the relative prices in an economy change over time , the units o f the corresponding real magnitudes are no longer comparable. It is necessary to deflate the I-O tables over time so that the flows are expressed in constant domestic prices. Celasun (1983:134) notes that “The deflation o f current price I- O data to constant prices is essential under two sets o f circumstances: (i) if there were intersectoral differences in price movements, and/or (ii) if there were intrasectoral differences in the changes o f the production, import and export prices over time” .
A brief examination o f the Turkish price data for the years 1985 and 1990 reveals that the price increases and the changes in the import tariff rates in the economy were not uniform throughout the sectors . Hence it was necessary to construct price indices and to deflate the data in to constant 1985 prices.
Sections 3.2.1 and 3.2.2 describe the construction o f import and production price indices. The import price index PM and the production price index PX are used to construct a composite price index P (where PM, PX and P are vectors comprised o f the 1990 price index numbers o f the 9 sectors such that 1985=1), which is used to deflate intermediate and final demand. Section 3.3
describes the construction o f the composite price index and the double deflation procedure o f the 1990 I-O table.
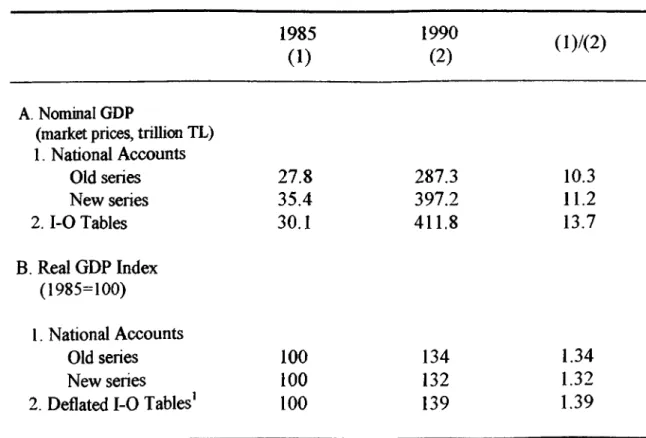
It should be noted at this point that one may check the validity o f the deflation o f the I-O tables (and hence the adequacy o f the constructed price indices), by comparing the GDP growth rate calculated using the value added figures o f the constant price (i.e. deflated) I-O tables, with those obtained from official statistics. This check was applied to the double deflation results o f the
1990 I-O table, the comparisons are presented in Appendix B.
3.2 The Construction o f Domestic Price Indices for Imports and Gross Output
The 1985 and 1990 I-O tables are originally on a 64x64 sector basis. Since price data are not available on such a detailed level, aggregation o f the tables was needed. The tables were aggregated to a 9x9 level to facilitate comparability with the Celasun (1983) and Yetkiner (1993) results. The aggregated 1985 and 1990 I-O Tables are presented in Table 3.1. The price indices were calculated for those 9 sectors. The aggregated sectors are demonstrated in Appendix A.
3.2.1 The Imports Price Index
Sectorally arranged import and export price indices are not readily computed and available for the Turkish economy. It is needed to make use o f different sources o f trade data to construct such indices. In this study, the Summary o f Monthly Foreign Trade Statistics o f SIS and the Yearbooks o f
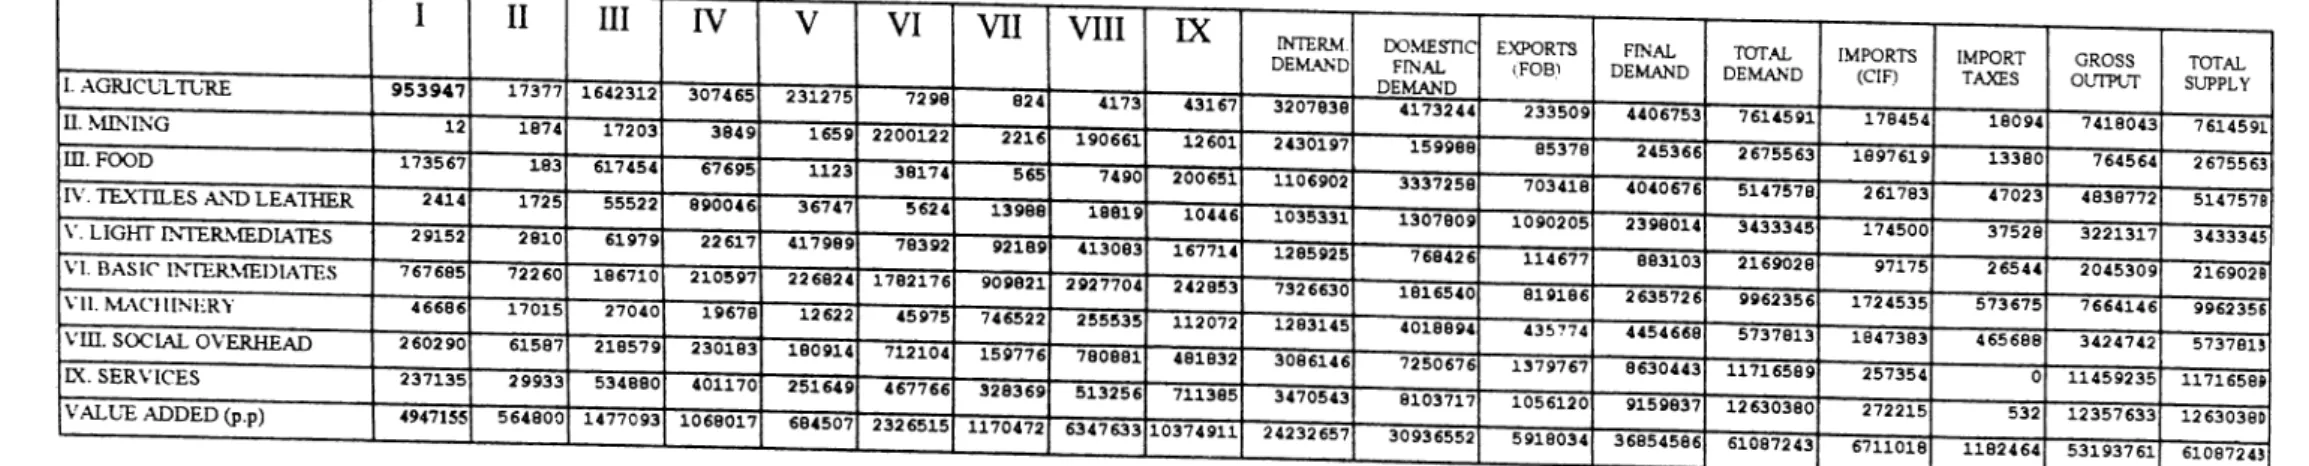
Table 3.1 1985 and 1990 I-O Tables at 9x9 Aggregated Level
1985 I-O Table at 9x9 Aegreeated Level
1990 I-O Table at 9x9 Aggregated Level
Note: The Domestic Final Demand figures are the summations of public and private consumption and investment. Source ; The 1985 and 1990 I-O Tables. SIS.
U.N. International Trade Statistics were used for this purpose. The exports price index PE, was assumed to be equal to the production price index PX. The steps taken to construct the imports price index are described below.
1) For the agriculture, mining, light intermediates, basic intermediates and machineiy sectors, the Summary o f Monthly Foreign Trade Statistics o f SIS for 1985 and 1990 were used. These publications provide trade data by ‘major sectors’ and by ‘commodity groups’. The imported quantities (in tons) as well as the corresponding payments (in 1000$) are given for these two categories in different tables'. The payments data were divided by the corresponding quantity data to obtain unit $ prices for all these sectors. The calculations are presented in Table 3.2.
Table 3.2 Calculation o f Unit $ Prices for Agriculture, Mining, Light Intermediates, Basic Intermediates and Machinery Sectors
1985 1990
Quantity Value Unit Price Quantity Value Unit Price
A G R I C U L T U R E 1253155 375288 299.5 3911330 1322944 338.2 M I N I N G 20737659 3626317 174.9 28265650 3989317 141.1 L I G H T I N T E R M E D I A T E S 31882378 7809565 244.9 45624719 13488981 295.6 B A S I C I N T E R M E D I A T E S 31882378 7809565 244.9 45624719 13488981 295.6 M A C H I N E R Y 553931 2655530 4794 439931 5068891 4800.8
Note: Quantities are measured in tons, values in 000$, and unit prices in $. Source ; Summary of Monthly Trade Statistics, 1985,1990, SIS.
2) For the textiles and leather and food sectors, an approach similar to those used by Celasun (1983) and Yetkiner (1993) was used. For each o f these sectors, certain commodities whose data are available in the Yearbooks o f U.N. International Trade Statistics (Turkey) were selected according to their relative weights (importance) in the total imports o f that sector. The unit $ price values for the commodities were computed again by dividing the payments (in 1000$) values to the quantities (in tons). Then a weighted average o f the commodity
prices were computed for each sector. The weight for a given commodity was the value o f payment for that commodity divided by the total payments to all the selected commodities in the sector“. These weighted averages for the textiles and leather, food sectors were used as the unit $ prices for those sectors. It was assumed that the price movements o f the most important commodities in a sector is representative o f the movement o f the price attributable to that sector. The calculations are presented in Table 3.3.
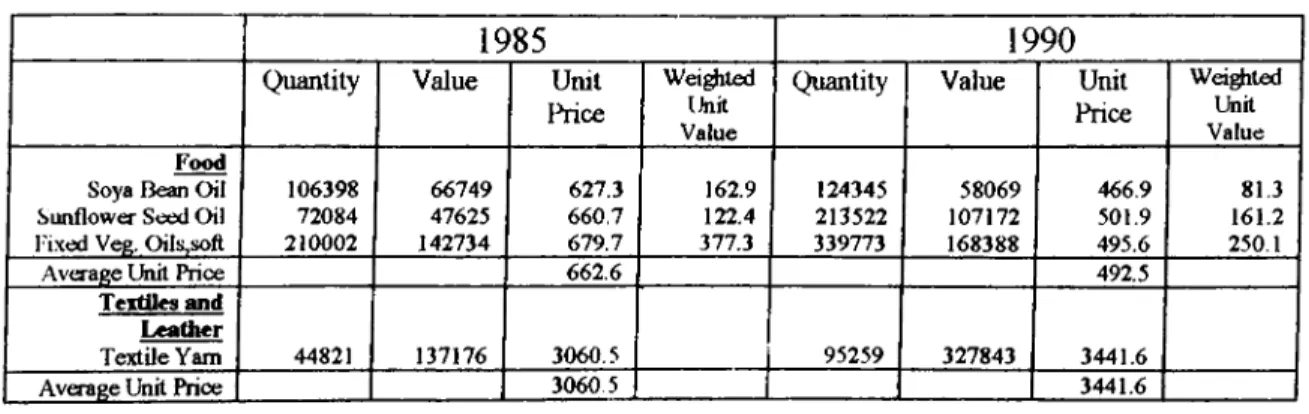
Table 3.3 Unit $ price Calculations for Food and Textiles Sectors
1985 1990
Quantity Value Unit IMce
W eighted Unit Value
Quantity Value Unit Price
W eighted Unit V alue
Food
Soya Bean Oil 106398 66749 627.3 162.9 124345 58069 466.9 81.3 Sunflow er Seed Oil 72084 47625 660.7 122.4 213522 107172 501.9 161.2 Fixed Veg. Oilissoft 210002 142734 679.7 377.3 339773 168388 495.6 250.1
Average Unit Price 662.6 492.5
Textiles and Leather
T extile Y am 44821 137176 3060.5 95259 327843 3441.6
A verage Unit Price 3060 5 3441.6
Source ; The calculations are based on the Yearbooks of U.N. International Trade Statistics (Turkey) 1985,1990.
3) As for the remaining two sectors; social overhead and services, arithmetic averages o f the textiles and leather, food, light intermediates and basic intermediates sectors were used assuming that their prices followed the trends in the non-food and non-petroleum sectors.
4) These unit $ prices for the 9 sectors were converted to Turkish Liras by multiplying them by the TL/$ exchange rates o f the benchmark years^, and the unit prices in TL were obtained.
5) The import price indices are used for the deflation o f the total imports, (imports plus the import tax payment values). Hence our import price indices should capture the variations in the import tax rates as well as the variations o f the ‘world prices’ o f imports. Following Celasun (1995), PMh, denotes the unit TL tax inclusive import price :
(3.1) PM ir 7iitERt(l+tmit)
where Hi, = world $ price o f sector i in year t ER,= TL/$ exchange rate in year t
tmit = import tax rate for sector i in year t i= 1..9, t = 1,2
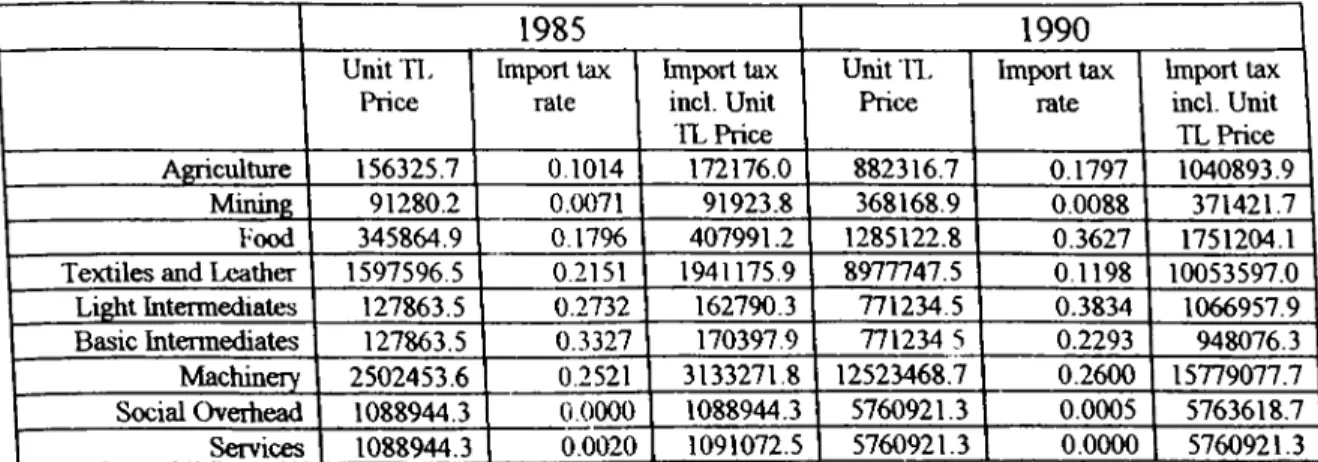
The realized import tax rates for any sector i is calculated by dividing the ith row entry o f the unport taxes column o f the I-O table by the ith row entry o f the imports column. These import tax rates computed for each year were multiplied by the unit TL price for each sector, and the final import tax inclusive unit TL prices were found for both years 1985 and 1990^. The computed import tax rates and tax inclusive unit TL prices are presented in Table 3.4.
The import price index is constructed by taking 1985 as the base year, that is by letting the import tax inclusive unit TL price for 1985 for all the 9 sectors to equal 1, and dividing the 1990 import tax inclusive unit TL prices by those o f 1985. The resulting import deflator (PM ) for 1990 are given in Table 3.5.
Table 3.4 Tax Inclusive Unit TL Import Prices 1985 1990 Unit n . Price Import tax rale Import tax incl. Unit TL Price Unit 11, Price Import tax rate Import tax incl. Unit TL Price Agriculture 156325.7 0.1014 172176.0 882316.7 0.1797 1040893.9 Mining 91280.2 0.0071 91923.8 368168.9 0.0088 371421.7 Food 345864.9 0.17% 407991.2 1285122.8 0.3627 1751204.1 Textiles and Leather 1597596.5 0.2151 1941175.9 8977747.5 0.1198 10053597.0 Light Intermediates 127863.5 0.2732 162790.3 771234.5 0.3834 1066957.9 Basic Intennediates 127863.5 0.3327 170397.9 771234 5 0.2293 948076.3 Machinery 2502453.6 0.2521 3133271.8 12523468.7 0.2600 15779077.7 Social Overhead 1088944.3 0.0000 1088944.3 5760921.3 0.0005 5763618.7 Services 1088944.3 0.0020 1091072.5 5760921.3 0.0000 5760921.3 Source; Unit TL prices were calculated as described in step 4. Import tax rates were calculated
using the 1985 and 19901-O Tables, SIS. Tax inclusive unit TL prices were calculated as described in step 5.
Table 3.5 The Domestic Import Price Index for 1990 (1985=1)
SECTORS IMPORT DEFLATORÎPM1
AGRICULTURE 6.04
MINIMG 40 4
FOOD 4.29
TEXTILES AND LEATHER 5.17
LIGHT INTERMEDIATES 6.55
BASIC INTERMEDIATES 5.55
MACHINERY 5.03
SOCIAL OVERHEAD 5.29
SERVICES 5.28
Source . The deflators are calculated using U.N. Intematicmal Trade Statistics and Summary of Monthly Foreign Trade Statistics, SIS.
The exchange rate index for 1990 w ith 1985=1 equals 5. Hence it can be seen from Table 3.5 that the relative domestic import prices for the food and m ining sectors declined between 1985 and 1990. The sharp decline in the m ining sector price w as due to the fall o f the oil price in the world between
1985 and 1990.
The production price index PX was used to deflate gross output (domestic production) and the exports. Two different indices were constructed as the production price index. The first one was based on the Wholesale Price Index (1981=1) o f SIS. A composite price index was computed (the procedure is described in section 3.3) and the 1990 I-O table was deflated using this WPI based index . The deflated 1990 I-O table (in 1985 prices) was used to calculate the GDP growth rate between 1985 and 1990. Since the calculated GDP growth rate (in 1985 prices) exceeded the official one substantially, the production price index based on the SIS WPI was not used.
The second production price index was constructed using the implicit GDP deflators which were calculated using the constant and current price New SIS series for Gross Domestic Product. The procedure for the construction o f the price indices is shown in Table 3.6. The average o f the agriculture and manufacturing prices were used for the food sector, whereas the manufacturing price index was used for deflating textiles and leather, light intermediates, basic intermediates and machinery sectors. The deflation based on the GDP deflator based price index was also checked for validity and proved to be acceptable, as clarified in Appendix B.
3.2.2 The Production Price Index
T ab le 3.6 Construction o f Production Price Index GDP-90 1990 PRICES 1987 PRICESGDP-90 (1987=1) GDP 1990 DEFLATOR 1985 PRICESGDP-85 GDP-85 1987 PRICES (1987=1) GDP 1985 DEFLATOR SUBSECTOR INDEX (1985=1) SECTOR INDEX (1985=1) AGRICULTURE 68692041 14176792 484.54 6910473 12669498 54.55 8.88 R RR MINING 6269186 1549911 404.48 560544 1258270 44.55 9.07 0.00 Q 07 MANUFACTURING 86307440 18729069 460.82 6406649 13418116 47.75 9.65 y ^ \ J / 9 65 SOCIAL OVERHEAD SUBSECTORS Electricity, Gas, Water Construction T ransportalion,Communication 7744703 24746455 46490154 2023154 5411439 10123335 382.80 457.30 459.24 636292 2051534 4460728 1232450 4272747 7651559 51.63 48.01 58.30 7.41 9.52 7.88 SERVICES SUBSECTORS Wholesale and Retail Trade Restaurants, Hotels Financial Inst., Insurance Personal and Professional Services Public Services Ownership of Dwellings 64800655 10111359 12659531 14415380 32525313 13218396 14421262 2447018 2496156 1926241 4018923 4615994 449.34 413.21 507.16 748.37 809.30 286.36 5830272 860232 779850 826775 1787838 2523679 10261613 1642207 2119580 1493330 3700082 4134030 56.81 52.39 36.80 55.37 48.32 61.05 7.90 7.88 13.78 13.52 16.75 4.70 O. J i 9.25 Note : Weighted averages of subsectors are used for Social Overhead and Services sectors.
Source: The New Gross National Product Series . SIS.
3.3 The Construction o f the Composite Price Index and the Deflation o f the 1990 I-O Table
After having obtained the domestic price indices for imports and production, PM and PX respectively, the composite price index P which will be used for deflating total supply (and total demand ) will be constructed, following the Celasun (1995) approach. In order to explain this procedure, we need to introduce some new notation. All the variables below are in constant
1985 prices.
aijt = the ij th entry o f the 1-0 coefficients matrix o f the t th year Xjj, - the ij th entry o f the I-O table o f the t th year
Xj, = the gross output o f the i th sector in year t
Dit = the domestic final demand in the i th sector in year t Hit = exports o f the i th sector in year t
Mit = imports o f the i th sector in year t TMit = import taxes o f the i th sector in year t
Qit = total domestic demand in the i th sector in year t Wit intermediate demand for the i th sector in year t MSi, = total imports (MSit = Mjt+ TM^)
where t =1,2 and i,j =1,2,..9. PX^, PEit, PMit are the prices o f Xit, En, MSn respectively, where PEjt is assumed to be equal to PXi,. Note t h a t .
(3.2) (3.3) (3.4)
^ijt ~ Xjt
Wi, = Ej aijtXjt = Ej Xijt
3.3.1 Construction o f the Composite Price Index
We can w nte our constant price material balance equation as follows
(3.5) Zj aijtXj, + Di,+ E„ - Mit- TMit = X,.
Letting (*) denote the current price values, the current price material balance can be written as :
(3.6) Zj flijt Xjt Ejt - Mil “ TMjt — Xit
where (3.7) (3.8) (3.9) (3.10)
MSi, - Mi, + TMi, = PMi, MSi, Eii* = PEitEi,
Xii* == PXiiX,i Qit “ PitQit
Pit = price o f Qi, (the composite price for sector i in year t)
The price indices PMit, PXi, and hence PEit (where PMit=PXi,=PEit=l for t= l) have already been computed. The first step now is to estimate the composite price Pit, i= l,..9 where P^ =1 for t=2. This can be done by dividing the total domestic demand in 1990; Qi2*, by Qi2, the total domestic demand in
1990 in constant 1985prices .We first determine Qi2 as follows.
(3.11) Qi2 = (Xi2^ / PXi2) - (Ei2* / PEi2) + (MSi2* / PM.2)
Now Pi2 can be obtained as;
(3.12) Pi2 = Qi//Qi2
The Composite Price Index is presented in Table 3.7
T ab le 3.7 The Composite Price Index for 1990 (1985=1)
SECTORS The ComDosite Price Index ÍP1
AGRICULTURE 8.75
MINING 5.18
FOOD 8.21
TEXTILES AND LEATHER 8.89
LIGHT INTERMEDIATES 9.29
BASIC INTERMEDIATES 8.06
MACHINERY 7.14
SOCIAL OVERHEAD 8.24
SERVICES 9.14
Source : The calculations are based on the 1985 and 1990 I-(J Tables (SIS) and the price indices PM and PX, calculated in sections 3.2.1 and '^ .2.2
3.3.2 The Double Deflation Procedure
Now as we have obtained the composite price index P, we may deflate the current 1990 I-O table in to 1985 constant prices.
• The technological (I-O) coefficients are deflated as follows :
(3.13) aij2 = aij2*(PXj2/P .2)
recalling that ajjt = (Xyt*/Pit)/(Xjt /PXjt) for t=2.
• The domestic final demand Di2 , exports E|2 and MSi2 in 1985 prices can be
found by deflating the corresponding values in current 1990 prices with their 1990 price index numbers:
(3.14) D i2-D ,2*/Pi2
(3.15) E|2=E|2 /PX|2 (3.16) MS|2 = MSiz’ / PMi2
• Xji can be determined in matrix form^
(3.17) Xi = [I-A ,r'[D ,+ E rM S J
The 1990 I-O table in 1985 producer’s prices is thus obtained and is displayed in Table 3.8. The 1990 GDP in 1985 producer’s prices can now be determined as^’ :
(3.18) GDP2 - Zj(Xj2( 1-Z,aij2)) = Zj(Dj2+Ej2-MSj2)
where (1-Ziaij2) equals the value added o f secto r) (including indirect taxes on
production and import taxes).
The comparison o f the GDP growth rate ( in 1985 producer’s prices) computed using the deflated 1990 I-O table and equation 3.18, and those given in the official statistics is presented in Appendix B.
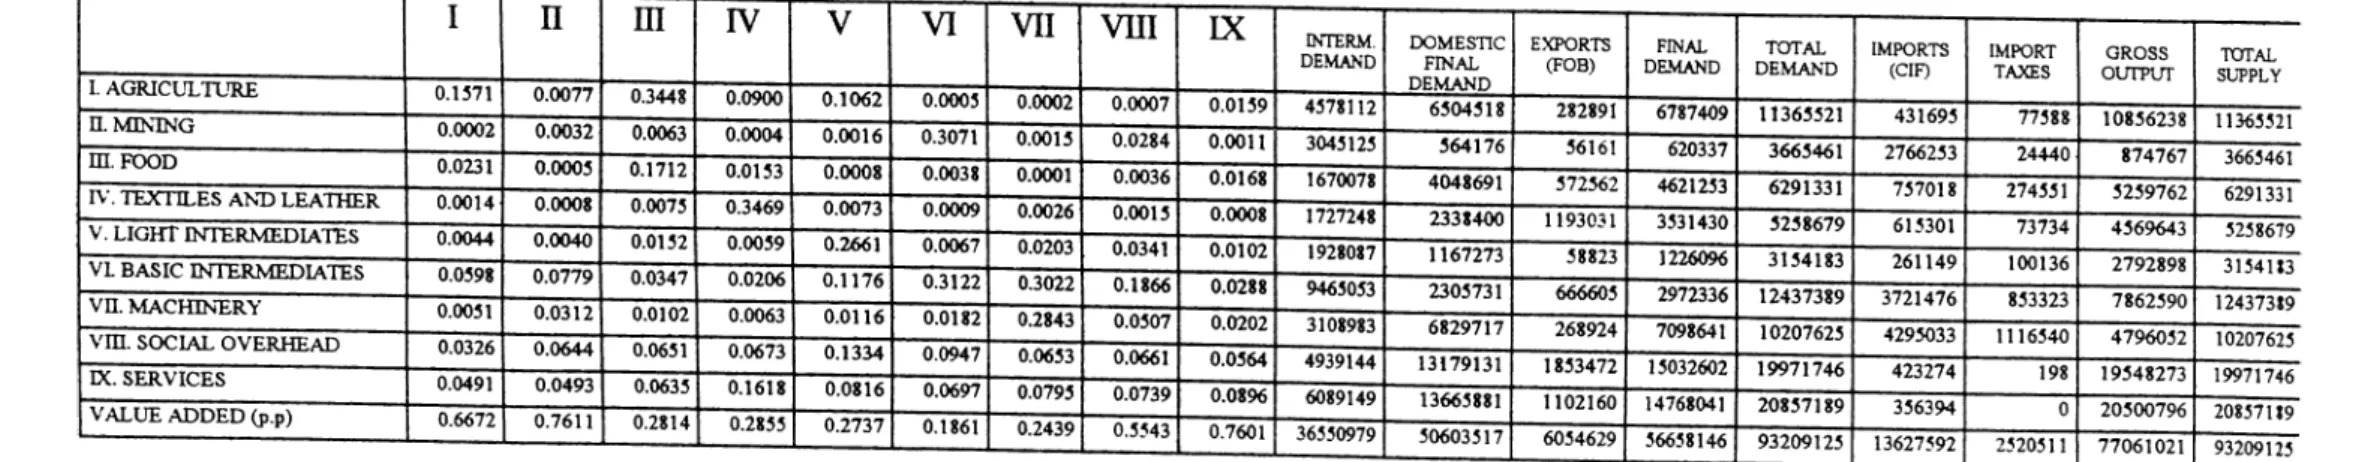
Table 3.8 Double Deflated 19 9 0 1-O Table Aggregated at 9x9 Level (In 1985 Prices)
Note; The first nine columns are comprised of the A matrix, and the value added rates S (1-a ) Source: Numerical results of the double deflation. ‘
NOTES
While agriculture and mining are given as ‘major sectors’, machinery is given under ‘commodity groups’ ; investment goods. The Raw Materials entry of the ‘commodity groups’ table was used for light and basic intermediates.
Celasun (1983) and Yetkiner (1993) use a more refined treatment of the weights or shares. They calculate the geometric averages of the commodity weights for the benchmark years and use those average shares when calculating the unit prices.
The average TL/$ exchange rates for the years 1985 and 1990 were found fi'om the U.N. International Financial Statistics, 1990. The rate was 522.0 TL/S for 1985 and 2,608.6 TL/$ for
1990.
Letting Mi, and TMi, denote the i th sector entry of the import and import tax columns of the I-O table of year t, the import tax rates are found as tmi,= TM«/ Mj,. Then the import tax inclusive import prices are calculated 1^ multiplying the unit TL prices found in step 4 by (1+ tm«). Gross output Xi2 can also be determined as Xq = Xc / PXi2
The GDP in market prices is ;
GDP, = Zj(Xj2(l-Z.a.,2)) + ZjTMp = I,(D,2+Ep-M,2)
CHAPTER IV
DECOMPOSITION RESULTS AND THE SOURCES OF IMPORT GROWTH ANALYSIS 4.1 Introduction
In this chapter, the 1985 I-O table and the double deflated 1990 I-O table in constant 1985 prices are used to decompose the import growth between 1985 and 1990 into four sources: domestic demand expansion, export expansion, import substitution, and technological change. It is seen that the results differ widely from those pertaining to the 1979-85 period. While domestic demand expansion became the most important factor, export expansion did not contribute to the growth o f imports positively between 1985 and 1990.
The decomposition results are stated in section 4.2. In section 4.3 an overview o f the economic conditions in Turkey between 1985 and 1990 is presented and the results o f the analysis are evaluated in this context. Section 4.4 concludes.
4.2 Sources o f Import Growth Between 1985 and 1990
The change in imports in 1985-90 (in constant 1985 prices) were decomposed following the Syrquin (1976) first difference approach, as presesented in Celasun (1983:146-7). The equations used and the derivations are provided in Appendix C.
The total contribution o f the expansion o f domestic demand (DDE) was 60.95 percent between 1985 and 1990. The contributions o f export expansion, import substitution and technological change were -0.51, 29.06 and 10.49 percent respectively. The results are tabulated in Table 4.1, together with the
T A B L E 4.1 Sources o f Import Growth (Total M ethod)
a<S'up
10 “ “ · TC conlribulionaf t S “meth!d).·” *»"' Y®“ ”" <1««) 1985-1990 figures are results ortho decomposttion analysis
estimates for the periods 1963-73 (Celasun,1983) and 1979-85 (Yetkiner, 1993), to facilitate comparability.
The growth o f manufacturing imports (i.e. food, textiles and leather,light intermediates, basic intermediates and machinery) account for 82 percent o f the total growth o f imports in 1985-90. Among all the manufacturing sectors, the growth o f imports are highest in the basic intermediates and machinery sectors; growth o f imports in these two sectors account for 28.8 and 36.6 percent o f the overall increase in imports respectively.
Domestic demand expansion was the most important source o f import growth in the 1963-73 period, but lost its relative prominence between 1979 and 1985. In the 1985-90 period however, it became the most important contributor again. An important shift is seen in the mining sector. The contribution o f DDE was 20.3 percent in the 1979-85 period, but it became 122.3 during the 1985-90 period, due to the drastic increase o f demand in the mining sector. DDE became a positively contributing factor in the textiles and leather sector between 1985 and 1990, probably because o f an increase in the disposable income o f the consumers during that period compared to the previous one. The weight o f DDE is very large in the social overhead and services sectors as well; 108.7 and 166.6 percent o f the increase in imports in these sectors were attributable to DDE.
The 1980-1987 period was characterized by a strong export growth. The contribution o f EE to import growth was 12 percent between 1979 and 1985, showing increased import intensity in intermediates for exported goods. The positive trend in EE did not extend to the 1985-90 period. The change in the economic conditions, as explained in section 4.3, led to a decline in exports especially after 1988. The largest positive contribution o f EE was in the textiles and leather sector. Tariff concessions on imported intermediates for the exported goods led to an increase in imported inputs during that period, but the further increase in imports between 1985 and 1990 did not have much to do with export growth.
IS became a positively contributing factor after the import substitution policies were abandoned in 1979. The contribution o f IS was most important after the change o f policy; in the 1979-85 period it accounted for 63.4 percent o f the total growth o f imports. IS continued to be an important factor in the 1985-90 period as well. The contribution o f IS in the basic intermediates sector was negative in 1979-85, but increased substantially to 47.2 percent afterwards. The weight o f IS is as high as 40.8 percent for the overall manufacturing sector between 1985 and 1990, showing that import penetration continued to be an important factor in the later stages o f trade liberalization.
Technological change was an insignificant source o f import growth between 1979 and 1985. The contribution o f TC became quite significant during 1985-90. The contribution o f TC stayed approximately the same for mining, food and textiles and leathers sectors, but increased in all the remaining sectors. The increases are particularly in agriculture, machinery and the non- tradeable sectors. The technological changes in those sectors were in a manner that contributed to the growth o f imports.
4.3 An Overview o f the Turkish Economy in 1985-90
The 1978-1980 debt crisis marked the end o f the inward orientation o f the Turkish economy and hence the import substitution motive in trade regimes. The 1980-83 period under military rule was characterized by economic stabilization and trade liberalization at the same time. Real exchange rate depreciation and export promoting policies led to strong export growth. Restrictive wage policies enhanced saving mainly in the public sector, curbed domestic absorption, and hence helped promoting export expansion. The real depreciation o f the TL and the repression o f real wages m the Turkish economy continued during the 1984-87 period o f civilian administration, and supported the trade reform s o f the period.
The trade policies implemented by Turkey were liberalized substantially after 1980. Nominal and effective protection rates, and the variance o f
protection rates among industries were reduced, quantity restrictions on imported goods were abandoned, subsidies were reduced after 1985 and the anti-export bias in the trade regime was removed. (Togan, 1993; 285) Export promotion and realistic exchange rates were two important features o f the post 1980 adjustment program. The TL was devaluated 48.6 percent against the US$ in 1980. The average annual rate o f real depreciation was about 4 percent between 1981 and 1987, showing that the policy o f real exhange rate depreciation was retained during that period. This led to a strong export growth during the same period, and also kept the growth o f imports under control.
The growth o f exports improved the balance o f payments and compensated for the reduced domestic demand after the 1978-80 debt crisis. Incentives to promote exports were tax rebates, credit subsidies, foreign exchange allocations that allowed for duty-free imports o f intermediates and raw materials. (Baysan and Blitzer, 1990: 13)
Imports were liberalized gradually, mainly after 1983, when almost all consumer goods were liberalized. Yet the tariff rates on consumer goods were increased. The reverse applied to capital goods. As for intermediates, both measures o f protection were eased. Direct import controls were removed in
1984, and the “positive list” for imports was replaced with a “negative list” , fti 1985, the list o f prohibited imports contained only three items. The nominal tariff rates were lowered substantially in 1989. The liberalization process went on until 1990, when all quantity and price restrictions on imports were removed.
The 1989-90 period was characterized by capital account liberalization; capital flows were liberalized in the external accounts. This reversed the major exchange rate trends that prevailed in the Turkish economy between 1981 and 1987. The cumulative appreciation o f the real exchange rate amounted to no less than 20 percent during 1988-89. The liberalization o f capital flows increased the real interest rates as well. The 1989 tariff reductions combined with the currency appreciation led to an import boom and deteriorated the trade balance in 1990*.
Real wage repression, a politically unsustainable aspect o f macroeconomic adjustment and stabilization in 1981-87, could not be sustained after the 1987 elections. The real wage recovery was rapid, the 1988-89 period saw a sharp increase in the real wage. The wage increase between 1988 and 1989 was 129 percent in the private, and 188 percent in the public sector. The increase in the public sector wage bill was a ftirther strain on the public sector, which was already burdened by the debt repayments after 1985. Celasun and Arslan (1992) note that the domestic demand growth following the wage recovery was an important factor in the import explosion o f 1990.
In 1986, the oil price decreased substantially, which had implications for both the imports and exports o f Turkey. Upon the fall in the oil price, exports declined by 8 percent in a year, due to the contraction o f demand by oil exporting Iraq and Iran, the major purchasers o f Turkish exports. At the same time, imports decreased by 5 percent, due to the fall in the dollar value o f the oil bill. However, this enabled an increase o f imports in other categories, in the following years.
The main trends in the Turkish economy were not uniform throughout 1985-90. The 1988 reversal in the real exchange rate and real wage trends combined with lowered tariffs promoted strong import penetration . Concurrent expansion o f aggregate domestic demand explain the substantial real growth o f imports between the benchmark years o f our study 1985 and 1990. Domestic demand expansion which accounts for about 60 percent o f the growth according to our analysis, was a major drive in the import boom particularly after 1988. The approximately 30 percent attributed to IS shows the negative import substitution response to liberalization and declined import prices . The policy changes after 1988 which were in favor o f import growth may be considered to be responsible for generating the reverse effects on exports. The real decline o f exports during 1985-90 did not contribute to the growth o f imports positively. On the contrary, imported intermediates for exported goods declined, following the trend in exports. Changes in the interindustry flows contributed significantly to the import growth as well. The 10 percent
contribution o f technological change shows that the weight o f imports in overall intermediates increased. The sectoral figures for the change in domestic demand, exports, import ratios and the 1-0 (technological) coefficients are given in Appendix D.
4.4 Conclusion
The 1985-90 period saw a great deal o f policy reversals and fluctuations in relative prices in the Turkish economy. Against this background, imports grew substantially in real terms between 1985 and 1990, marking the start o f the deterioration o f the trade balance, a process which continued well into the
1990s. The results o f the decomposition analysis o f the sources of import growth in 1985-90 are consistent with the broad conditions in the Turkish economy during the same period.
Export expansion, the success story o f Turkish economic performance in the first half o f the 80s, had gone through structural change during 1979-85, and become an important causal factor in import growth dining that period^. O ur results show that the rather modest expansion o f exports in most sectors in
1985-90 was an insignificant source o f import growth.
Domestic demand expansion, a major cause o f output growth after 1988, w as an important source o f import growth between 1985 and 1990. Especially in those sectors with greatest shares o f import growth; mining,basic intermediates and machinery (these sectors accounted for 11, 29 and 37 percent o f the total growth o f real imports in 1985-90 respectively) the domestic demand effect w as strongest. DDE accounted for 122, 55 and 58 percent o f the growth o f imports in these sectors.
Import substitution was a positively conributing factor in 1985-90. The contribution o f IS is highest (81 percent) in the food industry, which represented 8 percent o f the growth o f imports. The result reveals that import penetration maintained its importance in the later stages o f trade liberalization, as it did (to a greater extent) in the earlier period o f 1980-85.
Changes in the technological coefficients regained importance as a source o f import growth and explained 10 percent o f the change in imports. This shows that technological change took place in a manner that increased the weight o f imports in intermediate flows. The contribution of TC is most significant in the mining and machinery sectors.
NOTES
1 The reductions in the tariff rates after 1988 were part of a program aiming to fight inflation. (Uygur, 1992:20)
2 Yetkiner (1993:35)
REFERENCES
Arslan, i., and Celasun, M. (1992). “Sustainability of Industrial Exporting in a Liberalizing Economy : The Turkish Experience”, in Helleiner G. K. (Ed.) (1995) Manufacturing for Export in the Developing World; Problems and Possibilities. London: Rouletge.
Baysan, T., and Blitzer, C. (1990). “Turkey’s Trade Liberalization in the 1980s and Prospects for its Sustainability,” in Ancanli, T. And Rodrik, D. (Eds) (1990) The Political Economy of Turkey. London; The Macmillan Press LTD
Chenery, H.B. (1960). “Patterns of Industrial Growth,” American Economic Review. Vol. 50, No.2, pp.624-54.
___________ , Shishido, S., and Watanabe, T. (1962). “The Pattern of Japanese Growth, 1914-1954.” Econometrica. Vol.30, No.l, pp.98-139.
______, Robinson, S., and Syrquin, M. (1986). Industrialization and Growth: A Comparative Study. Oxford University Press.
______, Syquin, M., (1977). “A Comparative Analysis of Industrial Growth,’ paper presented at “The 5 th World Congress of the International Economic Association on Economic Growth and Resources, Tokyo, August-September,
1977.
Celasun, M. (1983). Sources of Industrial Growth and Structural Change: The Case of Turkey. Washington, D C ., World Bank Staff Working Papers No 614.
__________, (1994). “Trade and Industrialization in Turkey: Initial Conditions, Policy and Performance in the 1980s”, in Helleiner, G. K. (Ed.) (1994) Trade Policy and Industrialization in Turbulent Times. London ; Rouletge.
____, (1995). “Notes on I-O Deflation”, Unpublished.
Desai, P., (1969). “Alternative Measures of Import Substitution,” Oxford Economic Review. Vol.21, No.,3, pp.312-24.
Eysenbach, M.L. (1969). “A Note on Growth and Structural Change in Pakistan’s Manufacturing Industry, 1954-1964,” Pakistan Development Review. Vol.9, Spring, pp.58-65.
Hatiboglu, Z. (1995). Economic Theory and the Turkish Experience Istanbul: Literatür Yayıncılık.
Kubo, Y. (1985). “A Cross-country Comparison of Interindustry Linkages and the Role of Imported Intermediate Inputs,” World Development. Vol. 13,No. 12, pp. 1287-1298.
________, and Robinson, S. (1984). “Sources of Industrial Growth and Structural Change: A Comparative Analysis of Eight Countries,” Proceedings of the Seventh International Conference on Input-Output Techniques, United Nations, New York, pp.233-54.
Lewis, S.R.Jr. and Soligo R. (1965). “Growth and Structural Change in Pakistan’s Manufacturing Industry, 1954-1964,” Pakistan Development Review. Vol.5, Spnng, pp.94-139.
Morley, S.A. and Smith, G.W. (1970). “On the Measurement of Import Substitution,” American Economic Review. Vol.60,No.4, November, pp.728-35.
State Institute of Statistics (SIS). (1989). “Input-Output Table, 1985”, (in both Turkish and English). Ankara.
State Institute of Statistics (SIS). (1994). “Input-Output Table, 1990”, (in both Turkish and English). Ankara.
State Institute of Statistics (SIS). (1994). “Gross National Product, Concepts, Methods and Sources”, Publication No. 1710, Ankara.
State Institute of Statistics (SIS). “Statistical Yearbook of Turkey, 1993”, Ankara. State Institute of Statistics (SIS). “Summary of Monthly Foreign Trade: 1985”,
Ankara.
State Institute of Statistics (SIS). “Summary of Monthly Foreign Trade: 1990”, Ankara.
Syrquin, M. (1976). “Sources of Industrial Growth and Change: An Alternative Measure,” World Bank.
Togan, S. (1993). 1980’h Yıllarda Türk Dış Ticaret Reiimi ve Dış Ticaretin I iheralizasvonu. Türk Eximbank Araştırma Dizisi 1.
United Nations. International Financial Statistics, 1990.
United Nations. Yearbook of International Trade Statistics, 1988. United Nations. Yearbook of International Trade Statistics, 1990.
Uygur, E. (1993). Financial Liberalization and Economic Performance in Turkey. Ankara : Türkiye Cumhuriyeti Merkez Bankası.
Yetkiner, İ H. (1993) “Decomposition Analysis of Sources of Growth of Imports of Turkey in 1979-85,” Master’s Thesis.