Digital holographic microscopy of
phase separation in multicomponent
lipid membranes
Vahideh Farzam Rad
Ali-Reza Moradi
Ahmad Darudi
Lobat Tayebi
Vahideh Farzam Rad, Ali-Reza Moradi, Ahmad Darudi, Lobat Tayebi,“Digital holographic microscopy of ” J. Biomed. Opt. 21(12), 126016 (2016),
Digital holographic microscopy of phase separation
in multicomponent lipid membranes
Vahideh Farzam Rad,aAli-Reza Moradi,a,b,c,* Ahmad Darudi,a,band Lobat Tayebid,e
aUniversity of Zanjan, Department of Physics, Zanjan 45195-313, Iran
bOptics Research Center, Institute for Advanced Studies in Basic Sciences, Zanjan 45137-66731, Iran cBilkent University, Department of Physics, Cankaya, Ankara 06800, Turkey
dMarquette University, School of Dentistry, Milwaukee, Wisconsin 53233, United States eUniversity of Oxford, Department of Engineering Science, Oxford OX1 3PJ, United Kingdom
Abstract. Lateral in-homogeneities in lipid compositions cause microdomains formation and change in the physical properties of biological membranes. With the presence of cholesterol and mixed species of lipids, phospholipid membranes segregate into lateral domains of liquid-ordered and liquid-disordered phases. Coupling of two-dimensional intralayer phase separations and interlayer liquid-crystalline ordering in multi-component membranes has been previously demonstrated. By the use of digital holographic microscopy (DHMicroscopy), we quantitatively analyzed the volumetric dynamical behavior of such membranes. The spec-imens are lipid mixtures composed of sphingomyelin, cholesterol, and unsaturated phospholipid, 1,2-dioleoyl-sn-glycero-3-phosphocholine. DHMicroscopy in a transmission mode is an effective tool for quantitative visu-alization of phase objects. By deriving the associated phase changes, three-dimensional information on the morphology variation of lipid stacks at arbitrary time scales is obtained. Moreover, the thickness distribution of the object at demanded axial planes can be obtained by numerical focusing. Our results show that the volume evolution of lipid domains follows approximately the same universal growth law of previously reported area evo-lution. However, the thickness of the domains does not alter significantly by time; therefore, the volume evolution is mostly attributed to the changes in area dynamics. These results might be useful in the field of membrane-based functional materials.© 2016 Society of Photo-Optical Instrumentation Engineers (SPIE) [DOI:10.1117/1.JBO.21.12.126016]
Keywords: digital holographic microscopy; multicomponent lipids; phase separation; long range alignment. Paper 160320R received May 19, 2016; accepted for publication Nov. 29, 2016; published online Dec. 22, 2016.
Epidemiology of several important human diseases, such as ath-erosclerosis, Alzheimer’s disease, and cancer, contains a lipid component.1–3Moreover, it is known that the lipid composition of membranes and membrane–protein adsorption mechanisms are connected, and this connection affects the intermembrane spacing and adhesion and has direct effect on demyelinating diseases such as multiple sclerosis.4In general, information on the structure of membranes including the dynamic organization across the lipid bilayer and in the lateral dimension to create unique composition of lipids with multiple functionalities have been of particular importance for biochemical and bio-physical investigations.5–7
Smectic liquid-crystalline (LC) order is spontaneously created in multilamellae stacked lipids, as lyotropic materials, through hydrophobic forces of lipid–water interactions.8–10 Moreover, these materials show long-ranged orientation order in the pres-ence of a solvent in LC phases.11In smectic mesophases materi-als, including multilamellae stacked lipids, in-plane translational degrees of freedom are allowed, but their out-of-plane undulatory fluctuations are impeded due to their confinement by the near-located layers.11–13One-dimensional smectic order lipidic meso-phases can be stabilized by losing entropy through Helfrich intermembrane repulsive interactions.14
Studies on ordering mechanisms of such membrane multila-mellae find useful applications in the field of membrane-based functional materials. Functional membranes offer innumerable
possible applications such as pharmaceutical purification processes,15,16organic solvent filtration,17sustainable energy production,18 and high-performance filtration under harsh conditions.19,20 Functional multilamellae membranes can be resembled by a multicomponent mixture of lipids and proteins, which contains coexisting phases from facile phase separations.11In these membranes, two-dimensional (2-D) intra-layer phase separation of lipids and proteins in individual mem-brane lamellae can be combined with the interlayer smectic ordering, which leads to arranged functional components across membrane lamellae in a self-organized manner.11,21Higher order organization in multilayered membranes has been observed by conventional wide-field epifluorescence microscopy.11
In this paper, a quantitative study on volumetric dynamics of multilamellar multicomponent membranes is considered. We used digital holographic microscopy (DHMicroscopy) to evalu-ate thickness, surface area, and volume of the domains extracted from phase separation in multicomponent lipids versus time. DHMicroscopy is a nondestructive and marker-free imaging technique suitable for three-dimensional (3-D) visualization of phase objects.22–27 The interference pattern of a coherent beam passing through the object with a reference beam from the same source forms a hologram on a digital camera. The reconstruction process toward acquiring a 3-D image of the object is performed by numerical reconstruction of the digital holograms by a computer.28–31
The samples we used for membrane multilamellae are nonuni-form systems consisting of more than a single lipid. They are lipid mixtures composed of cholesterol (Chol), sphingomyelin (SM), and unsaturated phospholipid, 1,2-dioleoyl-sn-glycero-3-phos-phocholine (DOPC), as putative raft-forming ternary. This kind of rafts or domains in biomembranes is used for signaling activ-ities. For example, ion channels are localized in liquid-ordered (Lo) domains and the alignment of domains also aligns the ion channels. The alignment of domains across several bilayers may be used for coupling of the functionality of single bilayers. We purchased the lipids in powder type from Avanti, and chloro-form was used as the solvent. Clean and dry glass slides were used during the experiments. Droplets with the volume of 1 to 3 μl of the solution were put on a glass plate. The samples were kept in a vacuum overnight for chloroform evaporation
and then were incubated at 50°C to 60°C in a humid environment with relative humidity of 98% for 48 to 72 h. For each experi-ment, by fast immersion of dried plaques of multilamellar lipids in deionized bulk water, the phase separating regime was achieved from quenching the high temperature of the homogeneous phase. The whole process was observed using a DHMicroscopy setup in which a laser beam illuminates the object and the magnification is provided by the microscope objective lens and imaging lens combination. The DHMicroscopy setup is based on Mach–Zehnder geometry to allow off-axis hologra-phy of a transparent sample, as shown schematically in Fig.1. On the same setup, a conventional homemade inverted micro-scope was built; it consists of a white light illumination source (KL1500 compact, Olympus), condenser (C, NA 1.25, Olympus), microscope objective (MO1, 40×, NA 0.65, WD 0.17 mm, Olympus), and the camera (DCC1545M, Thorlabs, 8-bit dynamic range, 5.2-μm pixel pitch). The samples were observed through the microscope to adjust the best focus before the holography experiments. Laser light emitted from a He–Ne laser (MEOS, 632.8 nm, 5 mW) is expanded by a beam expander and is split into object wave and reference wave by a beam splitter (BS1). The reference beam is sent to the camera through mirror M1, a similar microscope objective (MO2), which was used to adjust the beam curvature, and a beam splitter (BS2). The refer-ence beam is focused at a point conjugate to the back focal plane of the objective lens so that it arrives at the detector plane with the same wave front curvature as the object wave. Digital holograms that are formed by the interference pattern of the two beams have 3-D information of the sample under study. The numerical reconstruction process is performed by simulating the diffraction from the digital hologram when illuminated by the reference wave. Previously, we have utilized similar DHMicroscopy setups and also self-referencing DHMicroscopy scheme for 3-D imaging Laser BS1 M1 C S MO1 MO2 BS2 Camera NDF M2
Fig. 1 Schematic DHMicroscopy setup based on Mach–Zehnder configuration.
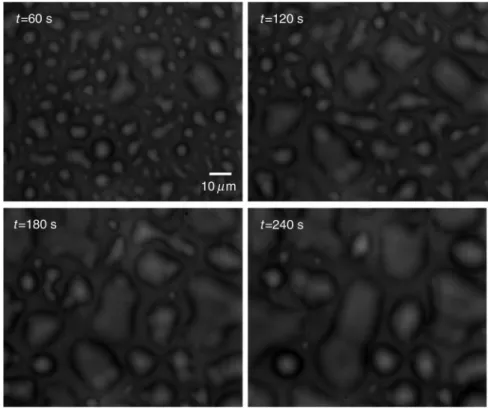
Fig. 2 Bright-field images of phase separation in stacked lipid mixture, consisting of equimolar propor-tions of DOPC and SM, and 30% of Chol immersed in bulk water. Domain evolution is shown for various times after immersion.
and investigating lipids.32–34In Ref.32, the effect of thermal gra-dient on multilamellar cylindrical tubes of membrane lipids, which are called myelin figures, has been investigated. In Ref.33, we have shown the lipid resource humidifying impact on the growth control of myelin figures. In Ref.34, we have used a common-path self-referencing DHMicroscopy arrange-ment coupled to a fiber optical trapping system to induce mor-phological changes on lipid membranes by the forces applied by an optical fiber with an enhanced numerical aperture.
In our experiments, we recorded the holograms of the sam-ples of multicomponent lipids by a Mach–Zehnder-based DHMicroscopy setup. The holograms were recorded in video format and were converted into image sequences for post-processing. The lipid mixtures are phase-separated into two
coexisting liquid phases below their miscibility transition tem-perature. One of the phases is enriched in Chol and SM, designated as the Lo phase, and the other is the liquid-disordered (Ld) phase consisting primarily of unsaturated DOPC.11,35Since the incubation of the lipids were performed in the range of 50°C and 60°C, and this range is above the miscibility transition temperatures of the lipid mixtures, the separated domains are not formed during the incubation.
Phase-separated domains in individual layers of multilamel-lar membrane stacks align with one another, spontaneously pro-ducing 3-D aligned domains across hundreds of lamellae.11 Figure 2 shows a selected set of frames from conventional microscopy imaging of examination of the domain formation and domain surface size evolution, immediately after immersing
50% Chol 60% Chol
20 µ m
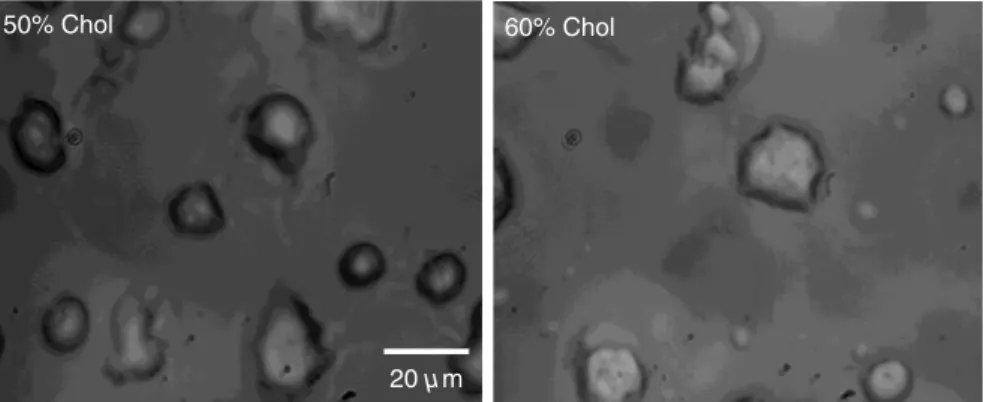
Fig. 3 Up to 40% of Chol concentrations coexisting Lo and Ld phases were observed. However, in com-position with 50% and 60% concentrations of Chol, materials appear as crystals, as shown in these figures.
Fig. 4 Hologram of a lipid mixture sample when the domains are formed and associated reference holo-grams. A smaller region of interest for both holograms is shown in the lower panel to demonstrate the holographic intehreference patten formation and fringe inclination changes.
the multilamellar lipids cakes in bulk water. The lipid mixture consists of equimolar proportions of DOPC and SM and 30% of Chol. We have also shown that in higher Chol concentrations the domain alignment process is substantially reduced, and in more than 40% concentrations, the domains turn to appear as crystals, as shown in Fig.3.
However, toward a better examination of interlamellar domain alignment and phase separation in multicomponent lip-ids, we utilized DHMicroscopy and investigated the thickness profile of samples. This, in turn, provides quantitative volumet-ric information on the evolution of the formed domains and alignment process. In Fig.4, a digital hologram of a lipid mix-ture sample when the domains are formed and the associated reference holograms are shown. Smaller regions of interest for both holograms are shown in the lower panel of Fig.4; it demonstrates the holographic interference pattern formation and fringe inclination changes. We record reference holograms in which no lipid sample is presented to remove the background contaminations from the sample container and the fluid for every sample. This ensures that the phase changes in various times in the domain evolution process are only due to its growth. The recorded holograms are subjected to numerical reconstruction. The reconstruction process is performed by simulating the diffraction from the digital hologram when
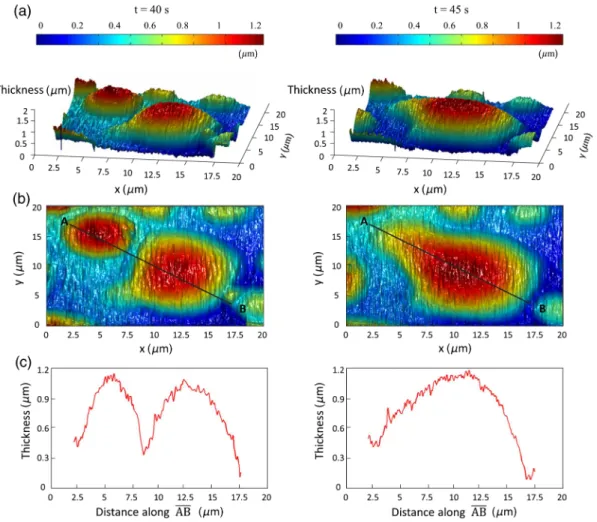
illuminated by the reference wave. We utilized the angular spec-trum propagation approach in scalar diffraction theory for numerical reconstruction of the holograms.28–31 The phase and intensity of the reconstructed wavefront can be computed by the ratio of imaginary and real parts, and the squared absolute value of the derived complex amplitude, respectively. The objects under study in our case are almost transparent; hence, we are interested in measurement of phase changes during the experiments. According to the dynamics speed of the phe-nomenon, we recorded holographic movies with a rate of 5 frames∕s in various states of domain formation and evolution. Figure5shows the reconstruction results for typical domain evolution that we have observed in multicomponent lipid samples. The holograms are in left and right panels belong tot ¼ 40 s and t ¼ 45 s after immersing the lipid cake in bulk water, respectively. The two formed domains att ¼ 40 s join together to form a big-ger one att ¼ 45 s. In Figs.5(a)–5(c), different illustrations of the phase information from the DHMicroscopy reconstruction are shown. Assuming negligible changes for the refractive index, the thickness at each point can be calculated from the phase map. A 3-D map of thickness of the domains in the two chosen times is shown in Fig.5(a). A vertical view (2-D map) of the two recon-structed images is shown in Fig.5(b). As can be seen, the phase of the domain and the rest of the field of view have different
Fig. 5 Reconstructed holographic images of domain formation in multicomponent lipid samples att ¼ 40 s and 45 s after the formation starts: (a) 3-D thickness of the domains, (b) 2-D thickness map, and (c) cross sectional profile along the (AB) line indicated on the 2-D images in panel (b). Information such as volume, surface, and thickness of the domains can be derived from the reconstruction of holograms. A field of view of about20 μm × 20 μm from the recoreded holograms was selected for measurements. Farzam Rad et al.: Digital holographic microscopy of phase separation in multicomponent lipid membranes
value ranges. By a simple Red-Green-Blue to binary transforma-tion of the map, the surface covered by any domain can be calcu-lated. The cross sectional thickness profile along any arbitrary line (like AB) across the lipid can also be calculated, as shown in Fig.5(c).
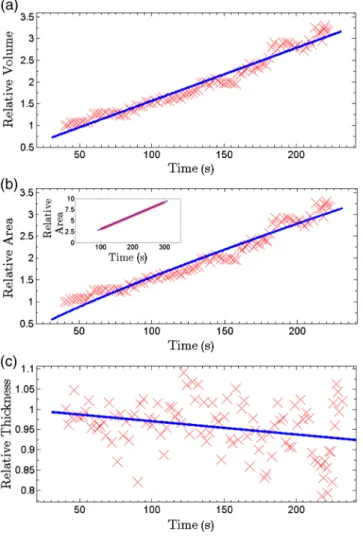
For each frame of the recorded movies, we have recon-structed the holograms, counted the number of formed domains, and calculated the surface, thickness, and volume of the domains. The average volume, surface, and thickness are calcu-lated by averaging the values among all the domains in the field of view of each frame. The thickness is the mean value of the averaged domain thickness. These values are reported and shown in Fig.6. Figures6(a)–6(c)are the evolution of the vol-ume, surface, and thickness of domains, respectively, for 4 min after the experiment is started. In the inset of Fig.6(b), a similar evolution curve for the covered surface by domains, which is obtained from conventional microscopy image analysis, is shown.
The temporal evolution of circular domain size (average area) in single lipid monolayers or bilayers follows the universal growth law ast2n.36According to classical diffusion, the limited growthn < 1∕3. It has been proven that in membrane multilamel-lae the domain growth also follows the universal growth law.11 However, in this case, the growth exponent varies between 1∕3 and 1∕2. The higher exponents suggest that the domain growth involves additional contributions beyond diffusional dynamics, such as the domain–domain coalescence as shown for a typical sample in Fig.5. The coalescence-driven domain growth results from an interplay between lateral phase separation and interlamellar smectic coupling unique to membrane multilamellae.11Accordingly, we have fitted the universal growth law for the all extracted sizes of domains including volume, area, and thickness. As shown in Fig.6, the growth of domain volume and area follows similar behavior. For a typical sample after averaging all the analyzed domains of the holograms, we found that volume and area varies as hvi ¼ 0.0518t0.7406 and hai ¼ 0.0402t0.7963, respectively. The growth component for
area evolution is iconsistent with the results of bright field micros-copy analysis, as shown in the inset of Fig.6(b). However, we have observed that even if the volume of domains follows the universal growth law, as shown in Fig.6(c), the change in volume should be attributed mostly to the changes in area of the domains, and the average thickness of the domains does not have a sub-stantial variation versus time. Yet, for several cases, the thickness can be reduced even at longer times after the experiment is started, which explains the difference between volume and area exponents.
The evolution of the domain sizes was calculated and sketched for the average of the domain sizes within the field of view of each frame of the movies acquired through the DHMicroscopy setup. Further, we have shown the histogram of the domain area size versus time in Fig.7. As the histograms show, in the initial seconds of the experiments, the number of domains with a smaller size is greater than the larger ones. However, while time passes, the number of large sized domains increases and, in contrast, the number of small ones decreases. This proves the idea of the effective role of the domain–domain coalescence on the domain size growth.
In conclusion, we have studied the coupling between intralayer phase separations and interlayer LC ordering in multicomponent membranes. We have used DHMicroscopy for volumetric measurement of the phenomenon dynamics. The samples include mixed species of lipids and cholesterol. DHMicroscopy provides detailed information on the thickness profile and volumes of the lipids. Our results show that the vol-ume evolution of lipid domains follows approximately the same universal growth law of area evolution. However, their thickness will not change significantly by time. The volume evolution is mostly attributed to the changes in area dynamics. We believe that our results can be useful in the field of membrane-based
Fig. 6 Evolution of domain size in stacked multicomponent lipid bilayers including of equimolar SM and DOPC1 and 30% Chol: (a) relative volume of domains extracted from averaging several domains in each acquired image, calculated through digital holograms reconstruction; (b) evolution of average area covered by domains ver-sus time, obtained from DHMicroscopy. Inset: Similar curve obtained from conventional microscopy images analysis; and (c) evolution of relative thickness averaged for several domains in each time. The uni-versal growth law ashxi ∼ t2nhave been fitted in all cases, showing the similar growth behavior for volume and area, different from
functional materials, and the approach of DHMicroscopy has the potential to be utilized for similar problems in the field of membranes.
Disclosures
The authors have no relevant financial interests and no other potential conflicts of interest.
References
1. F. R. Maxfield and I. Tabas,“Role of cholesterol and lipid organization in disease,”Nature438, 612–621 (2005).
2. A. Helgadottir et al.,“Variants with large effects on blood lipids and the role of cholesterol and triglycerides in coronary disease,”Nat. Genet.
48, 634–639 (2016).
3. N. E. Braverman and A. B. Moser,“Functions of plasmalogen lipids in health and disease,” Biochim. Biophys. Acta 1822, 1442–1452 (2012). 4. D. W. Lee et al.,“Lipid domains control myelin basic protein adsorption and membrane interactions between model myelin lipid bilayers,”Proc. Natl. Acad. Sci. U. S. A.111, E768–E775 (2014).
5. G. van Meer, D. R. Voelker, and G. W. Feigenson,“Membrane lipids: where they are and how they behave,”Nat. Rev. Mol. Cell Biol.9, 112–
124 (2008).
6. C. Eggeling et al.,“Direct observation of the nanoscale dynamics of membrane lipids in a living cell,”Nature457, 1159–1162 (2008). 7. L. Chernomordik, M. M. Kozlov, and J. Zimmerberg,“Lipids in
bio-logical membrane fusion,”J. Membr. Biol.146, 1–14 (1995). 8. R. G. Laughlin, The Aqueous Phase Behaviour of Surfactants,
Academic Press, London (1996).
9. D. F. Evans and H. Wennerstrom, The Colloidal Domain: Where Physics, Chemistry, Biology and Technology Meet, Wiley, New York (1999).
10. Y. K. Levine, A. B. Bailey, and M. H. F. Wilkins,“Multilayers of phospholipid bimolecular leaflets,”Nature220, 577–578 (1968). 11. L. Tayebi et al.,“Long-range interlayer alignment of interlayer domains
in stacked lipid bilayer,”Nat. Mater.11(12), 1074–1080 (2012).
12. J. Yamamoto and H. Tanaka,“Dynamic control of the photonic smectic order of membranes,”Nat. Mater.4, 75–80 (2005).
13. P. F. F. Almeida,“Thermodynamics of lipid interactions in complex bilayers,”Biochim. Biophys. Acta1788(1), 72–85 (2009).
14. P. Sharma,“Entropic force between membranes reexamined,” Proc. Natl. Acad. Sci. U. S. A.110(6), 1976–1977 (2013).
15. K. V. Peinmann and S. P. Nunens, Membranes for the Life Sciences, Wiley, New York (2008).
16. L. Tayebi, D. Vashaee, and A. N. Parikh,“Stability of uni- and multi-llamellar spherical vesicles,” Chem. Phys. Chem. 13(1), 314–322 (2012).
17. K. M. Sivaraman et al.,“Porous polysulfone coating for enhanced drug delivery,”Biomed. Microdevice14, 603–612 (2012).
18. P. Marchetti et al.,“Molecular separation with organic solvent nonfilt-eration: a critical review,”Chem. Rev.114(21), 10735–10806 (2014).
19. J. A. Kinler et al., Functional Material for Sustainable Energy Applications, Woodhead Publishing, Cambridge, United Kingdom (2012).
20. Y. Zhu et al.,“Recent progress in developing advanced membranes for emulsified oil/water separation,”NPG Asia Mater.6, e101 (2014). 21. Y. Zhu, A. Negmi, and J. Moran-Mirabel,“Multi-stacked supported
lipid bilayer micropatterning through polymer stencil lift-off,”
Membranes5(3), 385–398 (2015).
22. U. Schanars and W. Japtner, “Digital recording and numerical reconstruction of holograms,”Meas. Sci. Tech.13, R85–R101 (2002).
23. M. K. Kim,“Principle and techniques of digital holographic micros-copy,”SPIE Rev.1(1), 018005 (2010).
24. I. Moon et al., “Cell identification computational 3-D holographic microscopy,”Opt. Photonics News22(6), 18–23 (2011).
25. P. Marquet et al.,“Digital holographic microscopy: a noninvasive con-trast imaging technique allowing quantitative visualization of living cells with sub-wavelength axial accuracy,” Opt. Lett. 30, 468–470 (2005).
26. Y. Frauel et al.,“Three-dimensional imaging and processing using com-putational holographic imaging,”Proc. IEEE94(3), 636–653 (2006). 27. V. Bianco et al.,“Clear microfluidics imaging through flowing blood by
digital holography,” IEEE J. Sel. Top. Quantum Electron. 20(3), 6801507 (2014).
28. D. Shin et al.,“Optofluidic system for three-dimensional sensing and identification of micro-organisms with digital holographic microscopy,”
Opt. Lett.35, 4066–4068 (2010).
29. W. Goodman, Introduction to Fourier Optics, McGraw-Hill, New York (2005).
30. F. Zhang, G. Pedrini, and W. Osten,“Reconstruction algorithm for high-numerical-aperture hologram with diffraction-limited resolution,”
Opt. Lett.31, 1633–1635 (2006).
31. A. Anand, V. K. Chhaniwal, and B. Javidi,“Real time digital holo-graphic microscopy for phase contras 3D-imaging of dynamic phenom-ena,”J. Disp. Tech.6, 500–505 (2010).
32. N. Fathi et al.,“Digital holographic microscopy of the myelin figure structural dynamics and the effect of thermal gradient,”Biomed. Opt. Express4, 950–957 (2013).
33. R. Mosaviani, A. R. Moradi, and L. Tayebi,“Effect of humidity on liquid-crystalline myelin figure growth using digital holographic microscopy,”Mater. Lett.173, 162–166 (2016).
34. S. Ebrahimi et al.,“Digital holographic microscopy with coupled opti-cal fiber trap for cell measurement and manipulation,”Opt. Lett.39, 2916–2919 (2014).
35. G. Schmitz and G. Muller,“Structure and function of lamellar bodies, lipid–protein complexes involved in storage and secretion of cellular lipids,” J. Lipid Res. 32, 1539–1570 (1991).
36. M. Lifshitz and V. Slyozov,“The kinetics of precipitation from super-saturated solid solutions,”J. Phys. Chem. Solids19, 35–50 (1961). Biographies for the authors are not available.