Metabolomic Pro
file of Aggressive Meningiomas by Using
High-Resolution Magic Angle Spinning Nuclear Magnetic Resonance
Laura Bender,
*
,†François Somme,
‡Elisa Ruhland,
‡,§A. Ercüment Cicek,
∥,⊥Caroline Bund,
‡,§,#and Izzie Jacques Namer
‡,§,#†Oncology Department, ‡Biophysics and Nuclear Medicine Department,§MNMS-Platform, University Hospitals of Strasbourg,
Hôpital de Hautepierre, 1 Avenue Molière, Strasbourg 67200, Alsace, France
∥Computational Biology Department, School of Computer Science, Carnegie Mellon University, Pittsburgh 15213, Pennsylvania,
United States
⊥Computer Engineering Department, Bilkent University, Ankara 06800, Turkey #ICube, Université de Strasbourg/CNRS, UMR 7357, Strasbourg 67081, Alsace, France
ABSTRACT: Meningiomas are in most cases benign brain tumors. The WHO 2016 classification defines three grades of meningiomas. This classification had a prognosis value because grade III meningiomas have a worse prognosis value compared to grades I and II meningiomas. However, some benign or atypical meningiomas can have a clinical aggressive behavior. There are currently no reliable markers which allow distinguishing between the meningiomas with a good prognosis and those which may recur. High-resolution magic angle spinning (HRMAS) spectrometry is a noninvasive method able to determine the metabolite profile of a tissue sample. We retrospectively analyzed 62 meningioma samples by using HRMAS spectrometry (43 metabolites). We described a metabolic profile defined by a high concentration for acetate, threonine, N-acetyl-lysine, hydroxybutyrate, myoinositol, ascorbate, scylloinositol, and total choline and a low concentration for aspartate, glucose, isoleucine, valine, adenosine, arginine, and alanine. This metabolomic signature was associated with poor prognosis histological markers [Ki-67 ≥ 40%, high histological grade and negative progesterone receptor (PR) expression]. We also described a similar metabolomic spectrum between grade III and grade I meningiomas. Moreover, all grade I meningiomas with a low Ki-67 expression and a positive PR expression did not have the same metabolomic profile. Metabolomic analysis could be used to determine an aggressive meningioma in order to discuss a personalized treatment. Further studies are needed to confirm these results and to correlate this metabolic profile with survival data.
KEYWORDS: ex vivo spectrometry, HRMAS NMR, meningioma, metabolic signature
■
INTRODUCTIONMeningiomas are the most common adult primary central nervous system tumors. The Central Brain Tumor Registry of the United States (CBTRUS) reported 129 841 new cases between 2008 and 2012. In the United States, meningiomas represent 36.4% of all cases of primary central nervous system tumors.1,2 Meningiomas derive from arachnoid cap cells located in the arachnoid villi. These tumors arise in the majority of cases from brain meninges, but 10% derive from spinal cord meninges.3 Immunohistochemical analysis reveals an expression of vimentin, protein S100, epithelial membrane
antigen, and progesterone receptors (PRs).4,5Ragel and Jensen described aberrant signaling pathways (mammalian target of rapamycin, phosphoinositide 3-kinase, and mitogen-activated protein kinase) implicated in meningioma tumorigenesis.6 According to the World Health Organization (WHO) 2016 classification, meningiomas are divided into three grades: grade I or benign meningiomas, grade II or atypical meningiomas, and grade III or malignant meningiomas. The WHO 2016
Received: August 3, 2019 Published: November 4, 2019
pubs.acs.org/jpr Cite This:J. Proteome Res. 2020, 19, 292−299
meningiomas. Grade III meningiomas are defined by 20 or more mitoses per 10 high-power fields and/or pathological examinations, which look like pseudocarcinomas, pseudome-lanomas, or high-grade pseudosarcomas.8These tumors had a worse prognosis with a 10 year PFS rate of 0% and a 10 year OS rate from 14 to 34%.7Patients with grade III meningiomas had a worst prognosis compared to patients with grade I and II meningiomas because of a higher risk of recurrence and their capacity to develop brain and distant metastases. However, some grade I and grade II meningiomas may present a clinical aggressive behavior. Cellular proliferation is based on protein synthesis, and amino acids (AAs) are the natural building blocks of protein. Monitoring AA expression by using high-resolution magic angle spinning (HRMAS) spectrometry is interesting to understand the physiological and pathological processes of cellular metabolism.9 HRMAS nuclear magnetic resonance (NMR) spectrometry is a nondestructive method that is used to determine the metabolomic profile of a tumor sample. A tissue sample preparation is essential.10 This technique has already been evaluated in severalfields, notably to explore acute rejection after tissue transplantation or to improve the diagnosis and staging of tumor in oncology.11−13 In the actual literature, two studies evaluated the metabolite profile of meningiomas by using HRMAS. Monleón et al. analyzed 10 metabolites according to HRMAS spectrometry in 30 meningioma samples.14 Pfisterer et al. analyzed 68 meningioma samples (46 grade I, 14 grade II, and 8 grade III) by using proton magnetic resonance spectroscopy (8 metabolites).15Ex vivo spectroscopy analysis could permit to distinguish between meningioma with a good prognosis and those which tend to recur. Actually, there is a lack of data considering the spectroscopy analysis of meningiomas by using HRMAS NMR. The aim of this study was to correlate a metabolic profile with aggressive histological features for the meningiomas.
■
MATERIALS AND METHODSHRMAS NMR Analysis
Sample Preparation. Tissue specimens were collected with minimum ischemic delays after resection (average time 2 ± 1 min) and snap-frozen in liquid nitrogen before being stored at−80 °C. All tissue samples used in this study had a viable tumor/necrosis ratio, which was quantitatively and qualitatively adequate to perform satisfactory NMR HRMAS analysis. In order to wait for this goal, after NMR HRMAS analysis, the inserts were cut, and for half the content of each sample, the percentage of tumor cells in the total sample of cells with regard to the total surface was calculated using frozen hematoxylin and eosin-stained sections. Only samples
sional (1D) proton spectrum using a Carr−Purcell− Meiboom−Gill (CPMG) pulse sequence was acquired with a 285μs interpulse delay and a 10 min acquisition time for each tissue sample. The number of loops was set at 328, giving the CPMG pulse train a total length of 93 ms. The chemical shift was calibrated to the peak of the methyl proton ofL-lactate at 1.33 ppm. To confirm resonance assignments in a few representative samples, two-dimensional heteronuclear experi-ments (1H−13C) were also performed immediately after ending the 1D spectra acquisition.
HRMAS NMR Data Processing. Metabolite assignment and quantification were done with Chenomx software (Edmonton, AB, Canada) using a database of NMR spectra of 76 metabolites acquired in our laboratory under the same CPMG pulse sequence as the tissue samples.16 We could detect and quantify 43 metabolites in meningioma samples: acetate, adenosine, alanine, allocystathione, arginine, ascorbate, asparagine, aspartate, betaine, choline, creatine, ethanolamine, fumarate, γ-aminobutyric acid (GABA), glycine, glucose, glutamate, glutamine, glutathione (GSH), glycerol, glycer-ophosphocholine (GPC), hydroxybutyrate (HB), 2-hydrox-yglutarate (2HG), hypotaurine, isoleucine, lactate, lysine, methionine, myoinositol, aspartate (NAA), N-acetyl-lysine (NA-N-acetyl-lysine), ornithine, phenylalanine, phosphocholine (PC), phosphocreatine, proline, serine, scylloinositol, succi-nate, taurine, threonine, tyrosine, and valine. The results are expressed in nmol·mg−1of tissue. We also used total choline (choline + GPC + PC) and total creatine (creatine + phosphocreatine) as additional parameters in a network analysis.
Network Analysis
The algorithm to determine the expected metabolite level alterations (ADEMA) network analyses using mutual informa-tion were applied to the metabolite quantification value.17 ADEMA include information on the metabolic pathway in a unidirectional or bidirectional manner. The network was constructed using the Kyoto Encyclopedia of Genes and Genomes18,19 and Salway’s work.13 Using the metabolic network topology, the ADEMA algorithm evaluates the change in groups of metabolites between concentration data from two experimental groups instead of analyzing metabolite concen-trations one by one. Based on mutual information, the algorithm determines whether some metabolites are bio-markers when considered together, and it can predict the direction of the expected change per metabolite depending on the metabolic network topology considered. Various groups of metabolites related to the metabolic pathways involved were compared:
• Taurine, hypotaurine, aspartate, methionine, allocysta-thione, and serine
• Aspartate, asparagine, acetate, threonine, and NAA • Aspartate, lysine, and NA-lysine
• Acetate, threonine, allocystathione, and methionine • Glucose, acetate, and HB
• Aspartate, threonine, and isoleucine • Glucose, glycine, and serine
• Glucose, glycerol, phenylalanine, and tyrosine • Glucose, valine, and isoleucine
• Glucose and lactate • Valine, lactate, and alanine
• Glucose, myoinositol, ascorbate, GSH, glycine, and glutamate
• Myoinositol and scylloinositol • •Glutamate, GABA, and proline
• Aspartate, adenosine, succinate, fumarate, and 2HG • Glutamate, glutamine, glycine, and 2HG
• Glutamate, arginine, glycine, creatine, and ornithine • Aspartate, arginine, and ornithine
• Ethanolamine, choline, GPC, PC, and total choline • Choline, betaine, and glycine
Histological Analysis
We studied 62 surgical samples. Hematoxylin and eosin staining was done for histological typing. Tumors were graded according to the WHO 2016 (world health organization) classification. Immunohistochemical staining was done to determine Ki-67 (clone SP6) and PR (clone 16).
Written patient’s consent has been obtained. The Ethics Committee of Strasbourg approved the study (CARMeN Project, Ethics Committee no. 2003-100, 09.12.2003). Statistical Analysis
The receiver operating characteristic curve was used to define the optimal threshold of Ki-67 to distinguish between grade I and grade II/III meningiomas in our cohort (Youden index). Thus, the optimal cutoff obtained was 12.5% (AUC 88.3, sensitivity 87.5%, and specificity 97.8%).
■
RESULTSPatient Population
We retrospectively included 62 meningiomas from 50 patients treated by surgery in the Department of Neurosurgical at University Hospitals of Strasbourg between October 2002 and
September 2010. There were 45 grade I, 8 grade II, and 6 grade III meningiomas. The histological grade was statistically associated with OS (p < 0.0001).
Forty-three meningiomas had a Ki-67 rate under 5%, while eight tumors had a Ki-67 rate over 40%. For three patients, the Ki-67 expression was not available. A high Ki-67 rate (>40%) was statistically associated with a worser OS (p = 0.0017). The PR expression was obtained for 54 meningiomas, among which 33 were positive and 21 were negative. A positive PR expression was statistically associated with a longer OS (p < 0.0001). Among the 62 tumor samples, 58 (93%) were primary tumors and four were meningioma-relapsed.
Metabolic Spectrum According to Histological Grade Meningiomas with a high histological grade (II and III) according to the WHO 2007 classification were associated with an elevated concentration for acetate, threonine, NA-lysine, glycine, myoinositol, ascorbate, scylloionitol, HB, succinate, choline, GPC, PC, total choline, and glycerol and a low concentration for taurine, aspartate, serine, glucose, isoleucine, valine, alanine, adenosine, glutamine, arginine, ethalonamine, and betaine.
Metabolic Spectrum According to Ki-67 Expression A high Ki-67 rate was statistically associated with an elevated concentration of allocystathionine, methionine, acetate, threonine, NAA, NA-lysine, HB, glycine, myoinositol, ascorbate, scylloinositol, GABA, succinate, ornithine, and choline and a low concentration of taurine, hypotaurine, aspartate, serine, glucose, alanine, adenosine, arginine, creatine, phosphocreatine, and total creatine.
Metabolic Spectrum According to PR Expression
A positive PR was statistically associated with an elevated concentration of aspartate, serine, lysine, glucose, isoleucine, valine, alanine, proline, adenosine, arginine, creatine, and total creatine and a low concentration of taurine, acetate, threonine, NAA, NA-lysine, HB, myoinositol, ascorbate, scylloinositol, fumarate, 2HG, choline, GPC, PC, total choline, and betaine. We were then able to describe a metabolic profile associated with aggressive meningiomas (according to histological markers). Indeed, a high concentration of acetate, threonine, NA-lysine, HB, myoinositol, ascorbate, scylloinositol, and total choline and a low concentration of aspartate, serine, glucose, adenosine, arginine, alanine, and creatine were associated with a grade II/III meningioma with a Ki-67 rate ≥40% and a
Figure 1.Summary of ADEMA network analysis conducted for specified group comparison based on the metabolite concentration obtained by HRMAS NMR spectroscopy. Red and blue boxes indicate higher and lower metabolite concentrations, respectively, between groups and gray boxes indicate no significant difference.
Figure 2.Metabolic pathways considering aggressive meningiomas (grade II/III, Ki-67 > 40%, and negative PR expression).
negative PR expression (Figure 1). Aside from threonine (p = 0.01), no metabolite is associated with OS. There was no significant metabolic pathway (Figure 2).
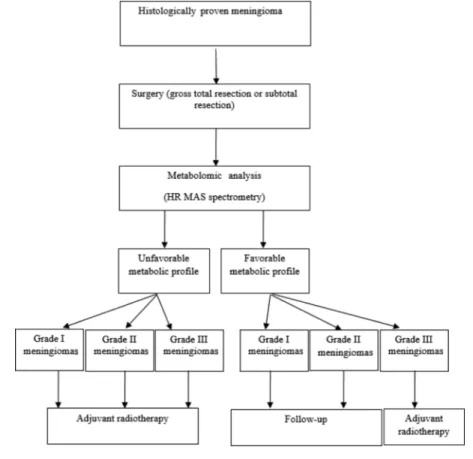
We proposed a management strategy by using metabolic analysis according to HRMAS NMR spectrometry (Table 1). Indeed, the metabolic profile could permit to distinguish between meningiomas which relapse and those which do not, in order to adapt the therapeutic strategy.
Moreover, we showed that all meningiomas with a low histological grade and a low Ki-67 proliferation index did not have a similar metabolomic profile (Figure 3). Indeed, some benign meningiomas had a comparative metabolomic spec-trum compared to the high-grade meningiomas (Figure 4).
■
DISCUSSIONWe retrospectively studied the metabolic profile for 62 meningiomas by using HRMAS NMR. In our study, we correlated ex vivo spectrometry data with three histological features (histological grade, Ki-67 rate, and PR expression). We defined an aggressive meningioma as a tumor with a high histological grade, a Ki-67 rate ≥40%, and a negative PR expression. In our study, these three histological markers were associated with OS. According to the WHO 2007 classification (revised in 2016), a high-grade meningioma (II/III) is associated with a poor prognosis and a high risk of recurrence.7,20,21 Two studies described Ki-67 proliferative
Figure 3.Three representative spectra of grade I meningiomas with low Ki-67 rates [(A) 4, (B) 2, and (C) 3%, respectively) and positive PR expression.
Figure 4.Comparative spectra of grade I meningiomas [(A) Ki-67 rate: 4%; positive PR expression] and grade III meningiomas [(B) Ki-67 rate: 80%; negative PR expression].
membrane component which participates in several cellular processes such as metabolic homeostasis, mRNA export, and stress response.26 This role in the carcinogenesis remains unknown. Ascorbate is an essential nutriment. This metabolite is an inhibitor factor of the hypoxia-inducible factor system, and it decreased VEGF expression. Ascorbate also had a cytotoxic activity because of an oxidative-related mechanism.27 The production of phosphorylcholine is an essential component in the induction of DNA synthesis and is therefore responsible of cell proliferation.28 An increased total choline expression reflects a tumoral hypoxia, and the GPC/PC ratio is related to the tumoral aggressiveness. These findings are consistent with our result. Aspartate decreased tumor proliferation, but the physiopathology remains unknown.29 This finding is also consistent with our results. Glucose and alanine produce pyruvate which is transformed into lactate in the cell without oxygen such as tumor cell.30In our study, we observed that a low concentration of glucose and alanine was associated with an aggressive tumor.
There is actually a lack of data considering ex vivo spectroscopy for meningiomas. Monleón et al. studied 30 meningioma samples by using HRMAS NMR. The authors analyzed only 10 metabolites. Among the 30 meningiomas, 23 were classed grade I and 7 were classed grade II. The authors showed that the concentrations of PC (3.2 ppm) (p = 0.040) and phosphoethanolamine (4.01 ppm) (p = 0.016) were statistically higher for atypical meningiomas compared to benign meningiomas. These metabolites are implicated in the synthesis and degradation of phospholipids. Glutamine (2.44 ppm) (p = 0.045), glutamate (2.35 ppm) (p = 0.008), and GSH (2.55 ppm) (p = 0.019) were statistically present in a higher concentration for grade II meningiomas compared to grade I meningiomas. GSH is an antioxidant and plays a role in free radical protection. Moreover, the concentration of taurine (3.42 ppm) (p = 0.0041) was statistically higher for atypical meningiomas compared to benign meningiomas.14Aside from PC, the findings were contrast with our results. These differences could be explained by the fact that we included all grades of meningiomas (grades I to III). Moreover, our work study included twice as many tumor samples. Pfisterer et al. analyzed 68 meningioma samples (46 grade I, 14 grade II, and 8 grade III) by using proton magnetic resonance spectroscopy (8 metabolites). The mean concentrations of alanine and creatine were statistically higher in benign meningiomas compared to grade II and III meningiomas (p = 0.002). Furthermore, the authors noted that the mean concentrations of creatine and alanine were statically lower in tumors which rapidly recurred compared to those that did not (p < 0.001).15To complete these results, Pfisterer et al. studied the metabolic profile by using proton magnetic resonance
concentration of this metabolite was statistically associated with a high Ki-67 expression.
Moreover, in our study, we described three different spectra representative of a meningioma with nonaggressive histological features (grade I, a low Ki-67 expression, and a positive PR expression). The concentration of the metabolites was different for these tumors, mainly total choline, glucose, and creatine. One grade I meningioma with a low Ki-67 expression had no expression of glucose; this suggests an aggressive tumor behavior. Moreover, one grade I meningioma had a low concentration of creatine, which suggests tumor hypoxia and aggressive behavior. Despite different metabolite concentra-tions, all grade I meningiomas had a very low concentration of myoinositol and scylloinositol and a positive glycerophospho-choline/PC (GPC/PC) ratio.
Furthermore, we described a similar metabolic spectra between a grade I meningioma (Ki-67 rate 4% and a positive PR expression) and a grade III meningioma (Ki-67 rate 80% and a negative PR expression). We obtained similar glutamate, glutamine, and total choline concentrations between both tumors. However, the GPC/PC ratio was different. Indeed, the ratio was positive for grade I meningiomas and negative for grade III meningiomas. A negative GPC/PC ratio is associated with malignant tumors. Furthermore, the creatine concen-tration was also lower for grade III meningiomas compared to grade I meningiomas. This suggests that hypoxia is higher for grade III meningiomas. Glycine, myoinositol, scylloinositol, and ascorbate concentrations were also higher for grade III meningiomas compared to grade I meningiomas. Taurine and hypotaurine concentrations were lower for grade III meningi-omas in comparison with grade I meningimeningi-omas.
Finally, we proposed a metabolic profile associated with poor histological prognosis markers. This signature could be used to discuss a personalized therapeutic management. However, future studies are needed to confirm these results in order to include spectrometry and histological analysis to improve the classification of meningiomas.
■
CONCLUSIONSMeningiomas are the most common benign brain tumors. However, some tumors can have a clinically aggressive behavior. Histological markers such as Ki-67, PR expression, or tumor grade are correlated with prognosis. We described a metabolic profile associated with poor histological prognosis markers for meningioma. Metabolic analysis could be useful to distinguish between clinically aggressive meningiomas and those which did not recur in order to adapt the initial treatment. Future studies are needed to determine an association between this metabolic signature and survival data.
■
AUTHOR INFORMATIONCorresponding Author
*E-mail: [email protected]. Phone: +33 (0)3 88 12 76 65. Fax: +33 (0)3 88 12 89 54.
ORCID
Laura Bender:0000-0003-3486-8505
Notes
The authors declare no competingfinancial interest.
■
ACKNOWLEDGMENTSThe authors of the manuscript have no financial interest or arrangement with a company whose product was used in a study or is referred to in an article, anyfinancial interest in or arrangement with a competing company, any other financial connections, direct or indirect, or other situations that might raise the question of bias in the work reported or the conclusions, implications or opinions stated including pertinent commercial, governmental, private or other sources of funding for the individual author(s) or for the affiliated department(s) or organization(s), personal relationships, or direct academic competition.
■
REFERENCES(1) Dolecek, T. A.; Propp, J. M.; Stroup, N. E.; Kruchko, C. CBTRUS Statistical Report: Primary Brain and Central Nervous System Tumors Diagnosed in the United States in 2005-2009. Neuro Oncol. 2012, 14, v1−v49.
(2) Wiemels, J.; Wrensch, M.; Claus, E. B. Epidemiology and Etiology of Meningioma. J. Neuro Oncol. 2010, 99, 307−314.
(3) Kshettry, V. R.; Ostrom, Q. T.; Kruchko, C.; Al-Mefty, O.; Barnett, G. H.; Barnholtz-Sloan, J. S. Descriptive Epidemiology of World Health Organization Grades II and III Intracranial Meningiomas in the United States. Neuro Oncol. 2015, 17, 1166− 1173.
(4) Holden, J.; Dolman, C. L.; Churg, A. Immunohistochemistry of Meningiomas Including the Angioblastic Type. J. Neuropathol. Exp. Neurol. 1987, 46, 50−56.
(5) Maxwell, M.; Galanopoulos, T.; Neville-Golden, J.; Antoniades, H. N. Expression of Androgen and Progesterone Receptors in Primary Human Meningiomas. J. Neurosurg. 1993, 78, 456−462.
(6) Ragel, B. T.; Jensen, R. L. Aberrant Signaling Pathways in Meningiomas, Ragel and al. Journal of Neuro-Oncology. J. Neuro Oncol. 2010, 99, 315−324.
(7) Bi, W. L.; Zhang, M.; Wu, W. W.; Mei, Y.; Dunn, I. F. Meningioma Genomics: Diagnostic, Prognostic, and Therapeutic Applications. Front. Surg. 2016, 3, 40.
(8) Backer-Grøndahl, T.; Moen, B. H.; Torp, S. H. The Histopathological Spectrum of Human Meningiomas. Int. J. Clin. Exp. Pathol. 2012, 5, 231−242.
(9) Dietz, C.; Ehret, F.; Palmas, F.; Vandergrift, L. A.; Jiang, Y.; Schmitt, V.; Dufner, V.; Habbel, P.; Nowak, J.; Cheng, L. L. Applications of High-Resolution Magic Angle Spinning MRS in Biomedical Studies II-Human Diseases. NMR Biomed. 2017, 30, e3784.
(10) Giskeødegård, G. F.; Cao, M. D.; Bathen, T. F. High-Resolution Magic-Angle-Spinning NMR Spectroscopy of Intact Tissue. In Metabonomics; Bjerrum, J. T., Ed.; Springer New York: New York, NY, 2015; Vol. 1277, pp 37−50.
(11) Chen, W.; Lu, S.; Wang, G.; Chen, F.; Bai, C. Staging Research of Human Lung Cancer Tissues by High-Resolution Magic Angle Spinning Proton Nuclear Magnetic Resonance Spectroscopy (HRMAS 1 H NMR) and Multivariate Data Analysis. Asia Pac. J. Clin. Oncol. 2017, 13, e232−e238.
(12) Chae, E. Y.; Shin, H. J.; Kim, S.; Baek, H.-M.; Yoon, D.; Kim, S.; Shim, Y. E.; Kim, H. H.; Cha, J. H.; Choi, W. J.; et al. The Role of
High-Resolution Magic Angle Spinning 1H Nuclear Magnetic Resonance Spectroscopy for Predicting the Invasive Component in Patients with Ductal Carcinoma In Situ Diagnosed on Preoperative Biopsy. PLoS One 2016, 11, e0161038.
(13) Lee, C. W.; Lee, J. S.; Woo, C. W.; Kim, S. High-Resolution Magic Angle Spinning Nuclear Magnetic Resonance Spectroscopy for the Metabolic Assessment of Acute Rejection After Cardiac Transplantation in Rats. Transplant. Proc. 2017, 49, 1935−1941.
(14) Monleón, D.; Morales, J. M.; Gonzalez-Darder, J.; Talamantes, F.; Cortés, O.; Gil-Benso, R.; López-Ginés, C.; Cerdá-Nicolás, M.; Celda, B. Benign and Atypical Meningioma Metabolic Signatures by High-Resolution Magic-Angle Spinning Molecular Profiling. J. Proteome Res. 2008, 7, 2882−2888.
(15) Pfisterer, W. K.; Nieman, R. A.; Scheck, A. C.; Coons, S. W.; Spetzler, R. F.; Preul, M. C. Using Ex Vivo Proton Magnetic Resonance Spectroscopy to Reveal Associations between Biochemical and Biological Features of Meningiomas. Neurosurg. Focus 2010, 28, E12.
(16) Ruhland, E.; Bund, C.; Outilaft, H.; Piotto, M.; Namer, I.-J. A Metabolic Database for Biomedical Studies of Biopsy Specimens by High-Resolution Magic Angle Spinning Nuclear MR: A Qualitative and Quantitative Tool. Magn. Reson. Med. 2019, 82, 62.
(17) Cicek, A. E.; Bederman, I.; Henderson, L.; Drumm, M. L.; Ozsoyoglu, G. ADEMA: An Algorithm to Determine Expected Metabolite Level Alterations Using Mutual Information. PLoS Comput. Biol. 2013, 9, e1002859.
(18) Kanehisa, M.; Goto, S. KEGG: Kyoto Encyclopedia of Genes and Genomes. Nucleic Acids Res. 2000, 28, 27−30.
(19) Kanehisa, M.; Goto, S.; Sato, Y.; Kawashima, M.; Furumichi, M.; Tanabe, M. Data, Information, Knowledge and Principle: Back to Metabolism in KEGG. Nucleic Acids Res. 2014, 42, D199−D205.
(20) Louis, D. N.; Ohgaki, H.; Wiestler, O. D.; Cavenee, W. K.; Burger, P. C.; Jouvet, A.; Scheithauer, B. W.; Kleihues, P. The 2007 WHO Classification of Tumours of the Central Nervous System. Acta Neuropathol. 2007, 114, 97−109.
(21) Louis, D. N.; Perry, A.; Reifenberger, G.; von Deimling, A.; Figarella-Branger, D.; Cavenee, W. K.; Ohgaki, H.; Wiestler, O. D.; Kleihues, P.; Ellison, D. W. The 2016 World Health Organization Classification of Tumors of the Central Nervous System: A Summary. Acta Neuropathol. 2016, 131, 803−820.
(22) Terzi, A.; Saglam, E. A.; Barak, A.; Soylemezoglu, F. The Significance of Immunohistochemical Expression of Ki-67, P53, P21, and P16 in Meningiomas Tissue Arrays. Pathol., Res. Pract. 2008, 204, 305−314.
(23) Wang, Y.-C.; Chuang, C.-C.; Wei, K.-C.; Hsu, Y.-H.; Hsu, P.-W.; Lee, S.-T.; Wu, C.-T.; Tseng, C.-K.; Wang, C.-C.; Chen, Y.-L.; et al. Skull Base Atypical Meningioma: Long Term Surgical Outcome and Prognostic Factors. Clin. Neurol. Neurosurg. 2015, 128, 112−116. (24) Iplikcioglu, A. C.; Hatiboglu, M. A.; Ozek, E.; Ozcan, D. Is Progesteron Receptor Status Really a Prognostic Factor for Intra-cranial Meningiomas? Clin. Neurol. Neurosurg. 2014, 124, 119−122.
(25) Gil, J.; Ramírez-Torres, A.; Encarnación-Guevara, S. Lysine Acetylation and Cancer: A Proteomics Perspective. J. Proteom. 2017, 150, 297−309.
(26) Bizzarri, M.; Fuso, A.; Dinicola, S.; Cucina, A.; Bevilacqua, A. Pharmacodynamics and Pharmacokinetics of Inositol(s) in Health and Disease. Expert Opin. Drug Metabol. Toxicol. 2016, 12, 1181− 1196.
(27) Mastrangelo, D.; Pelosi, E.; Castelli, G.; Lo-Coco, F.; Testa, U. Mechanisms of Anti-Cancer Effects of Ascorbate: Cytotoxic Activity and Epigenetic Modulation. Blood Cells Mol. Dis. 2018, 69, 57−64.
(28) Cuadrado, A.; Carnero, A.; Dolfi, F.; Jiménez, B.; Lacal, J. C. Phosphorylcholine: A Novel Second Messenger Essential for Mitogenic Activity of Growth Factors. Oncogene 1993, 8, 2959−2968. (29) Sullivan, L. B.; Luengo, A.; Danai, L. V.; Bush, L. N.; Diehl, F. F.; Hosios, A. M.; Lau, A. N.; Elmiligy, S.; Malstrom, S.; Lewis, C. A.; et al. Aspartate Is an Endogenous Metabolic Limitation for Tumour Growth. Nat. Cell Biol. 2018, 20, 782−788.
![Figure 4. Comparative spectra of grade I meningiomas [(A) Ki-67 rate: 4%; positive PR expression] and grade III meningiomas [(B) Ki-67 rate:](https://thumb-eu.123doks.com/thumbv2/9libnet/5875587.121148/5.938.125.811.103.492/figure-comparative-spectra-grade-meningiomas-positive-expression-meningiomas.webp)
