i
CONCURRENT IMPACT OF VARIOUS
PROSPECTIVE DRUG LIGAND MOLECULES ON
DIFFERENT ILLNESS/DISEASE MECHANISMS
Master’s Thesis
Birce BUTURAK
Stu.No: 2011.11.09.002
Master of Science (MSc) in
Computational Biology and Bioinformatics
KADIR HAS UNIVERSITY
ii
CONCURRENT IMPACT OF VARIOUS
PROSPECTIVE DRUG LIGAND MOLECULES ON
DIFFERENT ILLNESS/DISEASE MECHANISMS
BİRCE BUTURAK B.S. Department of Biology, Faculty of Art and Sciences,
Uludağ University, 2009
Submitted to the Graduate School of Science and Engineering In partial fulfillment of the requirements for the degree of
Master of Science in
Computational Biology and Bioinformatics
KADİR HAS UNIVERSITY May. 2013
iii CONTENTS Abstract...iv Özet……….……….v Acknowledgments………..vii List of Abreviations………..………viii List of Figures……….………..……..x List of Tables ……….………...x 1. Introduction...10 2. Methodology………...20 2.1. Molecular Docking………....20 2.1.1 Autodock………..20 2.2. Pre-Docking………...25
2.2.1. Preparation of ligand and protein structures for docking………...25
2.2.1.1. Preparation of ligand structures………25
2.2.1.2. Preparation of protein structures………..25
2.2.1.2.1 PQR format……….26
2.3. Docking……….………..45
2.3.1. Protein-ligand docking……….………..45
2.3.1.1. Grid-box generation………....45
2.3.1.2. Ligand docking………45
3. Results and discussion...46
4. Conclusion...66
iv
ABSTRACT
In this thesis work, we have performed binding energy computation studies of various prospective drug molecules with various proteins. Our aim in performing such studies was to observe the possible concurrent effects of such several drug-like ligand molecules on different metabolic and illness mechanisms by means of computational tools. Docking was the main computational tool we have used.
Therefore, in this study docking of 26 ligands into 229 proteins from different classes was performed. For the proteins, X-ray crystal structures were taken from PDB database [1]. Meanwhile, for the ligands structures were used from a previous study of several prospective drug molecules. These ligands previously had been studied with GOLD Software for the inhibitation of carbonic anhydrases (CA) at Calgary University by Durdagi et. al. [2,3]. The major objective of this study is to show the concurrent impact of various prospective drug ligand molecules on different disease mechanisms computationally. Correspondingly, computations in this study were performed to see whether these 26 ligands successfully binds with 229 proteins or not.
As a whole, 5 classes of proteins were considered for docking. These classes were selected from six main enzyme family classes [4]. These are; 38 proteins from the lyases, 47 proteins from hydrolases, 47 proteins from transferases, 45 proteins from ligases, 52 proteins from isomerases. In this research, Autodock Docking Software was used for the computation of the determination of the optimum binding sites and energies.
As a result, for all the proteins included in this thesis study, overall 4974 different binding energies and binding poses were obtained out of the docking results. Some of the docking results obtained here were compared with the results obtained in previous studies [2,3]. Comparing the results with the previous GOLD scores we found almost equivalent values . In addition, in this study it is observed that, how these specific ligands inhibited similarly in each class. Because of the conserved regions of amino acid sequences in each class of proteins, proteins have high structural similarity. As a result of this structural similarity, some similarities within the binding energies and positions were determined among the docking results. Looking at the results’ similarity expectations were hold generally. The reason of getting similar conclusions for each class is resulted from structural and physicochemical similarity of the functional groups coming from the inherited similarity.
v
ÇEŞİTLİ OLASI İLAÇ LİGAND MOLEKÜLLERİNİN FARKLI HASTALIK MEKANİZMALARINA EŞ ZAMANLI ETKİSİ
ÖZET
Bu tez çalışmasında bir çok değişik olası ilaç moleküllerinin çeşitli proteinlerle bağlanma enerjileri hesaplama çalışmaları gerçekleştirmiş bulunmaktayız. Bu tarz çalışmalar geçekleştirmemizdeki amaç bu gibi ilaç benzeri moleküllerin değişik metabolik ve hastalık mekanizmaları üzerindeki eş zamanlı etkilerinin hesaplamalı yöntemlerle gözlemlenmesidir. Kullandığımız ana hesaplama aracı “Docking”dir.
Dolayısıyla bu çalışmada 26 ligandın çeşitli protein sınıflarındaki 229 protein içerisindeki bağlanma docking’leri gerçekleştirilmiştir. Proteinler için X-Işını kristal yapıları PDB veritabanından alınmıştır [1]. Bununla beraber, daha önceki bir çalışmada yer alan olası ilaç moleküllerine ait ligand yapıları kullanılmıştır. Bu ligandlar daha once Calgary Üniversitesi’nde karbonik anhidrazların (CA) inhibisyonu üzerine GOLD yazılımıyla Durdagi grubu tarafından çalışılmıştır [2,3].
Bu çalışmanın ana amacı ilaç olarak kullanılabilecek çeşitli ligand moleküllerinin değişik hastalık mekanizmaları üzerindeki eş zamanlı etkilerini hesaplamalı olarak göstermektir. Buna bağlı olarak, bu çalışmadaki hesaplamalar bu 26 ligandın 229 proteinle başarılı bir şekilde bağlanıp bağlanmadığını görmek için gerçekleştirilmiştir.
Docking için toplamda 5 protein sınıfı ele alınmıştır. Bu sınıflar alti ana enzim ailesi sınıfı arasından seçilmiştir[4]. Bunlar; liyazlardan 38 protein, 47 protein hidrolazlardan, 47 protein transferaz, 45 protein ligaz, 52 protein izomerazlardandır. Bu araştırmada optimum bağlanma bölgeleri ve enerjilerini belirleme hesaplamaları için Autodock Docking Yazılımı kullanılmıştır.
Sonuç olarak, bu tez çalışmasında yer alan bütün proteinler için toplamda 4974 farklı bağlanma enerjisi ve pozu docking sonuçlarından elde edilmiştir. Burada elde edilmiş bazı docking sonuçları daha önceki çalışmada elde edilenlerle karşılaştırılmıştır [2,3]. Sonuçların daha önceki GOLD skorlarıyla karşılaştırılması sonucunda hemen hemen eşit değerler bulduk. Bunun yanında bu çalışmada bu spesifik ligandların her bir sınıfta nasıl benzer inhibisyon yaptığını özlemledik. Her protein sınıfındaki aminoasit sekanslarındaki korunan kısımlar sayesinde, proteinler yüksek yapısal benzerliğe sahipler. Bu yapısal benzerlik sonucunda, docking sonuçlarından bağlanma enerjileri ve pozisyonları arasında bazı benzerlikler belirlenmiştir. Sonuçların benzerliğine bakınca sonuçlar genel olarak
vi
beklenenlerle tutarlılık göstermektedir. Her sınıf için benzer çıkarımlar elde edilmesinin sebebi, kalıtılsal benzerlikten kaynaklanan fonksiyonel gruplardaki yapısal ve fizikokimyasal benzerlikten kaynaklanmaktadır.
vii
Acknowledgments
Foremost, I am grateful to my advisor Tuğba Arzu Özal for working with me, aiding me in writing and for her friendship, giving me good advice and suggestions. Through her guidance I have become a better scientist. I feel great gratitude to my parents Nadide Buturak, Ali Buturak and Ö. Sıla Ulus Buturak. They support and guide throughout my life and academic career. Without their persistence and dedication, my path through life may have been very different. Doç. Dr. Sibel Taş has given support especially during my graduate work and I am very indebted to her. During the time I spent at Kadir Has University, I am grateful to my other Computational Biology and Bioinformatics Department members, Prof. Dr. Kemal Yelekçi, Yrd. Doç. Dr. Demet Akten Akdoğan, and Dr. Şebnem Eşsiz Gökhan, all of whom have given me a great deal of guidance throughout my graduate career. Abdurrahman Olgaç helped me closely on DOCK development and I enjoyed collaborating with him. In addition, I would like to thank all my friends for their help and friendship especially to Ayça Gürsoy, Altan Genç, Özge Şahin, Hakan Kurtuluş and Lütfiye Özcan.
viii LIST OF ABREVIATIONS Br: Bromine C: Carbon Cl: Chlorine F: Fluorine H: Hydrogen N: Nitrogen O: Oxygen
CA: Carbonic anhydrases Ki: Inhibitory constant
LGA: Lamarchian genetic algorithm PDB: Protein data bank
PDB ID: Protein data bank structure identifiers
AutoDock: Automated docking of flexible ligands to receptors GA: Genetic algorithm
LS: Local search MC: Monte Carlo
∆G: The gibbs free energy
∆GvdW: Van der Waals gibbs free energy
∆Ghbond: The hydrogen bonding gibbs free energy ∆Gelec: Electrostatic gibbs free energy
∆Gtor: Torsional degrees of freedom upon binding gibbs free energy
ix
PPi: Pyrophosphate
NAD+ : Nicotinamide adenine dinucleotide
NADP+:Nicotinamide adenine dinucleotide phosphate
EC: Enzyme commission number DNA: Deoxyribonucleic acid DS: Discovery studio
x
LIST OF FIGURES
Figure 1.Structures of the tested (docked) compounds Figure 2. The main features of a grid map is illustrated
Figure 3. Binding interactions for best docking poses of L4 within 2OOA, (A: secondary structure represantation, B: in detail)
Figure 4. Binding interactions for best docking poses of L5 within1B6A, (A: secondary structure represantation, B: in detail)
Figure 5. Binding interactions for best docking poses of L5 within 2PBC, (A: secondary structure represantation, B: in detail)
Figure 6. Binding interactions for best docking poses of L5 within 3FVS, (A: secondary structure represantation, B: in detail)
Figure 7. Binding interactions for best docking poses of L26 within 1P4O, (A: secondary structure represantation, B: in detail)
LIST OF TABLES Table 1. List of proteins
Table 2. Basic characteristics of selected Ligases proteins Table 4. Basic characteristics of selected Isomerases proteins Table 5. Basic characteristics of selected Transferases proteins Table 6. Basic characteristics of selected Hydrolases proteins
Table 7. Molecular docking binding scores of the 15 compounds within Lyases Class Table 8. Molecular docking binding scores of the 25 compounds within Hydrolases Class Table 9. Molecular docking binding scores of the 24 compounds within Isomerases Class Table 10. Molecular docking binding scores of the 20 compounds within Ligases Class Table 11. Molecular docking binding scores of the 23 compounds within Transferases Class
10
1. INTRODUCTION
Ligands, which are molecules used in drug applications, binds to protein molecules and this binding affinity causes changes in the mechanisms where those proteins take place. Computationally it is possible to study these binding properties via a method which is called docking.
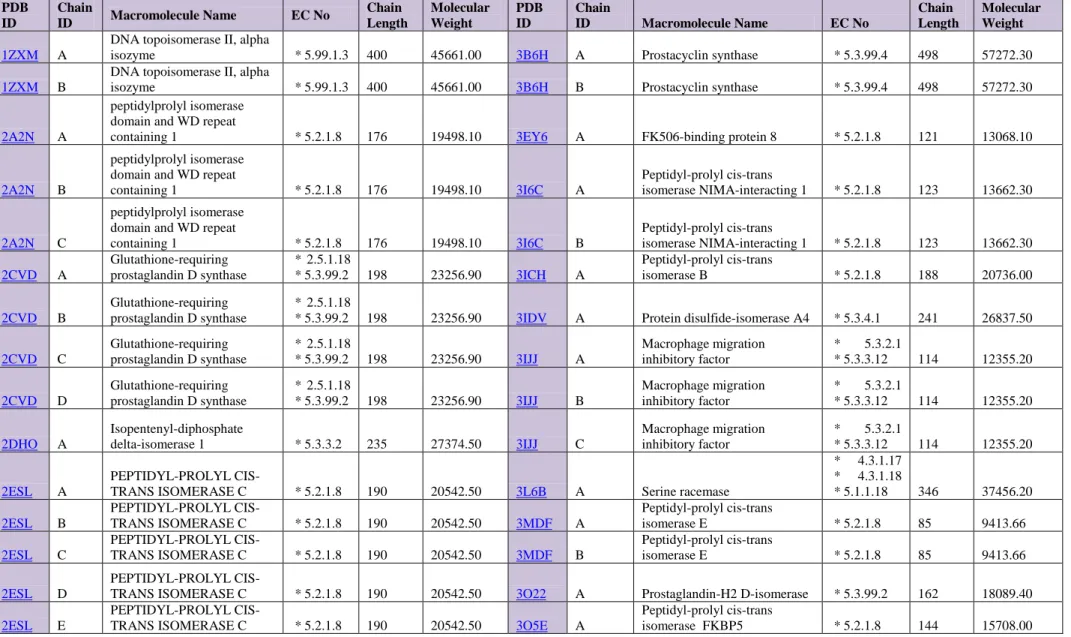
In this study, docking of 26 ligands into 229 proteins from different classes were performed in order to see whether there is a concurrent impact of these ligand molecules which may have a drug application. These concurrent impacts were aimed to be tested via docking studies. 2D structures of the docked ligand molecules were given below in Figure 1. All 26 ligands depicted were previously studied by means of kinetic and in silico analysis by Durdagi et al. [2,3]. These molecules were enumerated from 1 to 26 for this study and they are abbreviated as L, indicating the ligand property of these structures. In the figure, atoms in the 2D structures of the molecules were coloured according to atom types: H, white; C, black; N, dark blue; O, red; Cl, green; Br, reddish brown; F, light blue.
As it can be seen from the 2D plots of the structures, all the ligand molecules considered in this research consist aromatic groups in their structures. While some of these compounds include functional groups such as hydroxyl or nitrate group in their structure, a number of them include halogen atoms such as chlor (Cl) or brom (Br) in their structure. Resonance properties of the aromatic groups were also depicted in the structures shown in figure 1. These kind of electronic distributions within the molecules affects the binding characteristics of the ligands in great extent. Existence of the functionally important atoms especially like nitrogen and oxygen in the ligand molecules together with the aromaticity make these molecules functionally important in sense of binding properties. Binding affinity is one of the crucial properties considered in the drug design.
For the computational assessment of the binding energies docking studies were performed. These energy values were tabulated with color indexing throughout the thesis to show the impacts existing simultaneously in each class. As a result, the coexistence of the colors used for the labelling of the lowest best binding energy values makes the recognition of the concurrent impacts visually easier.
11
All dockings in this study were carried out on a workstation of multithread 12 core Linux (x86-64bit) computer. Parallel processing within the multithreads were used during the docking computations. The software used in this study was Autodock Tools [5]. Furthermore, the 2D and 3D molecular drawings, all figures of molecular structures were created with Discovery Studio 3.5(DS) [6].
13
Figure 1. Structures of the tested (docked) compounds [2,3]
Atoms were colored according to atom types: H, white; C,black; N,dark blue; O, red; Cl; green; Br, reddish brown; F, light blue.
14
Enzyme Classifications
Enzymes are classified according to the reactions they catalyze. The six classes are Oxidoreductases, Transferases, Hydrolases, Lyases, Isomerases, Ligases [4].
Class 1. Oxidoreductases
Oxidoreductases catalyzes oxidoreduction reactions [7]. The oxidoreduction catalytic reaction includes transfer of electrons from the oxidant to the reductant. Oxidoreductases catalyze reactions correspond to the following,
A- + B → A + B
-where A is the oxidant and B is the reductant [8]. Oxidases are enzymes implicated when molecular oxygen acts as an acceptor of hydrogen or electrons. These enzymes can be oxidases or dehydrogenases. Oxidases are enzymes involved when molecular oxygen acts as an acceptor of hydrogen or electrons. However, dehydrogenases are enzymes that oxidize a substrate by transferring hydrogen to an acceptor that is either NAD+ / NADP+ or a flavin enzyme. Oxidoreductases involves Hydroxylases, reductases, preoxidases and oxygenases. Hydroxylases supplement hydroxyl groups to its substrates. Peroxidases catalyze the reduction of hydrogen peroxide. Oxygenases contain takes place in replacement of oxygen from molecular oxygen into organic substrates. Reductases catalyze reductions can work like an oxidases [7].
Oxidoreductases enzymes have an important role in both aerobic and anaerobic metabolisms. Aerobic and anaerobic metabolisms are included in amino acid metabolism, tricarboxylic acid cycle, glycolysis, and oxidative phosphorylation.
Oxidoreductases are classified as EC 1 in the EC number classification of enzymes. Oxidoreductases can be further classified into 22 subclasses [8]:
EC 1.1 includes oxidoreductases that act on the CH-OH group of donors (alcohol oxidoreductases)
EC 1.2 includes oxidoreductases that act on the aldehyde or oxo group of donors
EC 1.3 includes oxidoreductases that act on the CH-CH group of donors (CH-CH oxidoreductases)
15
EC 1.4 includes oxidoreductases that act on the CH-NH2 group of donors (Amino acid
oxidoreductases, Monoamine oxidase)
EC 1.5 includes oxidoreductases that act on CH-NH group of donors EC 1.6 includes oxidoreductases that act on NADH or NADPH
EC 1.7 includes oxidoreductases that act on other nitrogenous compounds as donors EC 1.8 includes oxidoreductases that act on a sulfur group of donors
EC 1.9 includes oxidoreductases that act on a heme group of donors
EC 1.10 includes oxidoreductases that act on diphenols and related substances as donors EC 1.11 includes oxidoreductases that act on peroxide as an acceptor (peroxidases) EC 1.12 includes oxidoreductases that act on hydrogen as donors
EC 1.13 includes oxidoreductases that act on single donors with incorporation of molecular oxygen (oxygenases)
EC 1.14 includes oxidoreductases that act on paired donors with incorporation of molecular oxygen
EC 1.15 includes oxidoreductases that act on superoxide radicals as acceptors EC 1.16 includes oxidoreductases that oxidize metal ions
EC 1.17 includes oxidoreductases that act on CH or CH2 groups
EC 1.18 includes oxidoreductases that act on iron-sulfur proteins as donors EC 1.19 includes oxidoreductases that act on reduced flavodoxin as a donor EC 1.20 includes oxidoreductases that act on phosphorus or arsenic in donors EC 1.21 includes oxidoreductases that act on X-H and Y-H to form an X-Y bond EC 1.97 includes other oxidoreductases
Class.2. Transferases
Transferases catalyze transfer (movement) of a functional group from one molecule to the other. Transferases’s functional groups are different such that they can contain phosphate, glycosyl and methyl groups. The reactions correspond to the following;
AX + B → A + BX
where A is the donor, B is the acceptor and X is functional group. Transferases got two sub-groups kinases and deaminases.
16
Kinases take place in catalysing the transfer of phosphate groups in phosphorylation. Therefore, they are effective on different molecules, for example nucleotides, lipids and carbohydrates. The most important kinases are kinases that are used in signal transduction and in controlling complex processes within the cell. Kinases involve more than 500 different types in the human body. Deaminases are another group of transferases. They catalyze the transfer of amino groups.
Transferases are classified as EC 2 in the EC number classification. Transferases can be further classified into nine subclasses [8]:
EC 2.1 includes enzymes that transfer one-carbon groups (methyltransferase) EC 2.2 includes enzymes that transfer aldehyde or ketone groups
EC 2.3 includes acyltransferases EC 2.4 includes glycosyltransferases
EC 2.5 includes enzymes that transfer alkyl or aryl groups, other than methyl groups EC 2.6 includes enzymes that transfer nitrogenous groups (transaminase)
EC 2.7 includes enzymes that transfer phosphorus-containing groups EC 2.8 includes enzymes that transfer sulfur-containing groups EC 2.9 includes enzymes that transfer selenium-containing groups
Class 3. Hydrolases
Hydrolases catalyze hydrolysis reactions. They allocate substrates with addition of H2O at the
point of cleavage. Hydrolases catalyze reactions correspond to the following;
A – B + H2O → A – OH + B – H
Hydrolases involve various subclasses, such as lipases for fatty acids and glycerol for cleavage of ester bonds, nucleases for the hydrolysis of nucleic acids, proteases for proteins, etc.
Hydrolases are classified as EC 3 in the EC number classification of enzymes. Hydrolases can be further classified into several subclasses, based upon the bonds they act upon [8]:
EC 3.1: ester bonds (esterases: nucleases, phosphodiesterases, lipase, phosphatase) EC 3.2: sugars (DNA glycosylases, glycoside hydrolase)
17
EC 3.3: ether bonds
EC 3.4: peptide bonds (Proteases/peptidases)
EC 3.5: carbon-nitrogen bonds, other than peptide bonds
EC 3.6 acid anhydrides (acid anhydride hydrolases, including helicases and GTPase) EC 3.7 carbon-carbon bonds EC 3.8 halide bonds EC 3.9: phosphorus-nitrogen bonds EC 3.10: sulphur-nitrogen bonds EC 3.11: carbon-phosphorus bonds EC 3.12: sulfur-sulfur bonds EC 3.13: carbon-sulfur bonds
Class 4. Ligases
Ligases catalyse ligation. Since this catalysis requires chemical potential energy, the reaction is incorporated with the hydrolysis of a diphosphate bond in a nucleotide triphosphate such as ATP. The most important hydrolases enzyme is DNA ligase enzyme which catalyses the ligation between breaks in DNA by forming a phosphodiester bond. This enzyme involves different forms. These forms involve in catalysation of different break mechanisms.
For example DNA ligase I repairs single stranded breaks expiloiting the complementary strand as a template, like in DNA replication of the lagging strand. This reaction requires ATP too.
Ligases are classified as EC 6 in the EC number classification of enzymes. Ligases can be further classified into six subclasses [8]:
EC 6.1 includes ligases used to form carbon-oxygen bonds EC 6.2 includes ligases used to form carbon-sulfur bonds EC 6.3 includes ligases used to form carbon-nitrogen bonds EC 6.4 includes ligases used to form carbon-carbon bonds EC 6.5 includes ligases used to form phosphoric ester bonds EC 6.6 includes ligases used to form nitrogen-metal bonds
18
Lyases catalyze lysis reaction. Lysis reactions are a type of elimination reaction but are not hydrolytic or oxidative. These reactions catalyse an addition reaction, where a substrate is added to a double bond. These reactions are usually applied to as synthase enzymes.
A lyase reaction would be;
ATP ↔ cAMP + PPi Lyases involve oxalate decarboxylase and isocitrate lyase.
Oxalate decarboxylase catalysations are chemical reactions. For example; a decarboxylase or a carboxy lyase, cleaves C-C bonds.
Oxalate + H+ ↔ formate + carbon dioxide
This reaction involved in glycoxylate and dicarboxylate metabolism.
Another group of lyases are Isocitrate lyase, which is involved in the glycoxylate cycle. This enzyme converts isocitrate to succinate.
Lyases are classified as EC 4 in the EC number classification of enzymes. Lyases can be further classified into seven subclasses [8]:
EC 4.1 includes lyases that cleave carbon-carbon bonds, such as decarboxylases (EC 4.1.1), aldehyde lyases (EC 4.1.2), oxo acid lyases(EC 4.1.3) and others (EC 4.1.99) EC 4.2 includes lyases that cleave carbon-oxygen bonds, such as dehydratases
EC 4.3 includes lyases that cleave carbon-nitrogen bonds EC 4.4 includes lyases that cleave carbon-sulfur bonds EC 4.5 includes lyases that cleave carbon-halide bonds
EC 4.6 includes lyases that cleave phosphorus-oxygen bonds, such as adenylate cyclase and guanylate cyclase
EC 4.99 includes other lyases, such as ferrochelatase
19
Isomerases enzymes catalyses structural changes within a molecule. Isomerases catalyze reactions correspond to the following,
A → B where B is an isomer of A.
Isomerases involved in many biochemical pathways, for example; the citric acid and the glycolitic pathway. They are included triose phosphate isomerise, photoisomerase and bisphosphoglycerate mutase. Isomerases can help in the conversion of citrate to isocitrate in the citric acid cycle. They can catalyze phosphorylation reaction pathways throughout the Krebs Cycle by preparing the molecule for oxidation states. Isomerases have the same chemical formula but diverge in their structural formula. Therefore, Isomerases splits into various classes, for example geometrically, stereoisomerically, and as enantiomers. The most important isomerases are alanine racemase and gluco-6-phosphate isomerase. Alanin racemase converts the amino acid alanine between its two optical isomers. Alanine racemase is needed in both aspartate and alanine metabolism. Glucose-6-phosphate isomerise catalyses the conversion of glucose-6-phosphate to fructose-6-phosphate in the second step of glycolysis. Fructose and glucose are 6-carbon sugars, but these show a different structural arrangement. And glucose-6-phosphate enzyme interconverts the sugar between its two forms.
Isomerases have their own EC classification of enzymes: EC 5. Isomerases can be further classified into six subclasses [8]:
EC 5.1 includes enzymes that catalyze racemization (racemases) and epimerization EC 5.2 includes enzymes that catalyze the isomerization of geometric isomers EC 5.3 includes intramolecular oxidoreductases
EC 5.4 includes intramolecular transferases (mutases) EC 5.5 includes intramolecular lyases
EC 5.99 includes other isomerases (including topoisomerases)
20
2.1. Molecular Docking
Docking provides an understanding of the molecular interactions which take place between a ligand and the corresponding receptor. Docking procedure involves three components: identification of the binding site, a search algorithm to efficiently sample the correct relative orientation and conformation of ligands, and a scoring function. Molecular docking is a well established computational technique which predicts the interaction energy between two molecules. This technique mainly incorporates algorithms like molecular dynamics, Monte Carlo stimulation, fragment based search methods. Molecular docking studies are used to determine the interaction of two molecules and to find the best orientation of ligand which would form a complex with overall minimum energy. The small molecule, known as ligand usually fits within protein’s cavity which is predicted by the search algorithm. These protein cavities become active when they come in contact with any external compounds and are thus called as active sites.
2.1.1 AutoDock
AutoDock (Automated Docking of Flexible Ligands to Receptors) is the software by which docking studies carried out. AutoDock is a search tool with a grid-based method of energy evaluation. AutoDock uses Lamarckian genetic algorithm (LGA) for docking ligand and protein binding [11]. LGA is the most competent search method. The LGA combined a genetic algorithm (GA) for global searching and a local search (LS) method to render energy minimization. Mutation and crossover form in genotypic space, while phenotypic space is decided by the energy function to be optimized. Energy minimization (local sampling) is performed after genotypic changes have been made to the population (global sampling) in phenotypic space, which is conceptually similar to Monte Carlo (MC) minimization.
AutoDock program creates a grid map and compute its components by using AutoGrid program. Grid file is the imaginary box, within the range of volume where given ligand searches for best possible binding characteristics with lowest energy and high affinity.
21
Figure 2. The main features of a grid map is illustrated.
Grid point spacing is a variable quantity from 0.2Å to 1.0Å, even though the default is 0.375Å. In the studies, the user have to define an even number of grid points in each dimension (nx, ny and nz), because AutoGrid will add a central point (nx+1, ny+1 and nz+1),
and AutoDock requires totally an odd number of grid points. For each grid point within the grid map stores the potential energy of a ‘probe’ atom which is summed over all protein atoms within a nonbonded cutoff radius of 8 Å. The final grid of energies provides a lookup table for the rapid evaluation of interaction energies. Separate grids are calculated for each type of atom in the ligand, as well as a dispersion/repulsion term and added on electrostatic potential grid. These grids are read into memory at the start of the docking job, and then sampled by the ligand's atoms type using trilinear interpolation. Trilinear interpolation compute interaction energy between ligand and target [229].
The docking program AutoDock version 1.5.4 implemented a semiempirical scoring function which is rewritten by using the thermodynamic cycle on the basis of Wesson and Eisenberg.
22
This scoring function involves five terms, as in equation 1:
The five ∆G terms on the right-hand side are coefficients empirically determined using linear regression analysis from a set of 4974 protein-ligand complexes with known binding constants.
The AutoDock force-field parameters are a subset of those of AMBER (Weiner et al., 1984). For a given probe atom, i, and all protein atoms, j, within a nonbonded cut-off distance (Rcut). Van der Waals energies are calculated using a Lennard-Jones 12-6 potential:
where Rij is the distance between interacting atoms. The coefficients Aij and Bij are calculated
from well depths (Ɛxx) and equilibrium contact distances (
r
eqm,XX) between the nuclei of twolike atoms, X.
Compounding rules for the Van der Waals radius, reqm, and the well depth, Ɛ, for two different atoms X and Y, are:
23
where X and Y are different atom types. Accept that the potential is a minimum at
r
eqm with avalue of -Ɛ, then:
Hydrogen bonds are considered with a traditional 12-10 potential:
Coefficients Cij and Dij may similarly be calculated for hydrogen bonds using the assumption
of minimum energy,-Ɛ, at internuclear separation, reqm.
Furthermore for the atomic affinity grid maps, AutoDock need an electrostatic-potential grid map. Partial atomic charges have to be attributed to the macromolecule. The electrostatic grid can be generated by AutoGrid tool. AutoGrid calculates electrostatic interaction energy grid maps using Coulombic interactions between the macromolecule and a probe of charge e, +1.60219x10⁻¹⁹ C; there is no distance cutoff used for electrostatic interactions. The latter uses a sigmoidal distance dependent dielectric function based on the work of Mehler and Solmajer.
24
where: B = Ɛ0 -A, with Ɛ0 = 78.4 (the dielectric constant of bulk water at 25 °C),
A = -8.5525, k = 7.7839, and λ = 0.003627 Å-1. Electrostatic-potential grids are calculated with a probe carrying a single positive charge. The electrostatic interaction energy of each atom in the ligand is provided by multiplying the trilinearly interpolated electrostatic potential taken from this grid with the partial charge of the atom.
Furthermore, the first term in the right-hand side of equation 1 is the contribution of Van der Waals force between the ligand and the acceptor to binding free energy using a Lennard-Jones 12-6 potential. The second term is the contribution from hydrogen bond using a Lennard-Jones 12-10 potential, the hydrogen bonding term has directionality owing to the
E(t) factor which is a function of the angle. The third term is that of electrostatic potential; the
fourth is the change of binding free energy aroused by the frozen rotary free energy in ligands; and the last term accounts for desolvation effects. Autodock uses a pairwise, volume-based method to estimate the buriedness of the atom, which is multiplied by the atomic solvation parameter for that atom. This function was evaluated based on precalculated grids for the receptor contributions, and was derived based on 4974 protein-ligand complexes.
25
2.2. PRE-DOCKING
2.2.1. Preparation of ligand and protein structures for docking 2.2.1.1. Preparation of ligand structures
The ligand structures were taken from the research group which performs the kinetic and in silico analysis on inhibition of carbonic anhydrases (CA) at Calgary University by Durdagi et. al. [2,3]. Therefore, the coordinate files were ready to use for docking studies aimed in this thesis work. The structures of all the ligands used in this thesis study were given above in the introduction part in Figure 1. Furthermore, the results of this work and the results of Durdagi et.al. were compared in the results and discussion chapter.
2.2.1.2. Preparation of protein structures
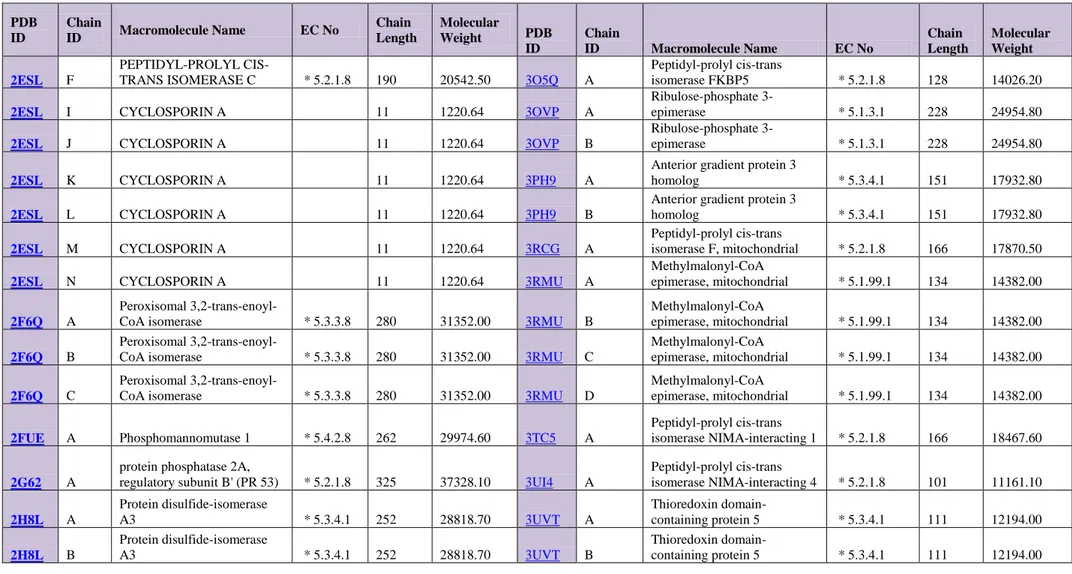
229 protein X-ray crystal structures from the Protein Data Bank [1] were downloaded. The classes and the PDB structure identifiers (PDB ID) of the 229 protein structures used for docking are given below in Table 1. Proteins can be classified with respect to the types of organisms like, Homo Sapiens etc. In this study proteins with X-Ray Resolution less than 2Å were selected. Enzymes were classified as Lyases, Isomerases, Ligases, Hydrolases, Transferases, and the different colors applied to different columns with respect to these classification in Table 1. To get rid of the statistical bias that may occur because of the homology between proteins, similar sequences at % 90 identities were removed [1].
After selecting and downloading the protein structures from the database, several procedures were applied in order to make these structures ready for docking. Within these procedures first of all water molecules were removed. Following that bond orders were assigned and hydrogens atoms necessary for docking were added. Then, restrained minimization of hydrogen atoms was performed. After that, an optimization of hydrogen bonds was applied. Water molecules in the active site were also removed to facilitate more space for the ligand binding. The proteins converted into pqr from pdb via PDB2PQR server. As a Forcefield PARSE options selected to ensure that new atoms are not rebuilt too close to existing atoms, and then, the hydrogen bonding network were optimized. Finally, to assign protonation states at pH 7, PROPKA was used. [228]
26
2.2.1.2.1. PQR Format
PDB2PQR is a Python software package that automates many of the common tasks of preparing structures for continuum electrostatics calculations, providing a platform-independent utility for converting protein files in PDB format to PQR format. These tasks include adding a limited number of missing heavy atoms to biomolecular structures, determining side-chain pKas, placing missing hydrogens, optimizing the protein for favorable hydrogen bonding [228].
27
Table 1. The classes and the PDB structure identifier (PDB ID) of the 229 docked proteins
28
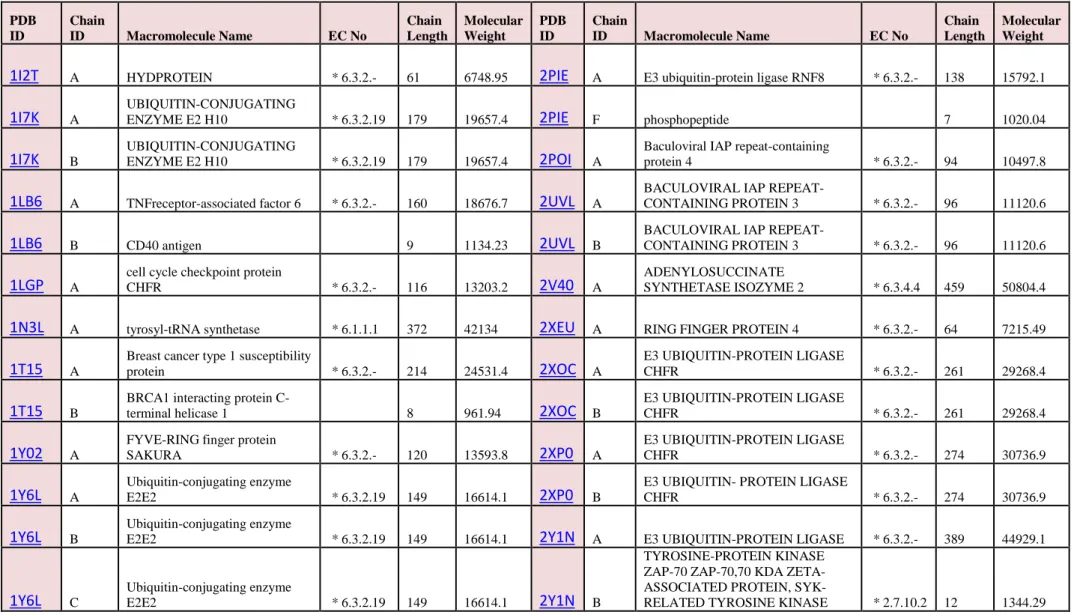
Table 2: Basic characteristics of selected Ligases proteins
PDB ID Chain ID Macromolecule Name EC No Chain Length Molecular Weight PDB ID Chain ID Macromolecule Name EC No Chain Length Molecular Weight
1I2T A HYDPROTEIN * 6.3.2.- 61 6748.95 2PIE A E3 ubiquitin-protein ligase RNF8 * 6.3.2.- 138 15792.1
1I7K A
UBIQUITIN-CONJUGATING
ENZYME E2 H10 * 6.3.2.19 179 19657.4 2PIE F phosphopeptide 7 1020.04
1I7K B
UBIQUITIN-CONJUGATING
ENZYME E2 H10 * 6.3.2.19 179 19657.4 2POI A
Baculoviral IAP repeat-containing
protein 4 * 6.3.2.- 94 10497.8
1LB6 A TNFreceptor-associated factor 6 * 6.3.2.- 160 18676.7 2UVL A
BACULOVIRAL IAP
REPEAT-CONTAINING PROTEIN 3 * 6.3.2.- 96 11120.6
1LB6 B CD40 antigen 9 1134.23 2UVL B
BACULOVIRAL IAP
REPEAT-CONTAINING PROTEIN 3 * 6.3.2.- 96 11120.6
1LGP A
cell cycle checkpoint protein
CHFR * 6.3.2.- 116 13203.2 2V40 A
ADENYLOSUCCINATE
SYNTHETASE ISOZYME 2 * 6.3.4.4 459 50804.4
1N3L A tyrosyl-tRNA synthetase * 6.1.1.1 372 42134 2XEU A RING FINGER PROTEIN 4 * 6.3.2.- 64 7215.49
1T15 A
Breast cancer type 1 susceptibility
protein * 6.3.2.- 214 24531.4 2XOC A
E3 UBIQUITIN-PROTEIN LIGASE
CHFR * 6.3.2.- 261 29268.4
1T15 B
BRCA1 interacting protein
C-terminal helicase 1 8 961.94 2XOC B
E3 UBIQUITIN-PROTEIN LIGASE
CHFR * 6.3.2.- 261 29268.4
1Y02 A
FYVE-RING finger protein
SAKURA * 6.3.2.- 120 13593.8 2XP0 A E3 UBIQUITIN-PROTEIN LIGASE CHFR * 6.3.2.- 274 30736.9 1Y6L A Ubiquitin-conjugating enzyme E2E2 * 6.3.2.19 149 16614.1 2XP0 B
E3 UBIQUITIN- PROTEIN LIGASE
CHFR * 6.3.2.- 274 30736.9
1Y6L B
Ubiquitin-conjugating enzyme
E2E2 * 6.3.2.19 149 16614.1 2Y1N A E3 UBIQUITIN-PROTEIN LIGASE * 6.3.2.- 389 44929.1
1Y6L C
Ubiquitin-conjugating enzyme
E2E2 * 6.3.2.19 149 16614.1 2Y1N B
TYROSINE-PROTEIN KINASE ZAP-70 ZAP-70,70 KDA ZETA-ASSOCIATED PROTEIN,
29
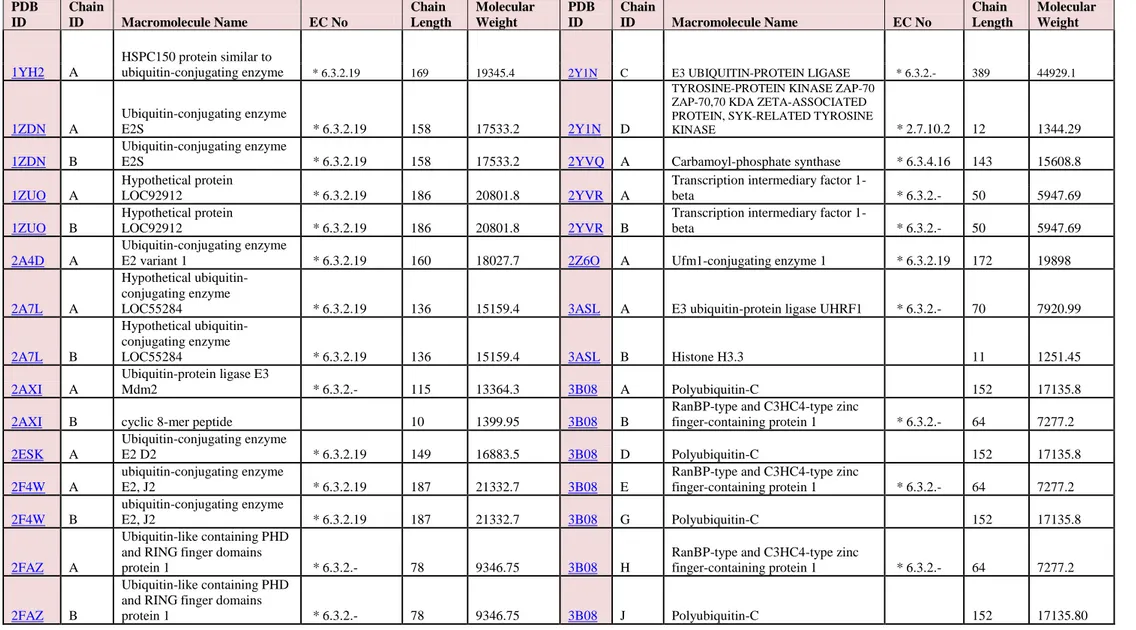
Table 2. Basic characteristics of selected Ligases proteins continued
PDB ID Chain ID Macromolecule Name EC No Chain Length Molecular Weight PDB ID Chain ID Macromolecule Name EC No Chain Length Molecular Weight A HSPC150 protein similar to
ubiquitin-conjugating enzyme * 6.3.2.19 169 19345.4 2Y1N C E3 UBIQUITIN-PROTEIN LIGASE * 6.3.2.- 389 44929.1
1YH2
1ZDN A
Ubiquitin-conjugating enzyme
E2S * 6.3.2.19 158 17533.2 2Y1N D
TYROSINE-PROTEIN KINASE ZAP-70 ZAP-70,70 KDA ZETA-ASSOCIATED PROTEIN, SYK-RELATED TYROSINE
KINASE * 2.7.10.2 12 1344.29
1ZDN B
Ubiquitin-conjugating enzyme
E2S * 6.3.2.19 158 17533.2 2YVQ A Carbamoyl-phosphate synthase * 6.3.4.16 143 15608.8
A
Hypothetical protein
LOC92912 * 6.3.2.19 186 20801.8 2YVR A
Transcription intermediary factor
1-beta * 6.3.2.- 50 5947.69
1ZUO
1ZUO B
Hypothetical protein
LOC92912 * 6.3.2.19 186 20801.8 2YVR B
Transcription intermediary factor
1-beta * 6.3.2.- 50 5947.69
2A4D A
Ubiquitin-conjugating enzyme
E2 variant 1 * 6.3.2.19 160 18027.7 2Z6O A Ufm1-conjugating enzyme 1 * 6.3.2.19 172 19898
2A7L A
Hypothetical ubiquitin-conjugating enzyme
LOC55284 * 6.3.2.19 136 15159.4 3ASL A E3 ubiquitin-protein ligase UHRF1 * 6.3.2.- 70 7920.99
2A7L B
Hypothetical ubiquitin-conjugating enzyme
LOC55284 * 6.3.2.19 136 15159.4 3ASL B Histone H3.3 11 1251.45
2AXI A
Ubiquitin-protein ligase E3
Mdm2 * 6.3.2.- 115 13364.3 3B08 A Polyubiquitin-C 152 17135.8
2AXI B cyclic 8-mer peptide 10 1399.95 3B08 B
RanBP-type and C3HC4-type zinc
finger-containing protein 1 * 6.3.2.- 64 7277.2 2ESK A Ubiquitin-conjugating enzyme E2 D2 * 6.3.2.19 149 16883.5 3B08 D Polyubiquitin-C 152 17135.8 2F4W A ubiquitin-conjugating enzyme E2, J2 * 6.3.2.19 187 21332.7 3B08 E
RanBP-type and C3HC4-type zinc
finger-containing protein 1 * 6.3.2.- 64 7277.2 2F4W B ubiquitin-conjugating enzyme E2, J2 * 6.3.2.19 187 21332.7 3B08 G Polyubiquitin-C 152 17135.8 2FAZ A Ubiquitin-like containing PHD and RING finger domains
protein 1 * 6.3.2.- 78 9346.75 3B08 H
RanBP-type and C3HC4-type zinc
finger-containing protein 1 * 6.3.2.- 64 7277.2
2FAZ B
Ubiquitin-like containing PHD and RING finger domains
30
Table 2. Basic characteristics of selected Ligases proteins continued
PDB ID Chain ID Macromolecule Name EC No Chain Length Molecular Weight PDB ID Chain ID Macromolecule Name EC No Chain Length Molecular Weight
2FZP A ring finger protein 41 isoform 1 * 6.3.2.- 144 16172.5 3B08 K
RanBP-type and C3HC4-type
zinc * 6.3.2.- 64 7277.2
2I3H
A
Baculoviral IAP
repeat-containing protein 7 * 6.3.2.- 133 14977.7 3B76 A E3 ubiquitin-protein ligase LNX * 6.3.2.- 118 12824.6
2I3H B
Baculoviral IAP
repeat-containing protein 7 * 6.3.2.- 133 14977.7 3B76 B E3 ubiquitin-protein ligase LNX * 6.3.2.- 118 12824.6
2I3H C AVPW peptide 4 471.55 3B7Y A
E3 ubiquitin-protein ligase
NEDD4 * 6.3.2.- 153 17750.7
2I3H D AVPW peptide 4 471.55 3B7Y B
E3 ubiquitin-protein ligase
NEDD4 * 6.3.2.- 153 17750.7
2JKU A
PROPIONYL-COA CARBOXYLASE ALPHA
CHAIN, MITOCHONDRIAL * 6.4.1.3 94 9940.31 3BI7 A
E3 ubiquitin-protein ligase
UHRF1 * 6.3.2.- 212 23910.5
2NQ3 A
Itchy homolog E3 ubiquitin
protein ligase * 6.3.2.- 173 19201.9 3BUX A
13-meric peptide from Hepatocyte growth factor
receptor * 2.7.10.1 13 1595.55
2NSQ A
E3 ubiquitin-protein ligase
NEDD4-like protein * 6.3.2.- 155 17935.7 3BUX B E3 ubiquitin-protein ligase CBL * 6.3.2.- 329 38192.5
2NTE A
BRCA1-associated RING
domain protein 1 * 6.3.2.- 210 24103.1 3BUX C
13-meric peptide from Hepatocyte growth factor
receptor * 2.7.10.1 13 1595.55
2NTE B
BRCA1-associated RING
domain protein 1 * 6.3.2.- 210 24103.1 3BUX D E3 ubiquitin-protein ligase CBL * 6.3.2.- 329 38192.5
2OOA A E3 ubiquitin-protein ligase CBL-B * 6.3.2.- 52 5703.34 3BZH A Ubiquitin-conjugating enzyme E2 E1 * 6.3.2.19 194 21487.4 2OOA B E3 ubiquitin-protein ligase CBL-B * 6.3.2.- 52 5703.34 3C5E A Acyl-coenzyme A synthetase ACSM2A, mitochondrial precursor * 6.2.1.2 570 63335.2 2PB7 A E3 ubiquitin-protein ligase UHRF1 * 6.3.2.- 239 26792
31
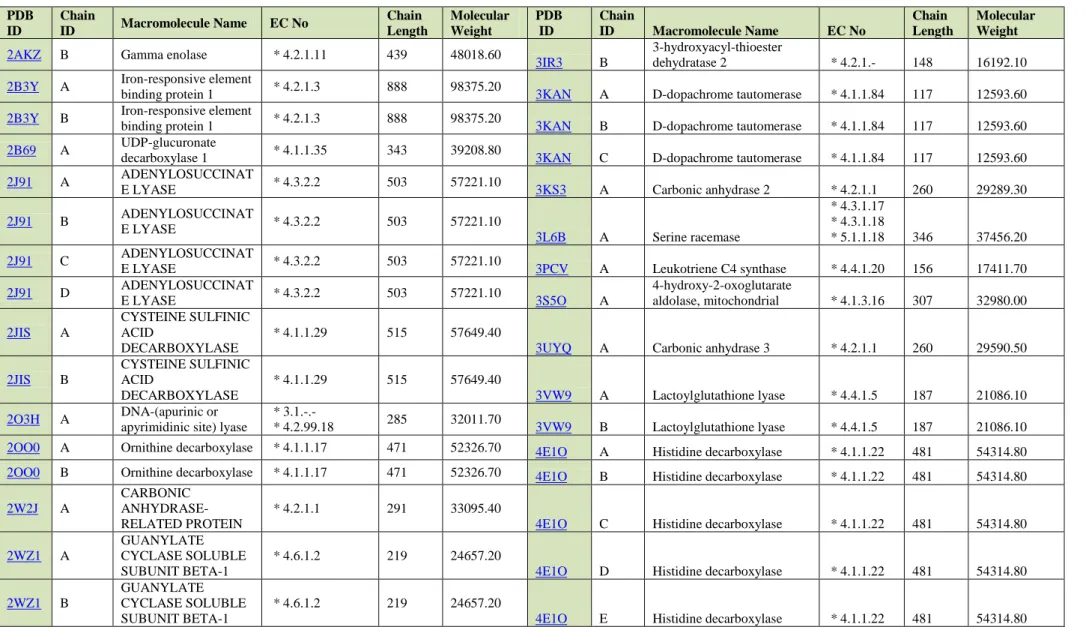
Table 3. Basic characteristics of selected Lyases proteins
PDB ID Chain ID Macromolecule Name EC No Chain Length Molecular Weight PDB ID Chain ID Macromolecule Name EC No Chain Length Molecular Weight 1ALD A ALDOLASE A * 4.1.2.13 363 39339.10 3D0N A Carbonic anhydrase 13 * 4.2.1.1 264 29626.50
1HCB A CARBONIC ANHYDRASE I * 4.2.1.1 260 28775.20 3D0N B Carbonic anhydrase 13 * 4.2.1.1 264 29626.50
1IKT A ESTRADIOL 17
BETA-DEHYDROGENASE 4 * 4.2.1.107 * 4.2.1.119 120 13264.60 3EO4 A Uncharacterized protein MJ1062 164 19684.70 1JD0 A CARBONIC ANHYDRASE XII * 4.2.1.1 263 29857.40 3EO4 B Uncharacterized protein MJ1062 164 19684.70 1JD0 B CARBONIC ANHYDRASE XII * 4.2.1.1 263 29857.40 3EO4 C Uncharacterized protein MJ1062 164 19684.70 1JL0 A S-DENOSYLMETHIONINE DECARBOXYLASE PROENZYME * 4.1.1.50 334 38298.80 3EO4 D Uncharacterized protein MJ1062 164 19684.70 1JL0 B S-DENOSYLMETHIONINE DECARBOXYLASE PROENZYME * 4.1.1.50 334 38298.80 3EP6 A S-adenosylmethionine
decarboxylase alpha chain * 4.1.1.50 260 29887.40
1JR2 A UROPORPHYRINOGEN-III
SYNTHASE * 4.2.1.75 286 31189.60 3EP6 B
S-adenosylmethionine
decarboxylase beta chain * 4.1.1.50 67 7694.65
1JR2 B UROPORPHYRINOGEN-III SYNTHASE * 4.2.1.75 286 31189.60 3EWY A Orotidine-5'-phosphate decarboxylase * 4.1.1.23 260 28317.90 1KHB A Phosphoenolpyruvate carboxykinase, cytosolic (GTP) * 4.1.1.32 625 69530.20
3FE4 A Carbonic anhydrase 6 * 4.2.1.1 278 31950.80
1R3S A Uroporphyrinogen
Decarboxylase * 4.1.1.37 367 40774.10 3FE4 B Carbonic anhydrase 6 * 4.2.1.1 278 31950.80
1T2A A GDP-mannose 4,6 dehydratase * 4.2.1.47 375 42699.70 3FVS A Kynurenine--oxoglutarate transaminase 1 * 2.6.1.64 * 2.6.1.7 * 4.4.1.13 422 48158.50 1T2A B GDP-mannose 4,6 dehydratase * 4.2.1.47 375 42699.70 3FVS B Kynurenine--oxoglutarate transaminase 1 * 2.6.1.64 * 2.6.1.7 * 4.4.1.13 422 48158.50 1T2A C GDP-mannose 4,6
dehydratase * 4.2.1.47 375 42699.70 3FW3 A Carbonic anhydrase 4 * 4.2.1.1 266 30364.70
1T2A D GDP-mannose 4,6
dehydratase * 4.2.1.47 375 42699.70 3FW3 B Carbonic anhydrase 4 * 4.2.1.1 266 30364.70
2AKZ A Gamma enolase * 4.2.1.11 439 48018.60
3IR3 A
3-hydroxyacyl-thioester
32
Table 3. Basic characteristics of selected Lyases proteins continued
PDB ID Chain ID Macromolecule Name EC No Chain Length Molecular Weight PDB ID Chain ID Macromolecule Name EC No Chain Length Molecular Weight
2AKZ B Gamma enolase * 4.2.1.11 439 48018.60
3IR3 B
3-hydroxyacyl-thioester
dehydratase 2 * 4.2.1.- 148 16192.10
2B3Y A Iron-responsive element
binding protein 1 * 4.2.1.3 888 98375.20 3KAN A D-dopachrome tautomerase * 4.1.1.84 117 12593.60
2B3Y B Iron-responsive element
binding protein 1 * 4.2.1.3 888 98375.20 3KAN B D-dopachrome tautomerase * 4.1.1.84 117 12593.60
2B69 A UDP-glucuronate
decarboxylase 1 * 4.1.1.35 343 39208.80 3KAN C D-dopachrome tautomerase * 4.1.1.84 117 12593.60
2J91 A ADENYLOSUCCINAT
E LYASE * 4.3.2.2 503 57221.10 3KS3 A Carbonic anhydrase 2 * 4.2.1.1 260 29289.30
2J91 B ADENYLOSUCCINAT E LYASE * 4.3.2.2 503 57221.10 3L6B A Serine racemase * 4.3.1.17 * 4.3.1.18 * 5.1.1.18 346 37456.20 2J91 C ADENYLOSUCCINAT
E LYASE * 4.3.2.2 503 57221.10 3PCV A Leukotriene C4 synthase * 4.4.1.20 156 17411.70
2J91 D ADENYLOSUCCINAT E LYASE * 4.3.2.2 503 57221.10 3S5O A 4-hydroxy-2-oxoglutarate aldolase, mitochondrial * 4.1.3.16 307 32980.00 2JIS A CYSTEINE SULFINIC ACID DECARBOXYLASE * 4.1.1.29 515 57649.40
3UYQ A Carbonic anhydrase 3 * 4.2.1.1 260 29590.50
2JIS B CYSTEINE SULFINIC ACID DECARBOXYLASE * 4.1.1.29 515 57649.40 3VW9 A Lactoylglutathione lyase * 4.4.1.5 187 21086.10 2O3H A DNA-(apurinic or apyrimidinic site) lyase
* 3.1.-.-
* 4.2.99.18 285 32011.70 3VW9 B Lactoylglutathione lyase * 4.4.1.5 187 21086.10
2OO0 A Ornithine decarboxylase * 4.1.1.17 471 52326.70 4E1O A Histidine decarboxylase * 4.1.1.22 481 54314.80
2OO0 B Ornithine decarboxylase * 4.1.1.17 471 52326.70 4E1O B Histidine decarboxylase * 4.1.1.22 481 54314.80
2W2J A
CARBONIC ANHYDRASE-RELATED PROTEIN
* 4.2.1.1 291 33095.40
4E1O C Histidine decarboxylase * 4.1.1.22 481 54314.80
2WZ1 A
GUANYLATE CYCLASE SOLUBLE SUBUNIT BETA-1
* 4.6.1.2 219 24657.20
4E1O D Histidine decarboxylase * 4.1.1.22 481 54314.80
2WZ1 B
GUANYLATE CYCLASE SOLUBLE SUBUNIT BETA-1
* 4.6.1.2 219 24657.20
33
Table 3. Basic characteristics of selected Lyases proteins continued
PDB ID Chain ID Macromolecule Name EC No Chain Length Molecular Weight PDB ID Chain ID Macromolecule Name EC No Chain Length Molecular Weight
2XSX A BETA-ENOLASE * 4.2.1.11 435 47080.20 4E1O F Histidine decarboxylase * 4.1.1.22 481 54314.80
2XSX B BETA-ENOLASE * 4.2.1.11 435 47080.20 4H27 A L-serine dehydratase/L-threonine deaminase * 4.3.1.17 * 4.3.1.19 364 38710.00 3AQI A Ferrochelatase * 4.99.1.1 359 41067.70 3AQI B Ferrochelatase * 4.99.1.1 359 41067.70
3COG A Cystathionine gamma-lyase * 4.4.1.1 403 44336.10
3COG B Cystathionine gamma-lyase * 4.4.1.1 403 44336.10
3COG C Cystathionine gamma-lyase * 4.4.1.1 403 44336.10
34
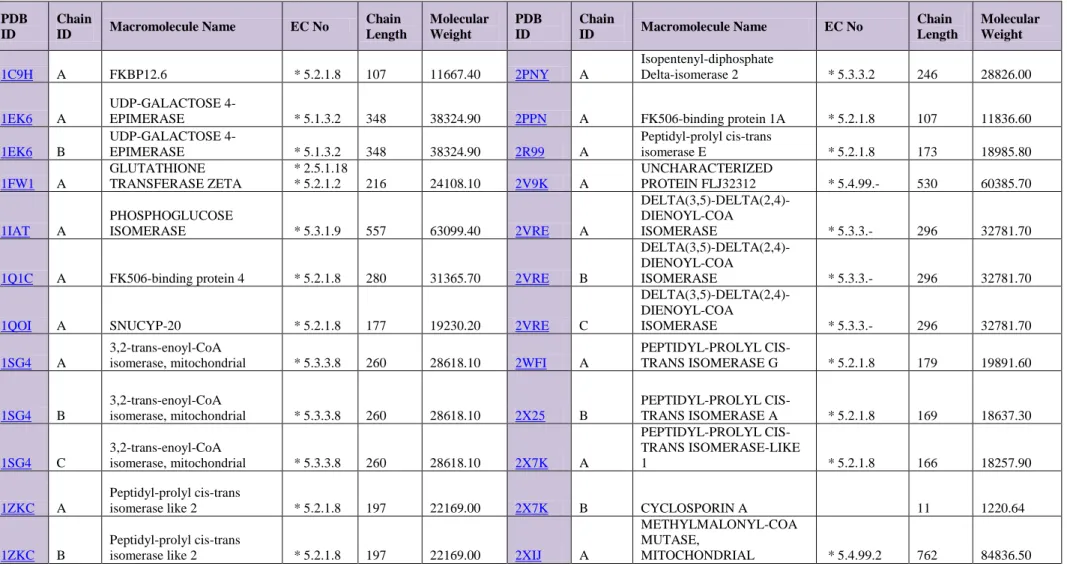
Table 4. Basic characteristics of selected Isomerases proteins
PDB ID Chain ID Macromolecule Name EC No Chain Length Molecular Weight PDB ID Chain ID Macromolecule Name EC No Chain Length Molecular Weight 1C9H A FKBP12.6 * 5.2.1.8 107 11667.40 2PNY A Isopentenyl-diphosphate Delta-isomerase 2 * 5.3.3.2 246 28826.00 1EK6 A UDP-GALACTOSE
4-EPIMERASE * 5.1.3.2 348 38324.90 2PPN A FK506-binding protein 1A * 5.2.1.8 107 11836.60
1EK6 B UDP-GALACTOSE 4-EPIMERASE * 5.1.3.2 348 38324.90 2R99 A Peptidyl-prolyl cis-trans isomerase E * 5.2.1.8 173 18985.80 1FW1 A GLUTATHIONE TRANSFERASE ZETA * 2.5.1.18 * 5.2.1.2 216 24108.10 2V9K A UNCHARACTERIZED PROTEIN FLJ32312 * 5.4.99.- 530 60385.70 1IAT A PHOSPHOGLUCOSE ISOMERASE * 5.3.1.9 557 63099.40 2VRE A DELTA(3,5)-DELTA(2,4)-DIENOYL-COA ISOMERASE * 5.3.3.- 296 32781.70
1Q1C A FK506-binding protein 4 * 5.2.1.8 280 31365.70 2VRE B
DELTA(3,5)-DELTA(2,4)-DIENOYL-COA
ISOMERASE * 5.3.3.- 296 32781.70
1QOI A SNUCYP-20 * 5.2.1.8 177 19230.20 2VRE C
DELTA(3,5)-DELTA(2,4)-DIENOYL-COA
ISOMERASE * 5.3.3.- 296 32781.70
1SG4 A
3,2-trans-enoyl-CoA
isomerase, mitochondrial * 5.3.3.8 260 28618.10 2WFI A
PEPTIDYL-PROLYL CIS-TRANS ISOMERASE G * 5.2.1.8 179 19891.60 1SG4 B 3,2-trans-enoyl-CoA isomerase, mitochondrial * 5.3.3.8 260 28618.10 2X25 B PEPTIDYL-PROLYL CIS-TRANS ISOMERASE A * 5.2.1.8 169 18637.30 1SG4 C 3,2-trans-enoyl-CoA isomerase, mitochondrial * 5.3.3.8 260 28618.10 2X7K A PEPTIDYL-PROLYL CIS-TRANS ISOMERASE-LIKE 1 * 5.2.1.8 166 18257.90 1ZKC A Peptidyl-prolyl cis-trans
isomerase like 2 * 5.2.1.8 197 22169.00 2X7K B CYCLOSPORIN A 11 1220.64
1ZKC B
Peptidyl-prolyl cis-trans
isomerase like 2 * 5.2.1.8 197 22169.00 2XIJ A
METHYLMALONYL-COA MUTASE,
35
Table 4. Basic characteristics of selected Isomerases proteins continued
PDB ID Chain ID Macromolecule Name EC No Chain Length Molecular Weight PDB ID Chain ID Macromolecule Name EC No Chain Length Molecular Weight 1ZXM A
DNA topoisomerase II, alpha
isozyme * 5.99.1.3 400 45661.00 3B6H A Prostacyclin synthase * 5.3.99.4 498 57272.30
1ZXM B
DNA topoisomerase II, alpha
isozyme * 5.99.1.3 400 45661.00 3B6H B Prostacyclin synthase * 5.3.99.4 498 57272.30
2A2N A
peptidylprolyl isomerase domain and WD repeat
containing 1 * 5.2.1.8 176 19498.10 3EY6 A FK506-binding protein 8 * 5.2.1.8 121 13068.10
2A2N B
peptidylprolyl isomerase domain and WD repeat
containing 1 * 5.2.1.8 176 19498.10 3I6C A
Peptidyl-prolyl cis-trans
isomerase NIMA-interacting 1 * 5.2.1.8 123 13662.30
2A2N C
peptidylprolyl isomerase domain and WD repeat
containing 1 * 5.2.1.8 176 19498.10 3I6C B Peptidyl-prolyl cis-trans isomerase NIMA-interacting 1 * 5.2.1.8 123 13662.30 2CVD A Glutathione-requiring prostaglandin D synthase * 2.5.1.18 * 5.3.99.2 198 23256.90 3ICH A Peptidyl-prolyl cis-trans isomerase B * 5.2.1.8 188 20736.00 2CVD B Glutathione-requiring prostaglandin D synthase * 2.5.1.18
* 5.3.99.2 198 23256.90 3IDV A Protein disulfide-isomerase A4 * 5.3.4.1 241 26837.50
2CVD C Glutathione-requiring prostaglandin D synthase * 2.5.1.18 * 5.3.99.2 198 23256.90 3IJJ A Macrophage migration inhibitory factor * 5.3.2.1 * 5.3.3.12 114 12355.20 2CVD D Glutathione-requiring prostaglandin D synthase * 2.5.1.18 * 5.3.99.2 198 23256.90 3IJJ B Macrophage migration inhibitory factor * 5.3.2.1 * 5.3.3.12 114 12355.20 2DHO A Isopentenyl-diphosphate delta-isomerase 1 * 5.3.3.2 235 27374.50 3IJJ C Macrophage migration inhibitory factor * 5.3.2.1 * 5.3.3.12 114 12355.20 2ESL A PEPTIDYL-PROLYL
CIS-TRANS ISOMERASE C * 5.2.1.8 190 20542.50 3L6B A Serine racemase
* 4.3.1.17 * 4.3.1.18 * 5.1.1.18 346 37456.20 2ESL B PEPTIDYL-PROLYL CIS-TRANS ISOMERASE C * 5.2.1.8 190 20542.50 3MDF A Peptidyl-prolyl cis-trans isomerase E * 5.2.1.8 85 9413.66 2ESL C PEPTIDYL-PROLYL CIS-TRANS ISOMERASE C * 5.2.1.8 190 20542.50 3MDF B Peptidyl-prolyl cis-trans isomerase E * 5.2.1.8 85 9413.66 2ESL D PEPTIDYL-PROLYL
CIS-TRANS ISOMERASE C * 5.2.1.8 190 20542.50 3O22 A Prostaglandin-H2 D-isomerase * 5.3.99.2 162 18089.40
2ESL E
PEPTIDYL-PROLYL
CIS-TRANS ISOMERASE C * 5.2.1.8 190 20542.50 3O5E A
Peptidyl-prolyl cis-trans
36
Table 4. Basic characteristics of selected Isomerases proteins continued
PDB ID Chain ID Macromolecule Name EC No Chain Length Molecular Weight PDB ID Chain ID Macromolecule Name EC No Chain Length Molecular Weight 2ESL F PEPTIDYL-PROLYL
CIS-TRANS ISOMERASE C * 5.2.1.8 190 20542.50 3O5Q A
Peptidyl-prolyl cis-trans
isomerase FKBP5 * 5.2.1.8 128 14026.20
2ESL I CYCLOSPORIN A 11 1220.64 3OVP A
Ribulose-phosphate
3-epimerase * 5.1.3.1 228 24954.80
2ESL J CYCLOSPORIN A 11 1220.64 3OVP B
Ribulose-phosphate
3-epimerase * 5.1.3.1 228 24954.80
2ESL K CYCLOSPORIN A 11 1220.64 3PH9 A
Anterior gradient protein 3
homolog * 5.3.4.1 151 17932.80
2ESL L CYCLOSPORIN A 11 1220.64 3PH9 B
Anterior gradient protein 3
homolog * 5.3.4.1 151 17932.80
2ESL M CYCLOSPORIN A 11 1220.64 3RCG A
Peptidyl-prolyl cis-trans
isomerase F, mitochondrial * 5.2.1.8 166 17870.50
2ESL N CYCLOSPORIN A 11 1220.64 3RMU A
Methylmalonyl-CoA
epimerase, mitochondrial * 5.1.99.1 134 14382.00
2F6Q A
Peroxisomal
3,2-trans-enoyl-CoA isomerase * 5.3.3.8 280 31352.00 3RMU B
Methylmalonyl-CoA
epimerase, mitochondrial * 5.1.99.1 134 14382.00
2F6Q B
Peroxisomal
3,2-trans-enoyl-CoA isomerase * 5.3.3.8 280 31352.00 3RMU C
Methylmalonyl-CoA
epimerase, mitochondrial * 5.1.99.1 134 14382.00
2F6Q C
Peroxisomal
3,2-trans-enoyl-CoA isomerase * 5.3.3.8 280 31352.00 3RMU D
Methylmalonyl-CoA epimerase, mitochondrial * 5.1.99.1 134 14382.00 2FUE A Phosphomannomutase 1 * 5.4.2.8 262 29974.60 3TC5 A Peptidyl-prolyl cis-trans isomerase NIMA-interacting 1 * 5.2.1.8 166 18467.60 2G62 A
protein phosphatase 2A,
regulatory subunit B' (PR 53) * 5.2.1.8 325 37328.10 3UI4 A
Peptidyl-prolyl cis-trans isomerase NIMA-interacting 4 * 5.2.1.8 101 11161.10 2H8L A Protein disulfide-isomerase A3 * 5.3.4.1 252 28818.70 3UVT A Thioredoxin domain-containing protein 5 * 5.3.4.1 111 12194.00 2H8L B Protein disulfide-isomerase A3 * 5.3.4.1 252 28818.70 3UVT B Thioredoxin domain-containing protein 5 * 5.3.4.1 111 12194.00
37
Table 4. Basic characteristics of selected Isomerases proteins continued
PDB ID Chain ID Macromolecule Name EC No Chain Length Molecular Weight PDB ID Chain ID Macromolecule Name EC No Chain Length Molecular Weight 2H8L C Protein disulfide-isomerase A3 * 5.3.4.1 252 28818.70 3UVT C Thioredoxin domain-containing protein 5 * 5.3.4.1 111 12194.00
2HE9 A NK-tumor recognition protein * 5.2.1.8 192 21219.40 3UVT D
Thioredoxin
domain-containing protein 5 * 5.3.4.1 111 12194.00
2HE9 B NK-tumor recognition protein * 5.2.1.8 192 21219.40 3UVT E
Thioredoxin domain-containing protein 5 * 5.3.4.1 111 12194.00 2HHJ A Bisphosphoglycerate mutase * 3.1.3.13 * 5.4.2.1 * 5.4.2.4 267 31197.60 4A35 A MITOCHONDRIAL ENOLASE SUPERFAMILY MEMBER 1 * 5.-.-.- 441 49567.60 2HHJ B Bisphosphoglycerate mutase * 3.1.3.13 * 5.4.2.1 * 5.4.2.4 267 31197.60 4DIP A Peptidyl-prolyl cis-trans isomerase FKBP14 * 5.2.1.8 125 14032.50 2HQ6 A
Serologically defined colon
cancer antigen 10 * 5.2.1.8 185 20579.10 4DIP B
Peptidyl-prolyl cis-trans isomerase FKBP14 * 5.2.1.8 125 14032.50 2JK2 A TRIOSEPHOSPHATE ISOMERASE * 5.3.1.1 250 26714.60 4DIP C Peptidyl-prolyl cis-trans isomerase FKBP14 * 5.2.1.8 125 14032.50 2JK2 B TRIOSEPHOSPHATE ISOMERASE * 5.3.1.1 250 26714.60 4DIP D Peptidyl-prolyl cis-trans isomerase FKBP14 * 5.2.1.8 125 14032.50 2OK3 A Peptidyl-prolyl cis-trans isomerase-like 3 * 5.2.1.8 161 18177.70 4DIP E Peptidyl-prolyl cis-trans isomerase FKBP14 * 5.2.1.8 125 14032.50
2PBC A FK506-binding protein 2 * 5.2.1.8 102 11182.90 4DIP F
Peptidyl-prolyl cis-trans
isomerase FKBP14 * 5.2.1.8 125 14032.50
2PBC B FK506-binding protein 2 * 5.2.1.8 102 11182.90 4DIP G
Peptidyl-prolyl cis-trans
isomerase FKBP14 * 5.2.1.8 125 14032.50
2PBC C FK506-binding protein 2 * 5.2.1.8 102 11182.90 4DIP H
Peptidyl-prolyl cis-trans
isomerase FKBP14 * 5.2.1.8 125 14032.50
2PBC D FK506-binding protein 2 * 5.2.1.8 102 11182.90 4DIP I
Peptidyl-prolyl cis-trans
isomerase FKBP14 * 5.2.1.8 125 14032.50
4DIP J
Peptidyl-prolyl cis-trans
38
Table 5. Basic characteristics of selected Transferases proteins
PDB ID Chain ID Macromolecule Name EC No Chain Length Molecular Weight PDB ID Chain ID Macromolecule Name EC No Chain Length Molecular Weight 1B4F A EPHB2 * 2.7.10.1 82 9401.84 1JDW A L-ARGININE\:GLYCINE AMIDINOTRANSFERASE * 2.1.4.1 423 48521.90
1B4F B EPHB2 * 2.7.10.1 82 9401.84 1JQE A Histamine N-Methyltransferase * 2.1.1.8 292 33345.30
1B4F C EPHB2 * 2.7.10.1 82 9401.84 1JQE B Histamine N-Methyltransferase * 2.1.1.8 292 33345.30
1B4F D EPHB2 * 2.7.10.1 82 9401.84 1JV1 A GlcNAc1P uridyltransferase isoform 1: AGX1 * 2.7.7.- 505 57096.70 1B4F E EPHB2 * 2.7.10.1 82 9401.84 1JV1 B GlcNAc1P uridyltransferase isoform 1: AGX1 * 2.7.7.- 505 57096.70 1B4F F EPHB2 * 2.7.10.1 82 9401.84 1K04 A
FOCAL ADHESION KINASE
1 * 2.7.10.2 162 17949.80 1B4F G EPHB2 * 2.7.10.1 82 9401.84 1K3Y A GLUTATHIONE S-TRANSFERASE A1 * 2.5.1.18 221 25539.10 1B4F H EPHB2 * 2.7.10.1 82 9401.84 1K3Y B GLUTATHIONE S-TRANSFERASE A1 * 2.5.1.18 221 25539.10 1BLX A CYCLIN-DEPENDENT KINASE 6 * 2.7.11.22 326 36987.70 1KGD A PERIPHERAL PLASMA MEMBRANE CASK * 2.7.11.1 180 20754.70
1BLX B P19INK4D 166 17832.50 1KWA A HCASK/LIN-2 PROTEIN * 2.7.11.1 88 10194.90
1BTK A
BRUTON'S TYROSINE
KINASE * 2.7.10.2 169 19929.10 1KWA B HCASK/LIN-2 PROTEIN * 2.7.11.1 88 10194.90
1BTK B
BRUTON'S TYROSINE
KINASE * 2.7.10.2 169 19929.10 1LS6 A aryl sulfotransferase * 2.8.2.1 295 34220.60
1BX4 A
PROTEIN (ADENOSINE
KINASE) * 2.7.1.20 345 38755.60 1M9Z A
TGF-BETA RECEPTOR TYPE
II * 2.7.11.30 111 12624.30 1BZY A HYPOXANTHINE-GUANINE PHOSPHORIBOSYLTR ANSFERASE * 2.4.2.8 217 24481.40 1MEO A Phosphoribosylglycinamide formyltransferase * 2.1.2.2 209 22679.10 1BZY B HYPOXANTHINE-GUANINE PHOSPHORIBOSYLTR ANSFERASE * 2.4.2.8 217 24481.40 1MFG A Erb-B2 INTERACTING PROTEIN 95 10292.70
39
Table 5. Basic characteristics of selected Transferases proteins continued
PDB ID Chain ID Macromolecule Name EC No Chain Length Molecular Weight PDB ID Chain ID Macromolecule Name EC No Chain Length Molecular Weight 1BZY C HYPOXANTHINE-GUANINE PHOSPHORIBOSYLTRAN SFERASE * 2.4.2.8 217 24481.40 1MFG B Erb-B2 carboxyl-terminal fragment * 2.7.10.1 9 1004.15 1BZY D HYPOXANTHINE-GUANINE PHOSPHORIBOSYLTRAN
SFERASE * 2.4.2.8 217 24481.40 1MP8 A focal adhesion kinase 1 * 2.7.10.2 281 32120.30
1CB0 A PROTEIN (5'-DEOXY-5'-METHYLTHIOADENOSIN E PHOSPHORYLASE) * 2.4.2.28 283 31277.30 1MQ4 A AURORA-RELATED KINASE 1 * 2.7.11.1 272 31440.40
1CZA N HEXOKINASE TYPE I * 2.7.1.1 917 102588.00 1NB9 A
hypothetical protein FLJ11149 * 2.7.1.26 147 16772.20 1E8Y A PHOSPHATIDYLINOSITO L 3-KINASE CATALYTIC SUBUNIT * 2.7.1.153 * 2.7.11.1 966 110757.00 1NM8 A Carnitine O-acetyltransferase * 2.3.1.7 616 69903.50 1EH6 A O6-ALKYLGUANINE-DNA ALKYLTRANSFERASE * 2.1.1.63 207 21672.10 1NN5 A Similar to deoxythymidylate
kinase (thymidylate kinase) * 2.7.4.9 215 24052.70
1EX0 A
COAGULATION FACTOR
XIII A CHAIN * 2.3.2.13 731 83313.70 1NTY A
Triple functional domain
protein * 2.7.11.1 311 36432.10
1EX0 B
COAGULATION FACTOR
XIII A CHAIN * 2.3.2.13 731 83313.70 1NUU A FKSG76
* 2.7.7.1 * 2.7.7.18 252 28397.00 1FGK A FGF RECEPTOR 1 * 2.7.10.1 310 35308.90 1NUU B FKSG76 * 2.7.7.1 * 2.7.7.18 252 28397.00 1FGK B FGF RECEPTOR 1 * 2.7.10.1 310 35308.90 1O4R A PROTO-ONCOGENE TYROSINE-PROTEIN KINASE SRC * 2.7.10.2 108 12375.10 1FMK A TYROSINE-PROTEIN KINASE SRC * 2.7.10.2 452 51710.10 1O6L A RAC-BETA SERINE/THREONINE PROTEIN KINASE * 2.7.11.1 337 39389.20
40
Table 5. Basic characteristics of selected Transferases proteins continued
PDB ID Chain ID Macromolecule Name EC No Chain Length Molecular
Weight PDB ID Chain ID Macromolecule Name EC No Chain Length Molecular Weight
1FW1 A GLUTATHIONE TRANSFERASE ZETA * 2.5.1.18 * 5.2.1.2 216 24108.10 1O6L C GLYCOGEN SYNTHASE KINASE-3 BETA * 2.7.1.37 10 1123.23 1G3M A ESTROGEN SULFOTRANSFERASE * 2.8.2.4 294 35176.70 1OTH A PROTEIN (ORNITHINE TRANSCARBAMOYLASE) * 2.1.3.3 321 36106.90 1G3M B ESTROGEN SULFOTRANSFERASE * 2.8.2.4 294 35176.70 1P4O A
Insulin-like growth factor I
receptor protein * 2.7.10.1 322 36657.20
1G55 A
DNA CYTOSINE
METHYLTRANSFERASE
DNMT2 * 2.1.1.204 343 39276.80 1P4O B
Insulin-like growth factor I
receptor protein * 2.7.10.1 322 36657.20
1GZ8 A
CELL DIVISION PROTEIN
KINASE 2 * 2.7.11.22 299 34034.80 1P5Z B Deoxycytidine kinase * 2.7.1.74 263 30835.00
1HE7 A
HIGH AFFINITY NERVE GROWTH FACTOR
RECEPTOR * 2.7.10.1 126 13922.50 1PKX A
Bifunctional purine biosynthesis protein PURH
* 2.1.2.3
* 3.5.4.10 592 64694.30
1HML A ALPHA-LACTALBUMIN * 2.4.1.22 142 16241.00 1PKX B
Bifunctional purine biosynthesis protein PURH
* 2.1.2.3 * 3.5.4.10 592 64694.30 1I1N A PROTEIN-L-ISOASPARTATE O-METHYLTRANSFERASE * 2.1.1.77 226 24537.40 1PKX C Bifunctional purine biosynthesis protein PURH
* 2.1.2.3
* 3.5.4.10 592 64694.30
1J1B A
Glycogen synthase kinase-3 beta
* 2.7.11.1
* 2.7.11.26 420 46801.70 1PKX D
Bifunctional purine biosynthesis protein PURH
* 2.1.2.3
* 3.5.4.10 592 64694.30
1J1B B
Glycogen synthase kinase-3 beta * 2.7.11.1 * 2.7.11.26 420 46801.70 1QCF A HAEMATOPOETIC CELL KINASE (HCK) * 2.7.10.2 454 52000.80 1J99 A ALCOHOL
SULFOTRANSFERASE * 2.8.2.14 293 34717.00 1QF8 A CASEIN KINASE II * 2.7.1.37 182 21553.10
41
Table 6. Basic characteristics of selected Hydrolases proteins
PDB ID Chain ID Macromolecule Name EC No Chain Length Molecular Weight PDB ID Chain ID Macromolecule Name EC No Chain Length Molecular Weight 1A4I A METHYLENETETRAHYDROFOL ATE DEHYDROGENASE / METHENYLTETRAHYDROFOLA TE CYCLOHYDROLASE * 1.5.1.5 * 3.5.4.9 301 32650.80 1J8F A SIRTUIN 2, ISOFORM 1 * 3.5.1.- 323 36532.30 1A4I B METHYLENETETRAHYDROFOL ATE DEHYDROGENASE / METHENYLTETRAHYDROFOLA TE CYCLOHYDROLASE * 1.5.1.5 * 3.5.4.9 301 32650.80 1J8F B SIRTUIN 2, ISOFORM 1 * 3.5.1.- 323 36532.30
1A6Q A PHOSPHATASE 2C * 3.1.3.16 382 42503.10 1J8F C SIRTUIN 2, ISOFORM 1 * 3.5.1.- 323 36532.30
1APY A ASPARTYLGLUCOSAMINIDASE * 3.5.1.26 162 17293.40 1JSF A LYSOZYME * 3.2.1.17 130 14720.80
1APY B ASPARTYLGLUCOSAMINIDASE * 3.5.1.26 141 15085.20 1JY1 A
TYROSYL-DNA
PHOSPHODIESTERASE * 3.1.4.- 464 52898.20
1APY C ASPARTYLGLUCOSAMINIDASE * 3.5.1.26 162 17293.40 1KI0 A ANGIOSTATIN * 3.4.21.7 253 29084.40
1APY D ASPARTYLGLUCOSAMINIDASE * 3.5.1.26 141 15085.20 1KRN A PLASMINOGEN * 3.4.21.7 88 9899.93
1AYE A PROCARBOXYPEPTIDASE A2
*
3.4.17.15 401 45007.10 1KWM A Procarboxypeptidase B * 3.4.17.2 402 45956.00
1B6A A METHIONINE AMINOPEPTIDASE
* 3.4.11.18 478 52972.10 1KWM B Procarboxypeptidase B * 3.4.17.2 402 45956.00 1CS8 A HUMAN PROCATHEPSIN L * 3.4.22.15 316 35921.20 1L9X A gamma-glutamyl hydrolase * 3.4.19.9 315 35989.30
1CSB A CATHEPSIN B light chain * 3.4.22.1 47 5213.87 1L9X B
gamma-glutamyl
hydrolase * 3.4.19.9 315 35989.30
1CSB B CATHEPSIN B heavy chain * 3.4.22.1 205 22438.00 1L9X C
gamma-glutamyl
hydrolase * 3.4.19.9 315 35989.30
1CSB D CATHEPSIN B light chain * 3.4.22.1 47 5213.87 1L9X D
gamma-glutamyl
hydrolase * 3.4.19.9 315 35989.30
1CSB E CATHEPSIN B heavy chain * 3.4.22.1 205 22438.00 1LAR A PROTEIN (LAR) * 3.1.3.48 575 66092.70
1DEU A PROCATHEPSIN X * 3.4.18.1 277 31184.80 1LAR B PROTEIN (LAR) * 3.1.3.48 575 66092.70
42
Table 6. Basic characteristics of selected Hydrolases proteins continued
PDB ID Chain ID Macromolecule Name EC No Chain Length Molecular Weight PDB ID Chain ID Macromolecule Name EC No Chain Length Molecular Weight
1DTD A CARBOXYPEPTIDASE A2 * 3.4.17.15 303 33661.20 1LCY A HtrA2 serine protease * 3.4.21.108 325 35002.10
1DTD B
METALLOCARBOXYPEPTID
ASE INHIBITOR 61 6787.68 1LE6 A
Group X Secretory
Phospholipase A2 * 3.1.1.4 123 13644.60
1EDM B FACTOR IX * 3.4.21.22 39 4279.65 1LE6 B
Group X Secretory
Phospholipase A2 * 3.1.1.4 123 13644.60
1EDM C FACTOR IX * 3.4.21.22 39 4279.65 1LE6 C
Group X Secretory
Phospholipase A2 * 3.1.1.4 123 13644.60
1ELV A
COMPLEMENT C1S
COMPONENT * 3.4.21.42 333 36687.70 1LO6 A Kallikrein 6 * 3.4.21.- 223 24533.00
1F3U A
TRANSCRIPTION INITIATION
FACTOR IIF, BETA SUBUNIT * 3.6.4.12 118 12718.50 1LQV A
Endothelial protein C
receptor 193 22046.80
1F3U B
TRANSCRIPTION INITIATION FACTOR IIF, ALPHA
SUBUNIT 171 19942.60 1LQV B
Endothelial protein C
receptor 193 22046.80
1F3U C
TRANSCRIPTION INITIATION
FACTOR IIF, BETA SUBUNIT * 3.6.4.12 118 12718.50 1LQV C
Vitamin-K dependent
protein C * 3.4.21.69 33 4359.44
1F3U D
TRANSCRIPTION INITIATION FACTOR IIF, ALPHA
SUBUNIT 171 19942.60 1LQV D
Vitamin-K dependent
protein C * 3.4.21.69 33 4359.44
1F3U E
TRANSCRIPTION INITIATION
FACTOR IIF, BETA SUBUNIT * 3.6.4.12 118 12718.50 1M6D A Cathepsin F * 3.4.22.41 214 23657.80
1F3U F
TRANSCRIPTION INITIATION FACTOR IIF, ALPHA
SUBUNIT 171 19942.60 1M6D B Cathepsin F * 3.4.22.41 214 23657.80
1F3U G
TRANSCRIPTION INITIATION
FACTOR IIF, BETA SUBUNIT * 3.6.4.12 118 12718.50 1MHW A Cathepsin L * 3.4.22.15 175 19127.10
1F3U H
TRANSCRIPTION INITIATION FACTOR IIF, ALPHA
SUBUNIT 171 19942.60 1MHW B Cathepsin L * 3.4.22.15 175 19127.10
![Figure 1. Structures of the tested (docked) compounds [2,3]](https://thumb-eu.123doks.com/thumbv2/9libnet/4319703.70704/14.892.121.822.117.737/figure-structures-tested-docked-compounds.webp)