Procedia - Social and Behavioral Sciences 64 ( 2012 ) 123 – 132
1877-0428 © 2012 Published by Elsevier Ltd. Selection and/or peer-review under responsibility of The Association Science Education and Technology doi: 10.1016/j.sbspro.2012.11.015
INTERNATIONAL EDUCATIONAL TECHNOLOGY CONFERENCE
IETC2012
The Turkish Adaptation of Mathematics Belief Scale:
The Validity and Reliability Study
Ercan MASAL
a*, Mithat TAKUNYACI
baDepartment of Elementary Mathematics Education,Faculty of Education,Sakarya University, Sakarya/TÜRKİYE bDepartment of Elementary Mathematics Education,Faculty of Education,Sakarya University, Sakarya/TÜRKİYE
Abstract
The aim of this study is to adapt Mathematics Belief Scale (MBS) to Turkish and to examine its reliability and validity. Three hundred and seventeen (317) university student from Sakarya University, and Konya Selçuk University (105 male, 212 female) participated in the study. The validity and reliability of scale was investigated by test re-test, Cronbach alpha, splithalf, exploratory and confirmatory factor analysis and criterion related validity methods. In order to determine the construct validity of MBS, exploratory and confirmatory factor analysis was conducted. The Cronbach’s alpha for the MBS was .87 and split-half .92. The computed test re-test reliability coefficient for the MBS was .83. Item-total correlation coefficients of the Turkish MBS ranged from .47 to .72. The Turkish adaptation of the MBS was found to be reliable and valid in this study.
© 2012 Published by Elsevier Ltd. Selection and/or peer-review under responsibility of The Association Science Education and Technology
Keywords:Teaching Mathematics, teaching mathematics efficiency, mathematics belief, validity, reliability.
1. Introduction
Various studies have been carried to increase the quality of the mathematical education within education system. Teaching students mathematical concepts and abilities to solve problems, making them feel confident at mathematics and having qualifications such as maintaining positive attitude towards mathematics are some of those studies. Certain factors are efficient to upskill them with these qualifications stated. One of them is, without doubt, the beliefs of individuals, concerning the nature and the education of mathematics (Frank, 1988).
The beliefs of the students and teachers about mathematics have attracted the mathematics educators’ attention for over 30 years. The studies showed that the teachers and students have similar beliefs about
*Corresponding author. Tel.: +90 532 798 38 18; fax: +90 264 614 10 34.
E-mail address: [email protected]
© 2012 Published by Elsevier Ltd. Selection and/or peer-review under responsibility of The Association Science Education and Technology Open access under CC BY-NC-ND license.
mathematics. The teachers and students think that mathematics generally consists of only numbers and calculation, that the aim of solving problem in mathematics is to get the right answer and that the only way to learn mathematics is to memorize. (Frank, 1988;Raymond, 1997; Rock and Shaw, 2000; Schoenfeld, 1989). Lim and Ernest (1999) suggested that these negative opinions about mathematics were common in many countries, and as a result of a study that they conducted on a wide group of adults, not only the teachers and students but also the adults commonly had negative opinions about mathematics.
Anyone but mathematicians thinks that mathematics is mysterious (Furinghetti, 1993; Lim and Ernest, 1999). Even the mathematicians depicted in movies are considered as genius and mad people who wander in symbol labyrinths that are thought to be very complicated (Mulcare, 2008). To sum up, the opinions such as that mathematics is all about calculations and only intelligent people can be interested in mathematics are common among society. As a part of the society, children are affected by these negative opinions. The opinions of the students about mathematics and mathematicians should be deeply analyzed in order to make them consider mathematics as an attractive branch and learn it by doing mathematics like a mathematician (Lim and Ernest, 1999; Rock and Shaw, 2000). The ways to change or enhance these opinions thusly can be defined more efficiently, and they can be stopped from being hindrances of doing mathematics and therefore learning it.
The concept of belief has no definition agreed on and has generally been mistaken for the concepts of attitude and knowledge (Ernest, 1989; Pajares, 1992; Thompson, 1992). Turkish Language Association defines “belief” as being bond with an opinion at heart in the contemporary dictionary. When looked at the literature, different definitions can be seen, too. Sigel (1985) defines belief as mental structures composed of experiences, and suggests that these structures drive behaviors. Koballa and Crawley (1985) define the beliefs as information taken as truth. According to Richardson (2003), belief is understandings, assumptions and propositions felt as truth; that people has psychologically about world.
Ernest (1989) defines mathematical belief as individuals’ concepts, ideologies, values, philosophies about life and mathematics. In contrast to Ernest’s general definition, Raymond (1997) defines mathematical beliefs as personal value judgments shaped by one’s past mathematical experiences.
The beliefs of students about mathematics which they formed at early ages have an important role in their future mathematical education. It will be hard to change the negative beliefs that children developed about mathematics at early ages, and this will affect their mathematical achievements badly in future because the beliefs of students about mathematics are one of the important factors concerning their mathematical achievements (Mert, 2004; Schoenfeld, 1989). The beliefs are very effective in students’ evaluating their own abilities, being enthusiastic about participating in mathematical activities, and their attitude towards mathematics (NTCM, 1989). But there is a two-way relation between beliefs and success rather than a cause and effect relation. There is a similar relation between learning and beliefs. The mathematical experiences of the students make them develop beliefs concerning the meaning of learning mathematics. These beliefs affect their attitude towards learning mathematics. In other words, the students who have positive beliefs about mathematics are more enthusiastic about studying mathematics. The more students become successful, the more positive opinions they develop about mathematics. In brief, the beliefs of the students are one of the most important factors in learning mathematics.
It has been shown that there is a circular relation between the beliefs of the students and learning process. Because the beliefs of the students affect their learning, therefore the learning experiences affect their beliefs. This cycle needs to be intercepted and shaped as desired. For this cause, the beliefs of the students about mathematics should be revealed and the teachers should be informed. So, if the teachers are aware of the beliefs of the students about mathematics, they can plan and exercise the learning experiences that will affect these beliefs positively. Mason (2003) states that the beliefs of the students about mathematics are largely affected by the homework, assessment and evaluation methods and the methods and techniques followed at classroom. As a result of the study they conducted with fifth grade
students, Mason and Scrivani (2004) found that a problem solving oriented teaching method is positively effective on students’ beliefs rather than a teacher oriented approach based on plain teaching.
There have been many studies concerning the effect of the beliefs about mathematics on it. Some of them were to reveal those beliefs and some were to reveal the effects of the beliefs. The mutual result of these studies is that there is a significant relation between the beliefs and cognition, motivation and academic success (Muis, 2004).
Mathematical Belief Scale (MBS) is a 5-point Likert scale with 34 items, developed by Lorraine A. Steiner (2007) in order to assess the current beliefs of teachers and students about the nature of teaching and learning mathematics, and the mathematical knowledge in detail. In this study, the purpose is to examine the psychometric characteristics of MBS in a sample composed of Turkish university students, and to adapt it into Turkish language. Accordingly, the hypothesis concerning the fact that the Turkish form of the scale has similar structures of validity, reliability and factor with the original one has been tested.
2. Method
In this past are given such information as the research method used in the research, the universe and sample of the research, the development and implementation of measuring tools, collection of data and analysis of the collected data.
2.1.Working Group
The participants of the study consist of 317 students who are studying at Sakarya University and Konya Selçuk University in 2011-2012 academic year. 105 of the participants are male and 212 of them are female. The age span of the working group is 18 and 22. The students who constitute the sample are volunteers.
2.2.Operations
In order to adapt mathematical teaching qualifications beliefs scale (MBS) into Turkish language, Lorraine A. Steiner has been contacted with and the necessary permission has been received. It is important in the scale adaptation from another language that the expressions are matched in the other language and culture. The translation between English and Turkish languages is composed of two stages: In the first stage, the items of the scale were individually translated by three academicians who are competent in both Turkish and English, and one professional translator. In the second stage, these translations were compared by the researcher and a professional translator, and the translations that are thought to be the best were adopted. And then three academicians reached a settlement on the final state of the scale in Turkish. At the last stage, the scale in Turkish was applied to 36 undergraduates and the understandability of the tongue was tested. As a result of the feedbacks, the necessary changes were executed and the final state of the scale came up.
Only the volunteers were asked to participate in the study after the necessary explanations had been made and the aim of the study had been explained in the process of applying the scale to the participants. The application of the scale lasted about 10 minutes.
The structure validity of MBS was examined during the validity studies. Exploratory and confirmatory factor analyses were conducted in order to deliver the structure validity of the scale. An item analysis and comparisons of lower-upper group of 27 percent was carried out to identify the item distinctiveness of
MBS. The reliability coefficients were calculated through test-retest, internal consistency and test split-half methods in the reliability study.
2.3.Data Collection Tools
In the research, Mathematics Belief Scale (MBS) was used. It is a 5-point Likert scale with 34 items, developed by Lorraine A. Steiner (2007). The answers are scaled as (1) I Definitely Agree, (2) I Agree, (3) I Am Indecisive, (4) I Do Not Agree, (5) I Definitely Do Not Agree. Here is an example of items: “I have been always successful at Math.” MBS is composed of five factors: Time, Steps, Understanding, Usefulness and Sense of Self.
2.4.Linguistic Equivalence
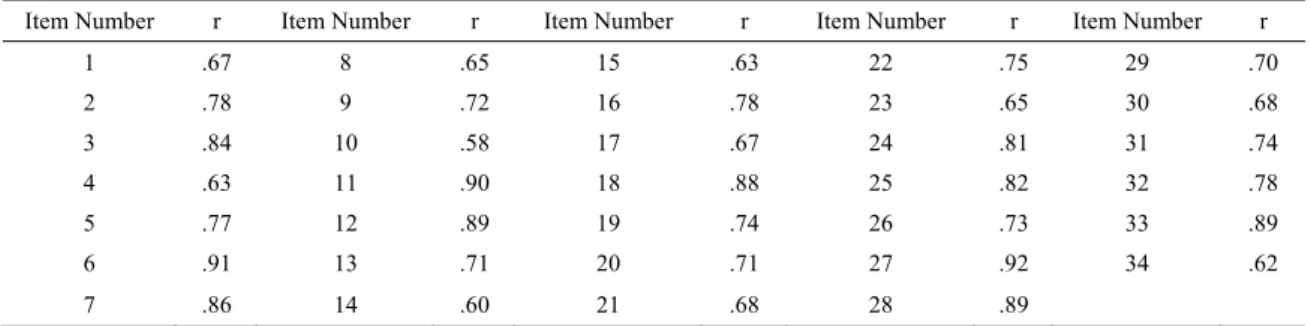
In the linguistic equivalence study of Consciousness Scale, the original form (the form in English) and the form in Turkish was applied to 76 English teachers and the correlation between the scores obtained from these two forms were taken as the linguistic equivalence coefficient of the scale. In this application, the teachers received the forms in Turkish first, and then the forms in English. As a result, the linguistic equivalence coefficients of MBS were between .58 and .92. The findings about correlation between the scores obtained from the forms in Turkish and English can be found in Table 1.
Table1. Findings of linguisticequivalence of items
Item Number r Item Number r Item Number r Item Number r Item Number r
1 .67 8 .65 15 .63 22 .75 29 .70 2 .78 9 .72 16 .78 23 .65 30 .68 3 .84 10 .58 17 .67 24 .81 31 .74 4 .63 11 .90 18 .88 25 .82 32 .78 5 .77 12 .89 19 .74 26 .73 33 .89 6 .91 13 .71 20 .71 27 .92 34 .62 7 .86 14 .60 21 .68 28 .89
2.
5.Item AnalysisItem-total correlation and comparisons of lower-upper group of 27 percent was carried out in order to identify the item distinctiveness of MBS. As you can see the result of the analysis in Table 1, the results for corrected item-total correlation change between .47 and .72. In view of that the items valued at .30 and above are considered adequate to distinct the feature to be assessed (Büyüköztürk, 2008) in the interpretation of item-total correlation, it can be said that item-total correlations are adequate. The t-test was used the item score comparison of lower-upper group of 27 percent. T values concerning the differences in the item scores of lower-upper group of 27 percent change between -12.17 (p<.001) and 5.07 (p<.001) as seen in Table 2.
Tablo 2.CorrectedItem-Total Correlation Value of MI-Oandt-Test ResultsbetweenLower 27% GroupandUpper 27% Group Values.
Item Number Corrected Item Total Correlation Lower Group Upper Group t
Item 1 .516 2.09 .835 2.83 1.170 -4.73* Item2 .501 3.72 1.144 3.60 .871 -5.75* Item3 .661 2.09 .835 2.78 1.192 -4.37* Item4 .624 2.27 1.011 2.64 1.016 -2.41* Item5 .556 2.19 1.068 2.85 1.193 -3.84* Item6 .488 1.36 .592 2.91 1.214 -10.62* Item7 .569 1.09 .292 2.51 1.135 -11.23* Item8 .476 1.70 .768 2.86 1.097 -8.05* Item9 .616 3.66 1.047 3.29 .906 -8.49* Item10 .522 2.19 .790 3.24 1.095 -7.27* Item11 .587 2.07 .992 3.31 1.077 -7.88* Item12 .655 1.47 .525 2.66 1.252 -8.18* Item13 .500 1.86 .671 3.19 1.035 -9.97* Item14 .560 3.90 .908 3.09 1.154 5.07* Item15 .489 1.66 .729 3.05 1.105 -9.69* Item16 .491 1.92 .897 3.22 1.056 -8.72* Item17 .521 1.76 .867 3.30 1.138 -10.02* Item18 .493 1.76 .685 2.91 1.059 -8.47* Item19 .504 1.76 .867 2.90 .970 -8.12* Item20 .683 2.57 .989 3.13 .968 -3.74* Item21 .491 1.91 .625 2.88 .926 -8.11* Item22 .578 1.86 .635 2.90 1.117 -7.47* Item23 .528 2.06 .802 2.72 1.013 -4.76* Item24 .537 2.01 .744 2.92 1.098 -6.34* Item25 .634 1.73 .913 3.00 1.074 -8.34* Item26 .699 3.88 .913 3.24 1.095 4.16* Item27 .557 1.59 .709 3.24 1.040 -12.17* Item28 .535 1.49 .793 2.80 1.004 -9.52* Item29 .728 1.35 .891 3.15 1.163 -11.40* Item30 .558 1.51 .747 2.77 1.134 -8.57* Item31 .509 1.66 .862 2.90 1.198 -7.74* Item32 .564 1.24 .825 2.90 1.208 -10.47* Item33 .561 2.34 1.316 2.92 1.190 -3.04* Item34 .530 1.52 .778 2.88 1.259 -8.52* * p<0.01 2.6.Structure Validity
The factor analysis is carried out in order to reduce the amount of the coefficients, identifying basic variables or factors that are classified among many variables observed. Each identified factor is composed of a set of interrelated variables which assess the same feature as a result of assessment of the relation between the variables. In other words, the factor analysis is a factor achievement process through the calculation of the correlation between the variables according to the answers from the subjects and classification of interrelated variables which assess the same dimension (Ural and Kılıç, 2005). An exploratory and confirmatory factor analysis was carried out to reveal the implicit structure of MBS and to confirm the structure that was explained in its original form.
Exploratory Factor Analysis (EFA): Exploratory factor analysis was carried out in order to define the factor structure of MBS. Sampling adequacy and Bartlett Sphericity tests were conducted so as to find out
whether the data are adequate for factor analysis or not. For the adequacy of the data for factor analysis Kaiser-Meyer-Olkin (KMO) must be over .60, and Bartlett Test must be statistically significant (Büyüköztürk, 2008). It was found out that KMO adequacy coefficient of sampling was .83, and Bartlett Sphericity test’s χ2value was 3168.03 (p<.001). These results indicate that the data are adequate for factor
analysis.
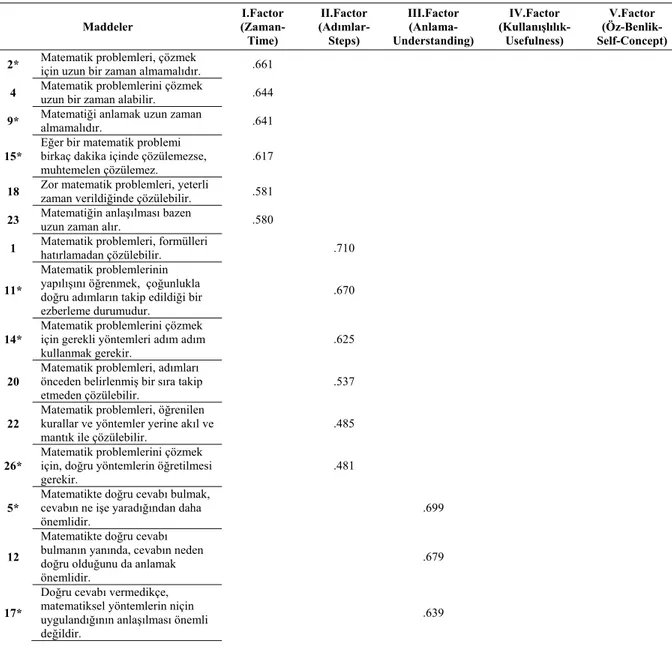
Since the original form of Mathematics Belief Scale gave results with five factors, firstly the factor analysis results of basic components method and direct oblimin rotation was limited with two factors. Accordingly, a structure that explains 63.66 percent of total variance was achieved. The results concerning the two-factor structure, and the factor loading can be found in Table 3.
Table 3.The Factor Loading of Scale (Rotated Principal Component Analysis)
Maddeler I.Factor (Zaman-Time) II.Factor (Adımlar-Steps) III.Factor (Anlama-Understanding) IV.Factor (Kullanışlılık-Usefulness) V.Factor (Öz-Benlik-Self-Concept) 2* Matematik problemleri, çözmek için uzun bir zaman almamalıdır. .661
4 Matematik problemlerini çözmek uzun bir zaman alabilir. .644 9* Matematiği anlamak uzun zaman almamalıdır. .641 15*
Eğer bir matematik problemi birkaç dakika içinde çözülemezse, muhtemelen çözülemez.
.617 18 Zor matematik problemleri, yeterli zaman verildiğinde çözülebilir. .581 23 Matematiğin anlaşılması bazen uzun zaman alır. .580
1 Matematik problemleri, formülleri hatırlamadan çözülebilir. .710 11*
Matematik problemlerinin yapılışını öğrenmek, çoğunlukla doğru adımların takip edildiği bir ezberleme durumudur.
.670
14*
Matematik problemlerini çözmek için gerekli yöntemleri adım adım kullanmak gerekir.
.625
20
Matematik problemleri, adımları önceden belirlenmiş bir sıra takip etmeden çözülebilir.
.537
22
Matematik problemleri, öğrenilen kurallar ve yöntemler yerine akıl ve
mantık ile çözülebilir. .485
26*
Matematik problemlerini çözmek için, doğru yöntemlerin öğretilmesi
gerekir. .481
5*
Matematikte doğru cevabı bulmak, cevabın ne işe yaradığından daha önemlidir.
.699
12
Matematikte doğru cevabı bulmanın yanında, cevabın neden doğru olduğunu da anlamak önemlidir.
.679
17*
Doğru cevabı vermedikçe, matematiksel yöntemlerin niçin uygulandığının anlaşılması önemli değildir.
31
Doğru cevabı bulmanın önemli olması kadar matematik probleminin çözüm nedeninin de araştırılması önemlidir.
.544
33
Bir matematik probleminin cevabının doğru olduğunu anlamayan bir kişi, gerçekten problemi çözemez.
.534
34*
Eğer doğru cevabı verebildiysen, bir matematik problemini anlayıp anlamadığın çok da önemli değildir.
.531
7* Matematik çalışmak zaman kaybıdır. .664
24 Matematik çalışırım çünkü ne kadar yararlı olduğunu bilirim. .546
28 Matematik faydalı ve gerekli bir derstir. .523
29* Matematiğin hayatımla hiçbir ilgisi yoktur. .508
30
Matematiği bilmek, hayatımı kazanmada bana yardımcı olacaktır.
.493
32*
Bir matematik probleminin cevabının doğru olduğunu anlamayan bir kişi, gerçekten problemi çözemez.
.475
3 Matematik derslerinde her zaman başarılı olmuşumdur. 761
6* Matematik kendimi yetersiz hissettirir. .744
8
Genellikle matematik derslerinde diğer derslere göre daha
başarılıyımdır. .691
10 Arkadaşlarım matematikte yardım almak için bana gelir. .667
13* Matematiksel mantık gerektiren testleri hiçbir zaman iyi yapamam. .581
16 Birçok matematik problemini ilgi çekici buluyorum. .570
19* Matematik içeren dersleri almaktan tereddüt ederim. .556
21 Matematikte oldukça iyimdir. .534
25* Matematikte hiçbir zaman heyecanlanmamışımdır .508
27* Matematiğe dayanan herhangi bir şeyi anlamakta sıkıntı yaşarım. .496
Explainedvariance (%) 10.45 8.89 9.75 14.23 20.34
*Theseitemsarecoded in reverse
Confirmatory Factor Analysis: Confirmatory factor analysis (CFA) was carried out so as to find out whether or not the factor structure of the original form would be confirmed in the sampling in Turkish. CFA is a validity determination method especially used in adaptation of assessment tools developed in other cultures and samplings. According to Sümer (2000), CFA is an analysis that assesses to what degree the factors that was created with many variables through a theoretical basis can comply with the original data. In other words, CFA aims to examine to what degree a pre-identified or built structure is confirmed with the data. While the factor structure of data is identified on factor loadings (weights) basis without a certain pre-expectation or hypothesis in EFA, CFA is based on testing a prediction according to which
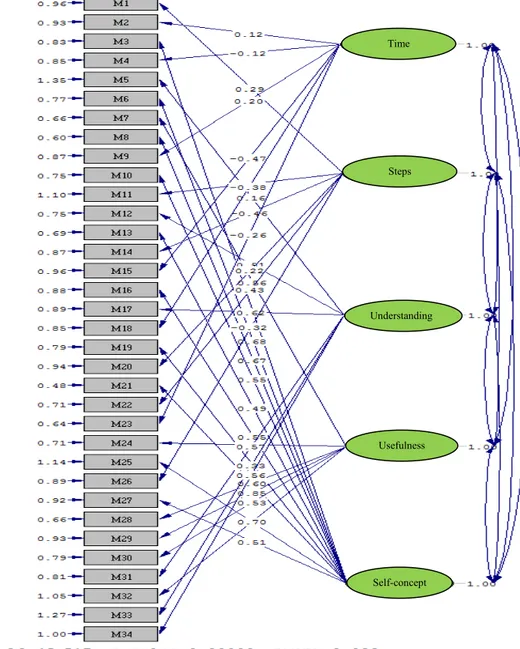
certain variables would predominantly play a part on the factors pre-identified on a theoretical basis. Many fit indexes are used so as to put forth the adequacy of the model tested to find out whether it is fit in CFA or not. In the CFA of this study, Chi-Square Goodness, GFI (Goodness of Fit Index), RMSEA (Root Mean Square Error of Approximation), CFI (Comparative Fit Index), NFI (Normed Fit Index), RFI (Relative Fit Index), IFI (Incremental Fit Index) and AGFI (Adjusted Goodness of Fit Index) were examined. Acceptable fit index is considered as 0.90, and the perfect fit value is considered as 0.95 for GFI, CFI, NFI, RFI, IFI and AGFI fit indexes. The acceptable fit value is considered as 0.08 and perfect fit value is considered 0.05 for RMSEA. The fit indexes of the two-factor models of the form in Turkish were examined in CFA. It was found out that the minimum Chi-Square value (χ2=1385.86 N=317. p=0.00) is significant for the two-factor structure. The fit index values were found as RMSEA=0.082, NFI=0.92, CFI=0.93, IFI=0.93, RFI=0.92, GFI=0.91 and AGFI=0.90. These fit index values shows that the model is fit for the two-factor structure. The factor loadings concerning the model can be seen in Figure 1.
Figure 1: Path diagram of scale with five-factors model
Time
Steps
Understanding
Usefulness
2.7.Reliability Studies
In this study, the reliability of MBS was calculated through internal consistency (Cronbach Alpha), test split-half and test-retest methods. The internal consistency coefficient of the scale was found as .87. The reliability coefficient achieved through the test split-half method is .92. The scale was applied to 86 subjects biweekly so as to identify the reliability through test-retest method. As a result of the application, the test-retest reliability coefficient was found as .83. The results concerning the reliability can be seen in
Table 4.
Table4.Thereliabilitycoefficents of scale.
3. Conclusion and Recommendation
In this study, the adaptation of the Mathematics Belief Scale (MBS) developed by Lorraine A. Steiner (2207) into Turkish language was carried out through an examination on a sampling composed of university students. EFA and CFA were conducted so as to identify the validity and reliability of the assessment tool named as Mathematics Belief Scale (MBS). The reliability of MBS was calculated through test-retest, internal consistency (Cronbach Alpha) and test split-half methods, and reliability coefficients were calculated through test half-life methods. An item analysis and comparisons of lower-upper group of 27 percent was carried out to identify the item distinctiveness of MBS.
As a result of the exploratory factor analysis conducted for the structure validity of Mathematics Belief Scale, it was found out that the scale has five sub-dimensions (time, steps, understanding, usefulness and self) as in the original form and that the items are placed in their own dimensions befittingly to the original form. And it was seen that the total variance rate is 63.66 percent. In view of that 30 percent and above is taken as criterion for the explained variance rate in scale development and adaptation studies (Büyüköztürk, 2008), it can be said that the explained variance rate is adequate. When the fit index limits for CFA are taken into consideration, it is seen that model is fit on a good level, and the original factor structure of the scale complies with the factor structure of the form in Turkish language.
The scores obtained from the reliability studies are on a high level. The high coefficients of internal consistency of the scale show that the internal consistency is adequate. In other words, each of the scale items evaluates the feature to be evaluated. The stability of the scale was examined through test-retest method. In view of that the anticipated reliability level for the assessment tools that can be used in researches is .70 (Tezbaşaran, 1996), it can be said that the reliability level concerning all of the sub-dimensions of the scale is adequate.
To sum up, according to the findings obtained from the validity and reliability studies carried out on a working group that consists of Turkish university students, it can be said that MBS is ready, valid and reliable to use in identification of individuals’ belief and self conditions towards mathematics, and it is an easy and practical scale to apply and assess. However, because of the fact that the research group on which the validity and reliability studies were carried out consists of university students, it is necessary to
Application N ܺത Sd Test-retestmethod consistencyInternal Split-half method
The first application 86 84.42 13.35 .83 .87 .92
carry it out on different groups for the validity and reliability of the scale. Finally, the research to be using this scale would contribute much to the scale’s power to evaluate.
References
Büyüköztürk, Ş. (2008).SosyalBilimlerİçinVeriAnalizi El Kitabı, Ankara: PegemAYayıncılık.
Ernest, P. (1989). The Knowledge, beliefs and attitudes of the mathematics teacher: A Model. Journal of Education for Teaching, 15(1), 13-33.
Frank, M. L. (1988). Problem solving and mathematical beliefs.The Arithmetic Teacher, 35(5), 32-35.
Furinghetti, F. (1993). Images of mathematics outside the community of mathematicians: Evidence and explanations. For the Learning of Mathematics, 13(2), 33-38.
Koballa, T. R., Jr., & Crawley, F. E. (1985).The influence of attitude on science teaching and learning.School Science and Mathematics, 85(3), 222-232.
Lim C. S., & Ernest, P. (1999).Public Images of Mathematics.Philosophy of Mathematics Education Journal, 11, 43-55.
Lorraine A. S. (2007). The Effect Of Personal And Epistemological Beliefs OnPerformance In A College Developmental Mathematics Class, PhDDissertation,Kansas State University, Manhattan.
Mason, L. (2003). High school students beliefs about maths, mathematical problem solving and their achievement in maths: A cross sectional study. Educational Psyhology, 23(1), 73-85.
Mason, L., &Scrivani, L. (2004).Enhancing students' mathematical beliefs: An intervention study.Learning and Instruction, 14,153-176.
McLeod, D. B., & McLeod S. H. (2002). Synthesis - Beliefs and mathematics education: Implications for learning, teaching, and research. In G. C. Leder, E. Pehkonen, & G. Torner (Eds.), Beliefs: A hidden variable in mathematics education? (pp.115-127). Dordrecht: Kluwer Academic Publishers.
Mert, O. (2004). High school students' beliefs about mathematics and the teaching of mathematics.YayvmlanmamisYiiksekLisansTezi. OrtaDoguTeknikUniversitesi.
Muis K. M. (2004) Personal Epistemology And Mathematics:A Critical Review And Synthesis Of Research, Review Of educational Research, 74,317–377.
Mulcare, C. (2008). Maths, madness and movies.Plus Magazine, 47.2 Kasim 2009, http://plus.maths.org/ issue47/features/mulcare/index.html.
National Council of Teachers of Mathematics.(1989). Curriculum and evaluation standards for school mathematics.Reston, VA: Author.
Pajares, M. F., (1992). Teachers' beliefs and educational research: cleaning up a messy construct. Review of Educational Research, 62(3), 307-332.
Raymond, A. M. (1997). Inconsistency between a beginning elementary school teacher's mathematics beliefs and teaching practice.Journal for Research in Mathematics Education, Vol. 28, No. 5, 550- 576.
Richardson, V. (2003).Preservice teachers’ beliefs.In J. Rath& A.C. McAninch (Eds), Advances in Teacher Education series, 6. Greenwich, CT: Information Age.
Rock, D., & Shaw, J.M. (2000).Exploring children's thinking about mathematicians and their work.Teaching Children Mathematics, 6(9), 550-555.
Schoenfeld, A. H. (1989) Exploration of students’ mathematical beliefs and behavior. Journal for Research in Mathematics Education, (20), 338-355.
Sigel, I. E. (1985). Parental belief systems: The psychological consequences for children. Hillsdale, NJ: Lawrence Erlbaum Associates.
Sümer, N. (2000). Yapısaleşitlikmodelleri: Temelkavramlarveörnekuygulamalar.TürkPsikoloji Yazıları,3(6).
Thompson, A. G. (1992). Teachers' beliefs and conceptions: A synthesis of the research In D. A. Grouws (Ed.), Handbook of research on mathematics teaching and learning (s. 127-146), New York: Macmillian.