Çoklu Yordama Çalışmalarında Kullanılan
Bazı İstatistiksel Analizlerin SWOT Analizi
Yöntemiyle İncelenmesi
Kaan Zülfikar DENİZ
*Zekeriya ÇAM
**Aslı UYSAL
***Hatice APAYDIN ŞEN
****Ersin TÜRE
*****ÖZ. Çoklu yordama çalışmalarında yaygın olarak kullanılan bazı istatistiksel analizler, çoklu regresyon analizi (ÇDR), diskriminant analizi (DA), lojistik regresyon analizi (LR) ve yapısal eşitlik modeli (YEM) olarak belirtilebilir. Bu çalışmada, çoklu yordama çalışmalarında kullanılan bu istatistiksel analizlerin olumlu ve olumsuz özellikleri SWOT analizi yöntemi kullanılarak farklı bir açıdan ele alınmıştır. Çalışma kapsamında incelenen ÇDR, LR, DA ve YEM istatistiksel analizlerinin her birinin, yordama çalışmalarında kullanılan diğerlerine göre güçlü ya da zayıf olduğu yanlar olduğu görülmektedir. Araştırmacılar yanlış seçilen istatistiksel analizin sonucunda elde edilen yorumların hiçbir öneminin olmadığını unutmamalıdır. Bu nedenle çoklu yordama çalışması yapacak olan araştırmacılar bu çalışmada incelenen istatistiksel analizler hakkında bilgi sahibi olmalıdır.
Anahtar Sözcükler: Çoklu doğrusal regresyon, diskriminant analizi, lojistik regresyon, yapısal eşitlik modeli, SWOT analizi.
* Yrd. Doç. Dr., Ankara Üniversitesi, Eğitim Bilimleri Fakültesi, Ankara, Türkiye. E-posta: [email protected], [email protected]
** Arş. Gör., Ankara Üniversitesi Eğitim Bilimleri Fakültesi, Ankara, Türkiye. E-posta: [email protected]
*** Uzman, Başkent Üniversitesi Özel Ayşeabla Okulları, Ankara, Türkiye. E-posta: [email protected] **** Okutman, Yıldırım Beyazıt Üniversitesi, Yabancı Diller Yüksek Okulu, Ankara, Türkiye. E-posta: [email protected]
***** Arş. Gör., Ankara Üniversitesi Eğitim Bilimleri Fakültesi, Ankara, Türkiye. E-posta: [email protected]
ÖZET
Sosyal bilimlerde çoğunlukla bir değişkeni etkileyen birden fazla
değişken olduğu için bunlardan hangilerinin daha etkili olduğu çoklu
yordama çalışmalarıyla ortaya konulabilir. Çoklu yordama çalışmalarında
yaygın olarak kullanılan bazı doğrusal istatistikler: çoklu doğrusal regresyon
(ÇDR), lojistik regresyon (LR), diskriminant analizi (DA) ve yapısal eşitlik
modeli (YEM) olarak belirtilebilir.
SWOT analizi Strengths, Weaknesses, Opportunities, Threats
sözcüklerinin baş harfleri kullanılarak isimlendirilmiştir. SWOT analizi
genellikle bir işletme, kurum ya da kuruluşun farklı yönlerini analiz etmek
ve gereken konularda tedbir almak için kullanılır. Bu çalışmanın amacı
ÇDR, LR, DA ve YEM analizlerinin SWOT analizi tekniği kullanılarak
incelenmesi ve bu analizleri çalışmasında kullanacak olan araştırmacılara yol
gösterici bilgi vermektir.
Çoklu yordama çalışmalarında kullanılan çoklu doğrusal regresyon,
diskriminant analizi, lojistik regresyon ve yapısal eşitlik modeli SWOT
analiziyle incelenirken dört temel boyut S:Güçlülük, W:Zayıflık, O:Fırsatlar,
T:Tehditler şu şekilde ele alınmıştır: S: Güçlülük: İncelenen istatistiksel
analizin araştırma bulgularında yaratacağı ve genellikle benzeri analizlere
göre üstün olduğu olumlu durumlar belirtilmiştir. W: Zayıflık: İncelenen
istatistiksel analiz yapılırken karşılaşılan engeller, sınırlılıklar, zorluklar ile
benzeri analizlere göre zayıf kaldığı olumsuz durumlar belirtilmiştir. O:
Fırsatlar: Analizin araştırmacıya sağladığı yararlar, diğer analizlerin
olumsuzluklarından incelenen analiz için doğan olumlu durumlar
belirtilmiştir. T: Tehditler: Analizin yanlış kullanılması, bazı önemli
noktalara dikkat edilmemesi, daha güçlü bir istatistiksel analizin varlığı gibi
olumsuz durumlar belirtilmiştir.
Yukarıda belirtilen istatistiksel analizlerin her birinin, diğerlerine göre
güçlü ya da zayıf olduğu yanlar olduğu görülmektedir. Önemli olan, pek çok
değişken açısından, hangi analizi kullanmamız gerektiğini doğru şekilde
belirlemektir. Bu çalışma kapsamında, yordama çalışmalarında kullanılan
istatistiksel analizlerin olumlu ve olumsuz yanları hakkında literatüre dayalı
detaylı bilgi sunulmaya çalışılmıştır.
Investigating Certain Statistical Analyses Used in
Multiple Prediction Studies by SWOT Analysis
Kaan Zülfikar DENİZ
*Zekeriya ÇAM
**Aslı UYSAL
***Hatice APAYDIN ŞEN
****Ersin TÜRE
*****ABSTRACT. Multiple linear regression (MLR), logistic regression (LR), discriminant analysis (DA), and structural equation modeling (SEM) are some of the most widely used linear statistics in multiple regression studies. In this study, positive and negative sides of certain statistical analyses were taken into account from a different view using SWOT analysis. In this study, it is aimed to express the positive/negative sides of statistics which are widely used in multiple regression studies (multiple linear regression, logistic regression, discriminant analysis and structural equation modeling) and what kind of mistakes may be encountered in such statistical analyses making use of SWOT analysis .It can be seen that each of MLR, LR, DA and SEM statistical analyses that were examined within the scope of this study has strong and weak sides compared to other analyses used in regression studies.
Keywords: multiple linear regression, logistic regression, discriminant analysis, structural equation modeling, SWOT analysis.
*Assist. Prof. Dr., Ankara University, Institute of Educational Sciences, Ankara, Turkey. E-mail: [email protected], [email protected]
**Res. Assist., Ankara University, Faculty of Educational Sciences, Ankara, Turkey. E-mail: [email protected]
***Specialist, Başkent University Ayşeabla Private Schools, Ankara, Turkey. E-mail: [email protected]
****Instructor, Yıldırım Beyazıt University, School of Foreign Languages, Ankara, Turkey. E-mail: [email protected]
*****Res. Assist., Ankara University, Faculty of Educational Sciences, Ankara, Turkey. E-mail: [email protected]
INTRODUCTION
Regression analysis is a conceptually simple method for investigating
functional relationships among variables. The relationship is expressed in the
form of an equation or a model connecting the response of dependent
variable and one or more explanatory or predictor variables (Chattarjee &
Hadi, 2006, p.1).
Since there is more than one variable affecting a variable in social
sciences in most cases, it can be put forward which of them are more
effective by means of multiple regression studies. In multiple regression
studies, some of the most widely used linear statistics are multiple linear
regression (MLR), logistic regression (LR), discriminant analysis (DA), and
Structural equation modeling (SEM).Multiple regression questions about the
relationship between a set of independent variables (IV s) and a dependent
variable (DV ).It can be used to describe the relationship, to forecast future
scores on the DV, or to assess specific hypotheses based on scientific theory
or previous research.Multiple regression generally deals with linear
relationships between the IVs and the DV.However, it can be extended to
investigate other forms of relationships (Aiken & West, 2005).LR is often
used to classify observations into two groups.A lot of applied researchers
give preference to LR as a tool for assigning observations to one out of two
populations.It can be said that logistic regression is a flexible method since it
can handle different kinds of variables (Croux, Haesbroeck & Joossens,
2008). Discriminant analysis is used in situations where the clusters are
known a priori. It is a set of methods that are used to differentiate among
groups in data and to assign new observations into the existing groups
(Hardle & Simar, 2003, p.330). Discriminant analysis wholly deals with the
relationship between a categorical variable and a group of interrelated
variables (McLachlan,1992, p.1).The aim of discriminant analysis is to
forecast group membership from a set of predictors (Tabachnick & Fidell,
2007, p.375).It is expressed that SEM includes a set of techniques which are
used to define the relationships between one or more dependent variables
and independent variables among which there is a relationship.Furthermore,
SEM is also named as causal analysis, analysis of covariance structure, path
analysis and confirmatory factor analysis in literature (Ullman, 2006).
Orhunbilge (2010) expresses the abovementioned four analyses under
the heading of multivariate methods containing external dependency. In this
study, positive and negative sides of certain statistical analyses were taken
into account from a different angle using SWOT analysis
SWOT analysis is the acronym for Strengths, Weaknesses,
Opportunities and Threats. S - Strong sides: It includes the assets and skills
that organizations are superior compared to others. Moreover, these are
internal factors to be used by the organization for its own interests. W –
Weak sides: These are factors preventing skills of employees and weakening
the reaction ability of the organization. O - Opportunities: These are factors
used for the development of the organization that will bring about positive
results for the organization as a result of external environment analysis T –
Threats: These are factors that make it difficult for the organization to realize
its objectives together with undesired conditions that might prevent survival
of the organization and that risk its own success and operation (Aksu, 2002;
Birel, 2008).
Dinçer (1994) dealt with SWOT analysis not only for a company but
also in respect of application of a technique. Strength means the technique
being more efficient and effective than other techniques. Weakness, on the
other hand, means the sides of a technique that are less effective compared to
others. Opportunities are the ones that might cause positive results that are
released as a result of the analysis of external environment. Threats are the
external factors endangering the success of the technique. Anything that
might prevent success or cause damage for a technique is a threat.
In this study, SWOT analysis was used in a very different area very
differently and SWOT analysis was performed for certain statistical
analyses. The bases of performing this study were to enable the researchers
to see different sides of these statistical analyses, to draw their attention to
wrong usages and to make sure that they don’t repeat the frequently made
mistakes. While performing SWOT analysis, four basic dimensions S:
Strengths, W: Weaknesses, O: Opportunities and T: Threats were taken into
account as follows:
S: Strengths: The positive circumstances that the examined statistical
analysis would create on study findings and on which such analysis is
superior compared to similar studies were stated (Positive circumstances
arising from the analysis itself).
W: Weaknesses: The obstacles, constraints and difficulties encountered
during statistical analysis and the negative circumstances in which the
analysis was weak compared to similar analyses were stated (Negative
circumstances arising from the analysis itself).
O: Opportunities: The benefits that the analysis provides to researcher
and the positive circumstances arising for such analysis from the negative
sides of other analyses were stated (Positive circumstances arising from
external factors).
T: Threats: Negative circumstances such as wrong usage of the analysis,
omission of certain important points, existence of a stronger statistical
analysis were stated (Negative circumstances arising from external factors).
The objective of this study is to demonstrate the positive/negative sides
of statistics that are widely used in multiple regression studies (multiple
linear regression, logistic regression, discriminant analysis and Structural
equation modeling) and what kind of mistakes may be encountered in such
statistical analyses making use of SWOT analysis.
SWOT Analysis for Multiple Linear Regression Analysis (MLR)
MLR is a general system for examining the relationship of a collection
of independent variables to a single dependent variable (Rencher, 2002;
Timm, 2002; Aiken, West & Pitts, 2003, p.483; Urbina, 2004; Meyers,
Gamit & Guamino, 2006; Gray, Williamson, Karp & Dalphin, 2007; Ho,
2006).
Table 1. SWOT Analysis for Multiple Linear Regression (MLR) Analysis
STRENGTHS
1. It gives the statistical significance of total variance explained in the dependent variable (Aiken et al., 2003; Meyers et al., 2006; Gray et al., 2007).Information on the extent that certain independent variables are effective on the dependent variable free from randomization is given.
2. The relations between cause-effect between the variables are explained without experimental studies.
3. It enables figuring out how each independent variable is effective on the dependent variable to certain extent (to what extent it explains the dependent variable) (Aiken et al., 2003; Urbina, 2004; Meyers et al., 2006; Ho, 2006; Gray et al., 2007).
4. There is no need for measuring the dependent variable whose equation is established in new studies thanks to the general equations produced in order to be used on other similar groups.
5. MLR is used to control for confounding factors to evaluate the contribution of a specific variable or set of variables, i.e., identifying independent relationships (Ho, 2006, p.245).
6. MLR is used to find structural relationships and provide explanations for seemingly complex multivariate relationships, such as is done in path analysis (Ho, 2006, p.245).
WEAKNESSES/LIMITATIONS
1. Dependent and independent variables should demonstrate multivariate normal distribution and be continuous variables that are measured on at least equal interval scale. Moreover, assumptions such as linearity, homogeneity of variances, etc. should be fulfilled (Timm, 2002; Ho, 2006).In case assumptions are not fulfilled, this analysis cannot be used.
2. Dependent and independent variables should demonstrate single and multivariate normal distribution (Timm, 2002; Ho, 2006).It is difficult to achieve it at the same time.
3. Dependent and independent variables should consist of variable or variables demonstrating normal distribution (Timm, 2002; Ho, 2006). It is necessary to perform normality tests and it is difficult to meet normality assumptions for dependent and
independent variables at the same time.
4. Variance of error terms should demonstrate normal distribution (Timm, 2002; Ho, 2006), otherwise it can’t be used.
5. When effects of qualitative variables on dependent variable should be examined, such variables should be turned into dummy variables and included in the analysis (Ho, 2006). It is necessary to perform certain additional processes in order to examine predictor ability of qualitative variables.
6. There might be high relationships among independent variables (Timm, 2002; Ho, 2006; Gray et al., 2007).There shouldn’t be multicollineraity problem among the variables.
7. Sometimes it is necessary to understand which independent variable is more important/affects the dependent variable more (Ho, 2006; Gray et al., 2007).Firstly correlations should be determined.
OPPORTUNITIES
1. It provides results in different research designs to researchers since it can be used both in experimental and survey studies.
2. In simple linear regression analysis, there is only one factor affecting a case. However, social, economic, psychological, etc. cases vary with variables that are dependent on many factors (Gray, et al., 2007).Since researchers use more than one independent variable mostly in their studies, MLR provides opportunities to researchers according to simple linear regression analysis.
3. There are computer software packages such as SPSS that enable easy performance of MLR (Gray et al., 2007).
4. Analyses such as LR analysis and Structural equation modeling (SEM) that can be an alternative to MLR are not widely known/used.
5. There are three methods that are used widely in MLR. These are standard (direct), gradual and hierarchical methods (Ho, 2006, p.245). Different options can be presented to researchers with differing objectives in MLR.
THREATS/RISKS
1. In cases that dependent variable is given binary value such as 0 and 1 or it is a discrete variable containing more than two levels, normality assumptions are disturbed. Since logistic regression (LR) analysis doesn’t require normality assumption (Hosmer & Lemeshow, 2000; Tabachnick & Fidell, 2007), LR analysis poses an alternative to MLR.
2. In MLR, the measurement of the variables can be either continuous (metric) or dichotomous (nonmetric).When the dependent variable is dichotomous (coded 0-1), discriminant analysis is appropriate (Ho, 2006, p.246). DA poses an alternative to MLR.
3. In LR, there is no need independent variables should be continuous or not (Hosmer & Lemeshow, 2000; Tabachnick & Fidell, 2007), LR is preferred to MLR.
4. Many of multivariate techniques, for example LR analysis and discriminant analysis (DA), are similar to multiple regression in that they involve one dependent variable and two or more predictors but they do not necessarily require both the independent and dependent variables to be interval level (Gray et al., 2007, p.425).LR and DA pose an alternative to MLR since there is no assumption that the independent and dependent variables have to be interval level.
5. While the value of dependent variable is predicted in MLR, the probability of realization of one of the values that dependent variable may be given is predicted in LR analysis.LR analysis demonstrates the probability of occurrence of certain results (for instance “pass” or “fail”) for each subject (Urbina, 2004).LR analysis is preferred
to MLR when it is necessary to predict the realization probability of one of the values that dependent variable may be given.
6. Since LR analysis doesn’t require the relationship between dependent and independent variables to be linear (it can be a exponential or polynomial relationship too), it maintains the non-linear relationship and performs logarithmic conversions that make the form of the relationship linear (Gray et al, 2007).MLR, on the other hand, cannot be used if the relationships between dependent and independent variables are not linear.
7. In a multi grade model where there are dependent and independent variables with direct and indirect relationships, MLR can determine the direct effects and ignores the indirect effects of variables.(Urbina, 2004; Ho, 2006; Gray et al., 2007). SEM is more widely used since it can determine both direct and indirect relationships between variables in SEM.
8. It is reported that variance ratio that is explained in regression studies in which both MLR and SEM are used and that are performed on the same data set is higher in structural equation analyses. This is due to the fact that SEM takes into account both direct and indirect effects in the model compared to MLR (Ho, 2006).Especially in cases that it is known that one variable has mediation effect, utilization of SEM delivers better results compared to MLR.
9. MLR is mostly based on finding the independent variables that are effective in explaining the change in dependent variable. Path analysis is superior to MLR in explaining the causal relationships (Ho, 2006).Path analysis is more effective in explaining the causal relationships between variables.
10. Researcher reaches wrong results and comments if he/she uses a formula that has been obtained in a previous study without taking into account the sample (Urbina, 2004, p.194).Researchers use a formula obtained in an MLR without taking into account the sample.
SWOT Analysis for Logistic Regression Analysis (LR)
The goal of an analysis using LR is to find the best fitting model to
describe the relationship between the outcome (dependent or response
variable) and a set of independent (predictor or explanatory) variables
(Hosmer & Lemeshow, 2000, p.1 ; Pohar, Blas & Turk, 2004, p.144).
Table 2. SWOT Analysis for Logistic Regression Analysis (LR)
STRENGTHS
1. The model to be formed can define the relationship between dependent and independent variables in such a way to find the best harmony by using the least number of variables (Coşkun, Kartal, Coşkun & Bircan, 2004, p.42).
2. There is no constraint that independent variables should be continuous or not or be distributed normally (Tabachnick & Fidell, 2007).(There is no need to achieve circumstances such as normal distribution, linearity, continuity of variables, etc.). 3. It can be used in studies in which relationships are not linear since logarithmic
conversions that maintain non-linear relationships and make the form of the relationship linear can be made (Çokluk et al., 2012, p.61).
2007, p.19).
5. It is an analysis producing strong results since the probability of individuals to be included in such classes can be calculated while group membership of individuals in sample are being determined (Çokluk, 2010, p.1394).
6. It is a useful analysis since it can be used for predicting group memberships when variables are continuous, discrete or both continuous and discrete (Tabachnick & Fidell, 2007, p.24).
WEAKNESSES/LIMITATIONS
1. The process of establishing and developing the model becomes more complex since standard error predictions will increase if too many variables are included in the model (Oğuzlar, 2005, p.25).
2. Since efficiency and predictive strength of the logistic regression equation decrease as a result of keeping the variables that cannot explain the error in the equation (Kaşko, 2007, p.20), excessive measurement is done and reliability of the results decreases. 3. Since it is difficult to measure the effect of one unit increase in X variable in LR
model (Aktaş & Erkuş, 2009, p.52), usefulness of results decreases.
4. Sample sufficiency is important for implementing LR as in other regression analyses (Hosmer & Lemeshow, 2000, p.347) and, according to Long (1997, p.53-54), scope of usage narrows down in small samples since statistical tests of coefficients obtained by maximum probability predictions in cases where sample groups are fewer than 100 provide misleading results.
5. In logistic regression, the independent variables are combined in an exponent rather than directly. It makes the analyses conceptually more difficult for the researchers but well worth the effort (Tabachnick & Fidell, 2007, p.28).
OPPORTUNITIES
1. LR can be used in lieu of linear regression since it doesn’t have assumptions due to the fact that it is not possible to examine the results obtained in social sciences by means of linear regression models since they are mostly categorical (Çokluk et al., 2012, p.49).
2. LR is a more familiar and widespread analysis compared to past since it has become a method that is widely used in all areas (Girginer & Cankuş, 2008) from biology, medicine, economy, agriculture, veterinary medicine and carriage fields (Aktaş, 2009) to meteorology, domestic immigration movements and education (Çokluk, 2010).
3. As related by Caroll, Spiegelman, Gordon, Bailey & Abbott (1984, p.19), the studies of Gordon & Kannel (1968) on cardiologic diseases led the binary LR analyses and, as related by Duffy & Santner (1989), the application area of LR widened with studies in biostatic (Finney, 1971), customer selection analyses (Maddala, 1983), medicine (Brown, 1980) and criminology (Larntz, 1983).
4. LR is preferred to clustering analysis since the observations that are taken to data cluster new thanks to results obtained in LR can be assigned to groups (Başarır, 1990, as cited in Aktaş & Erkuş, 2009, p.50).
5. LR is preferred to DA since it requires less assumption compared to DA (Pohar et al., 2004).
6. While independent variables may consist of only continuous, only discrete or both at the same time in LR (Atar, 2012, p.287), LR is preferred to DA since DA can only be applied to continuous independent variables.
7. In case dependent variable is a discrete variable containing more than two levels or features two categories as 0 and 1, linear regression analysis cannot be applied and rather LR can be used (Bircan, 2004, p.187).
THREATS/RISKS
1. In order to assign the observations to groups within the data, clustering and DA are also used as much as LR (Kaşko, 2007).This narrows down the usage area of LR. 2. In cases sample number is less, if assumptions of DA are achieved, it is preferred to
LR (Atar, 2012).
3. Multiple regression is likely to be more powerful than logistic regression when the variables are continuous and the assumptions regarding it and the predictors are met (Tabachnick & Fidell, 2007, p.441).
4. Being frequently used in order to establish living space models by wild life researchers, LR is mostly used wrong by researchers since its assumptions cannot be understood sufficiently (Keating & Cherry, 2004).This is a negative example for researchers that would like to use LR.
5. While a group of 20 persons is accepted as sub-limit for each independent variable in regression analysis or DA in order to obtain decisive results, groups of 50 persons are needed in LR (Çokluk et al.2012, s.69).LR is preferred less by researchers working on minor samples.
SWOT Analysis for Discriminant Analysis (DA)
DA is a set of methods used to distinguish among groups in data and to
allocate new observations into the existing groups (Hardle & Simar, 2003,
p.330).The main goal of DA is to predict group membership from a set of
predictors (Tabachnick ve Fidell, 2007, p.375).
Table 3. SWOT Analysis for Discriminant Analysis (DA)
STRENGTHS
1. Since it separates groups the best using mathematical techniques (Altman, 1968; Akgül & Çevik, 2003; Altman & Hotchkiss, 2006), it is one of the techniques minimizing classification errors.
2. Since it is a technique whose conceptual and mathematical foundations for determining the independent variables that predict the membership pertaining to the levels of a categorical dependent variable are quite strong (Büyüköztürk & Çokluk-Bökeoğlu, 2008), it can determine the independent variables that predict the group membership of dependent variable when the assumptions are met.
3. The structure of differences between group centers can be determined as a result of the analysis (Nunnally & Bernstein, 1994; Büyüköztürk & Çokluk-Bökeoğlu, 2008). 4. Since the independent variables that determines the difference between the groups the
best can be determined (Timm, 2002; Nakip, 2003) and the variables that are not important in separating the groups can be eliminated (McLachlan, 1992; Timm, 2002), it is used in determining the independent variables that can and cannot separate the groups.
5. The percentage of the variance of the dependent variable that is explained by the independent variables as a result of the analysis can be determined (Garson, n.d., Tabachnick & Fidell, 2007).
6. It is an economic statistics since it enables binding of independent variables and dependent variable with a single equation (Balcı, 2001).
7. Although variance – covariance matrixes should be homogenous in linear DA (Özdamar, 2004; Tabachnick & Fidell, 2007; Büyüköztürk & Çokluk-Bökeoğlu, 2008), it can continue analysis by using different methods.
8. Wrong classification probabilities that are made as a result of the analysis can be observed (Özdamar, 2004; Tabachnick & Fidell, 2007).
WEAKNESSES/LIMITATIONS
1. Grouping mistakes that are made at the beginning due to the fact that groups are determined before analysis (Nunnally & Bernstein, 1994; McLachlan, 1992; Cangül, 2006) affect the DA results and established function.
2. The category of the dependent variable cannot be used when it consists of large numbers (Akgül & Çevik, 2003).
3. The assumptions that the sample size of the smallest group should be more than the number of independent variable and that group size should be 4-5 times bigger than the number independent variables (Poulsen & French, n.d.) and sample number in groups should at least 100 in total – at least 20 for each independent variable – (Kalaycı, 2010) cannot be achieved.
4. Many studies cannot reach the sample size that will meet the assumption that independent variables should demonstrate multivariate normal distribution (Green, Salkind & Akey, 2000; Tabachnick & Fidell, 2007; Kalaycı, 2010).
5. Wrong results come about in respect of statistical significance since DA is extremely sensitive to outliers (Tabachnick & Fidell, 2007).
6. The efficiency of the analysis is reduced in case there is multicollinearity between independent variables (Poulsen & French, n.d.; Kalaycı, 2010).
OPPORTUNITIES
1. When assumptions are in place, DA provides stronger results to researchers than LR (Tabachnick & Fidell, 2007).
2. It is the easiest way for separation between groups (Cangül, 2006) and separation between groups can be done easily with a strong method thanks to increase in the number of computerized statistical analysis software (Tabachnick & Fidell, 2007). 3. When the number of groups is more than two, DA is preferred in multi group studies
since it yields better results compared to LR (Hair, Black, Babin & Anderson, 2010). 4. While it is possible to use discriminant functions in future too, clustering analysis
produces results only pertaining to current situation (Tatlıdil, 1996).For this reason, results of DA are wider and more functional compared to the results of clustering analysis.
5. Researchers use DA in many different areas: For instance, although DA was first used in biology (Altman & Hotchkiss, 2006) and medical sciences, it is being used in education, engineering and psychology (Huberty & Olejnik, 2006) and banking sector (Altman, 1968; Akgül & Çevik, 2003).
6. It can be used in studies where experimental patterns are included (Cangül, 2006).
THREATS/RISKS
1. Researchers don’t have the advanced statistical knowledge to understand whether DA meets strong assumptions or not.
2. It requires complex calculation and advanced mathematics knowledge and it is difficult to interpret the results (Balcı, 2001), consequently especially social scientists have difficulty in using and interpreting DA without using statistical package software.
3. When dependent variable is continuous, multi linear regression is preferred to DA. 4. LR, which is more flexible in respect of assumptions, is preferred to DA (Poulsen &
SWOT Analysis for Structural Equation Modeling (SEM)
Structural equation modeling (SEM) is a collection of statistical
techniques that allow a set of relationships between one or more independent
variables, either continuous or discrete, and one or more dependent
variables, either continuous or discrete, to be examined (Ullman, 2007;
p.676).
Table 4. SWOT Analysis for Structural Equation Modeling (SEM)
STRENGTHS
1. It presents information on cause-effect connections between variables without need for experimental patterns (Tomarken & Waller, 2004; Ullman, 2006).
2. It provides a different approach in the analysis of data obtained from longitudinal researches and this facilitates the analysis of data obtained from repeated measurements (Brown, 2006; Jöreskog, 1990; Tomarken & Waller, 2004).
3. It features the prediction methods that have been developed in order to analyze abnormal distributions recently. These include the practices realized with robust arrangements. In addition, SEM studies can be realized in cases that covariance structures don’t feature normal distribution (Tomarken & Waller, 2005).
4. Results are reliable since errors in structures that are measured are tried to be eliminated (Şimşek, 2007).
5. Since it can be observed how a certain feature or model defined thanks to multi group applications in SEM changes in different cultures, it supports inter culture comparisons that are performed especially in social sciences (Şimşek, 2007).
WEAKNESSES/LIMITATIONS
1. Verification of a model whose theoretical knowledge is weak cannot prove the validity of that model alone and suspicion is raised in such model scientifically. Accordingly, researcher is expected to have a literature knowledge that shall support the model either theoretically or empirically (Çokluk et al., 2011; Şimşek, 2007).There should be extensive literature screening that supports the model covering the latest literature in model testing studies.
2. Since excessive growth of the sample causes excessive increase in chi-square value (Çokluk et al., 2011; Şimşek, 2007; Yılmaz & Çelik, 2009), only a certain part of samples is used although data is collected from major samples in many studies. 3. Since >200 is suggested for sample size (Çokluk et al., 2011; Tomarken & Waller,
2004), generalizability of the models formed with the data obtained from minor French, n.d.).
5. LR is preferred to DA since it is easier to interpret the model obtained by LR (Tatlıdil, 1996; Tabachnick & Fidell, 2007).
6. Since DA and clustering analysis have similarities (Timm, 2002), the researchers that cannot determine their objective well may use these two analyses in place of each other.
7. Since DA and MANOVA are contrasting in respect of dependent and independent variables (Green et al., 2000; Tabachnick & Fidell, 2007; Hair et al., 2010), the researchers that couldn’t define the variables may use these two analyses in place of each other.
samples is weak.
4. Since the data set should fulfill assumptions such as normality, linearity, multi linearity and multicollinearity while testing the model (Schermelleh-Engel, Moosbrugger & Müller, 2003) and this is not fulfilled in the data set obtained from many samples, it brings a constraint to the usage area of the analysis and it requires carriage,
5. Multi regression analysis is preferred when it is difficult to assess the linearity between latent variables and there are non-linear relationships (Ullman, 2007). 6. It is a sign that model is a poor fitting model when distributions pertaining to error
covariance feature asymmetrical quality (Ullman, 2007).
OPPORTUNITIES
1. It is preferred by researchers since it enables researchers to – especially in psychology – the processes under the circumstances with less analyses (Çokluk et al., 2011). 2. It is preferred by the researchers in social sciences recently since it enables realizing
the relationships between variables and testing the hypothesis (Crowley & Fan, 1997).
3. The support given by studies and institutions on intercultural comparisons to such studies increase as a result of the fact that TIMSS, PISA, Wechsler intelligence scales and many other interest, intelligence, personality, ability and similar variable measuring tools are adapted to different cultures (Hambleton & Jong, 2003).
4. The number of persons that have learnt this technique has increased recently (Tomarken & Waller, 2004).
5. There is no need to recollect data since it enables alternative model testing (Şimşek, 2007) with data set at hand when researcher tends towards alternative model if current model is not verified.
6. Relationship coefficients that are calculated in SEM are denominated as actual relationship coefficient and found to be higher than relationship coefficients calculated by standard methods. This is in advantage of SEM and for that reason preferred by the researcher in formation of model (Şimşek, 2007).
7. It is preferred to other multivariate statistical techniques since it features both exploratory and confirmative feature compared to other multivariate statistics techniques (Crowley & Fan, 1997).
8. While it is necessary to perform more than one application with regression analysis in determining the regression levels and relationships between variables, this can be done at a single step in SEM studies (Durgun & Kocagöz, 2010) and consequently preferred to regression analysis.
9. Contrary to many analyses explaining the effects of variables, the direct and indirect effects between variables (latent and observed) can be determined by means of Path Analysis within the scope of SEM (Crowley & Fan, 1997; Durgun & Kocagöz, 2010; Ullman, 2007).
10. The situation can be tolerated by adding a mechanism to the model pertaining to loss values by means of statistical package software in case there are lost values in data set (Ullman, 2007).
THREATS/RISKS
1. Some researchers abstain from this technique since they see it as a complex technique.
2. Researchers may feel desperate since they get to know this technique new and resources are limited (Şimşek, 2007).
3. Researchers may give wrong decisions when they are not in full control of conformity indexes.Especially handling the chi-square goodness of fit indexes alone in data set to
be obtained from big size samples may cause taking wrong decisions.Researchers don’t have sufficient knowledge about all goodness of fit indices (CFI, GFI, AGFI, RMSEA, etc.).
4. It should be remembered that the causality in SEM is only a theoretical causality.Especially, if the case is performing causal charging studies, it is suggested to establish a different research pattern instead of a statistical technique (Çokluk et al., 2011; Şimşek, 2007; Ullman, 2007).The causality relationships that are obtained at the end of SEM are interpreted as causality in experimental patterns.
5. It is not considered an appropriate approach for researchers to express that the model has been completely verified with the feeling of excitement when the model obtained in a SEM study has been verified.The expression that is suggested here is that it should be assumed that the obtained model is the verifiable model among other probable models (Şimşek, 2007).The researcher may ignore other probable models due to excessive value attached to obtained model.
6. Researchers are probable to commit type I error when there are modifications pertaining to tested model or alternative models are suggested in SEM studies (Ullman, 2007).
7. It is a risk for scientific domain that verification can be done based on chance with the data set at hand (Şimşek, 2007).
8. The researchers that don’t have sufficient theoretical knowledge in SEM and in the researched subject have tend to use this technique recently.
DISCUSSION AND CONCLUSION
It can be seen that each of MLR, LR, DA and SEM statistical analyses
that were examined within the scope of this study has strong and weak sides
compared to other analyses used in regression studies. The important thing is
that we should correctly determine which analysis we should use in respect
of many variables. Advanced/multivariate statistical analyses seem quite
difficult for social scientists and it is considered problematic to apply and
interpret them. Indeed, the individuals with knowledge on simple statistical
analyses can use such analyses correctly when they pay attention to the
assumptions of these analyses and use a good guide.
In this study, it was aimed to provide knowledge far from the
knowledge based on theory and formula on various sides of these analyses.
Researchers should remember that comments that are obtained as a result of
wrongly selected statistical analysis don’t matter at all. Furthermore,
researchers should choose using “statistical analyses as per research design”
– if necessary by learning – instead of forming research pattern according to
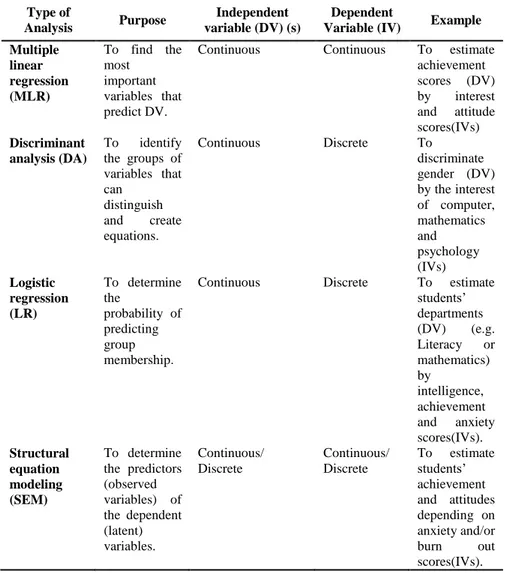
“known statistical analyses” which is widely preferred by researchers. Table
5 shows the choice of the statistical analysis according to features of the
purpose and data in the predictive studies.
Table 5. The Choice of the statistical analysis according to features of the purpose and
data in the predictive studies
Type of
Analysis Purpose
Independent variable (DV) (s)
Dependent
Variable (IV) Example Multiple linear regression (MLR) To find the most important variables that predict DV.
Continuous Continuous To estimate
achievement scores (DV) by interest and attitude scores(IVs) Discriminant analysis (DA) To identify the groups of variables that can distinguish and create equations. Continuous Discrete To discriminate gender (DV) by the interest of computer, mathematics and psychology (IVs) Logistic regression (LR) To determine the probability of predicting group membership.
Continuous Discrete To estimate
students’ departments (DV) (e.g. Literacy or mathematics) by intelligence, achievement and anxiety scores(IVs). Structural equation modeling (SEM) To determine the predictors (observed variables) of the dependent (latent) variables. Continuous/ Discrete Continuous/ Discrete To estimate students’ achievement and attitudes depending on anxiety and/or burn out scores(IVs).
REFERENCES
Aiken, L. S. & West, S. G. (2005). Multiple linear regression.In Everitt, B.S. & Howel, D.C .(Eds.), Encyclopedia of Statistics in Behavioral Science - Volume 3. (pp.1333–1338). Chicester, UK: John Wiley & Sons, Inc.
Aiken, L. S., West, S. G.,&Pitts, S.C. (2003). Multiple linear regression.In A.Weiner, I.B.(Eds.), Handbook of Psychology - Volume 2 Research Methods in Psychology. (pp.483-506). New Jersey: John Wiley & Sons, Inc.
Akgül, A. & Çevik, O. (2003). İstatistiksel analiz teknikleri “SPSS’te işletme uygulamaları”. (Statistical analysis techniques “Management apllication in SPSS”). Ankara: Emek Ofset.
Aktaş, C. (2009). Lojistik regresyon analizi: Öğrencilerin sigara içme alışkanlıkları üzerine bir uygulama. (The logistic regression analysis and its application on the smoking prevalence of students). Sosyal Bilimler Enstitüsü Dergisi, 26, 107-121.
Aktaş, C. & Erkuş, O.(2009). Lojistik regresyon analizi ile Eskişehir’in sis kestiriminin incelenmesi. (Investigation of fog forecasting of Eskişehir using logistic regression analysis). İstanbul Ticaret Üniversitesi Fen Bilimleri Dergisi, 16, 47-59.
Aksu, M. B. (2002). Eğitimde stratejik planlama ve toplam kalite yönetimi. (Strategic planning in education and total quality management) Ankara: Anı Yayıncılık.
Altman, E.I. (1968). Financial ratio’s discriminant analysis and the prediction of corporate bankruptcy. Journal of Finance.23 (4), 589-609.
Altman, E. I. & Hotchkiss, E. (2006). Corporate financial distress and bankruptcy (3th ed.).New Jersey: John Wiley & Sons.
Atar, H. Y. (2012). Resim iş öğretmenliği özel yetenek sınavlarının sınıflama doğruluğu üzerine bir çalışma. (A study on the classification accuracy of art teaching special aptitude exams). Eğitim ve Bilim, 37, 163.
Balcı, A. (2001). Sosyal bilimlerde araştırma: Yöntem, teknik ve ilkeler. (Research for social sciences: Methods, techniques and principles). Ankara: PegamA. Birel, F. K. (2008).“Çankaya ve Bismil İlçe Milli Eğitim Müdürlüklerinin güç
çözümlemesi (Swot analizi).” (Strength Analysis (SWOT) of Governorship of National Education of Bismil Districts) (Yayımlanmamış Doktora Tezi). Ankara: Hacettepe Üniversitesi.
Bircan, H. (2004). Lojistik Regresyon analizi: Tıp verileri üzerine bir uygulama. (Logistic regression analysis: An application on medicine data). Kocaeli Üniversitesi Sosyal Bilimler Enstitüsü Dergisi, 2, 185-208.
Brown, T. A. (2006). Confimatory factor analysis for applied research. London: The Guilford.
Büyüköztürk, Ş. & Çokluk-Bökeoğlu, Ö. (2008). Discriminant function analysis: Concept and application. Eğitim Araştırmaları - Eurasian Journal of Educational Research, 33, 73-92.
Cangül, O. (2006). Diskriminant analizi ve bir uygulama denemesi. (Discriminant analysis and an application trial) (Yayımlanmamış yüksek lisans tezi). Uludağ Üniversitesi, Sosyal Bilimler Enstitüsü, Bursa.
Carroll, R. J., Spiegelman, C. H., Gordon K. K., Bailey, K. T. & Abbott, R. D.(1984). On errors-in-variables for binary regression models. Biometrika, 71 (1), 19-25.
Chattarjee, S. & Hadi, A. S.(2006). Regression analysis by example (4th Ed.). New Jersey: John Wiley & Sons.
Çokluk, Ö. (2010). Lojistik regresyon analizi: Kavram ve uygulama. (Logistic regression:Concept and application). Kuram ve Uygulamada Eğitim Bilimleri, 10 (3), 1357-1407.
Çokluk, Ö., Şekercioğlu, G. & Büyüköztürk, Ş. (2011). Sosyal bilimler için çok değişkenli istatistik: SPSS ve LISREL uygulamaları (Multivariate statistics for social sciences: SPSS and LISREL applications). Ankara: PegemA.
Çokluk, Ö., Büyüköztürk, Ş. & Şekercioğlu, G. (2012). Sosyal bilimler için çok değişkenli istatistik SPSS ve LISREL uygulamaları (2.baskı). (Multivariate statistics, SPSS and LISREL applications for social sciences). Ankara: Pegem Yayıncılık.
Coşkun, S., Kartal, M., Coşkun, A. & Bircan, H. (2004). Lojistik regresyon analizinin incelenmesi ve diş hekimliğinde bir uygulaması. (Examining logistic regression analysis and an an application on dentistry). Cumhuriyet Üniversitesi Diş Hekimliği Fakültesi Dergisi, 7 (1).
Croux, C., Haesbroeck, G. & Joossens, K.(2008). Logistic discrimination using robust estimators. Canadian Journal of Statistics, 36 (1),157-174.
Crowley, S.L. & Fan, X. (1997). Structural equation modeling: Basic concepts and applications in personality assesment research. Journal of Personality Assesment, 68 (3), 508-531.
Dinçer, O. (1994). Stratejik yönetim ve ı şletme politikası.(Strategical management and the policy of management) (3.Baskı). İstanbul: İz Yayıncılık.
Duffy, D.E. & Santner, T.J. (1989). On the small sample properties of norm-restricted maximum likelihood estimators logistic regression models. Mathematical Sciences Institute, Cornell University.
Durgun, Y. & Kocagöz, E. (2010). Yapısal eşitlik modellemesi ve regresyon: Karşılaştırmalı bir analiz. (Structural equation modeling and regression: A comparative analysis). Erciyes Üniversitesi İktisadi ve İdari Bilimler Fakültesi Dergisi, 35, 1-17.
Garson, G.D.(n.d). Discriminant function analysis. Retreived 7.8.2012 from http://www.faculty.chass.ncsu.edu/garson/PA765/discrim.htm
Girginer, N. & Cankuş, B. (2008). Tramvay yolcu memnuniyetinin lojistik regresyon analiziyle ölçülmesi: Estram örneği. (Measuring the traveller satisfaction of tram using logistic regression: A case study of estram). Yönetim ve Ekonomi, 15 (1).
Gray, P. S., Williamson, J. B., Karp D. A. & Dalphin, J. R.(2007). The research imagination: An introduction to qualitative and quantitative methods. New York: Cambridge University Press.
Green, S.B., Salkind, N.J. & Akey, T.M. (2000). Using SPSS for Windows: Analyzing and understanding data. New Jersey: Prentice Hall.
Hair, J.F., Black, B., Babin, B. & Anderson, E.R. (2010). Multivariate data analysis (7th ed.). New Jersey: Prentice-Hall.
Hambleton, R.K. & De Jong, J.H.A.L. (2003). Advances in translating and adapting educational and psychological tests. Language Testing, 20 (2), 127-134. Hardle, W. & Simar, L. (2003). Applied multivariate statistical analysis.
Method&Data Technologies.
Ho, R. (2006). Handbook of univariate and multivariate data analysis and interpretation with SPSS. New York: Chapman & Hall/CRC.
Hosmer.D.W. & Lemeshow, S. (2000). Applied logistic regression (2nd ed.). New York: John Wiley& Sons Inc.
Huberty, C.J. & Olejnık, S. (2006). Applied MANOVA and discriminant analysis. New Jersey: JohnWiley&Sons Inc.
Jöreskog, K. G. (1990). New developments in LISREL: Analysis of ordinal variables using polychoric correlations and weighted least squares. Quality & Quantity, 24, 387-404.
Kalaycı, Ş. (2010). SPSS uygulamalı çok değişkenli istatistik teknikleri. (Multivariate statistical analysis using SPSS) Ankara: Asil Yayın Dağıtım. Kaşko, Y. (2007). Çoklu bağlantı durumunda ikili (binary) lojistik regresyon
modelinde gerçekleşen I.tip hata ve testin gücü. (The observed type I error and power of logistic regression model under multicollinearity). Yayımlanmış yüksek lisans tezi. Ankara Üniversitesi, Fen Bilimleri Enstitüsü, Ankara. Keating, K.A. & Cherry, S. (2004). Use and interpretation of logistic regression in
habitat-selection studies. Journal of Wildlife Management, 68, 774-789. Long, S.J. (1997). Regression models for categorical and limited dependent
variables. Thousand Oaks: Sage Publications.
McLachlan, G. J.(1992). Discriminant analysis and statistical pattern recognition. New Jersey: John Wiley & Sons.
Meyers, L. S., Gamit, G. & Guamino, A.J. (2006). Applied multivariate research design and interpretation. London: Sage Publications.
Nakip, M. (2003). Pazarlama araştırmaları: Teknikler ve (SPSS destekli) uygulamalar. (Marketing Research: Techniques and (SPSS supported) applications). Ankara: Seçkin Yayıncılık.
Nunnally, J. & Bernstein, I. (1994). Psychometric theory. New York: McGraw-Hill. Oğuzlar, A. (2005). Lojistik regresyon analizi yardımıyla suçlu profilinin belirlenmesi. (Defining profiles of criminals by using logistic regression). İktisadi ve İdari Bilimler Dergisi, 19 (1).
Orhunbilge, N. (2010). Çok değişkenli istatistik yöntemler. (Multi variables statistical methods). İstanbul: İ. Ü. Basım ve Yayınevi Müdürlüğü.
Özdamar, K. (2004). Paket programlar ile istatistiksel veri analizi. (Statistical data analysis by package programs). Eskişehir: Kaan Kitabevi.
Pohar M., Blas M. & Turk, S. (2004). Comparison of logistic regression and linear discriminant analysis: A simulation study. Metodološki zvezki, 1 (1), 143-161.
Poulsen, J. & French, A. (n.d.). Discriminant function analysis.Retreived 7.8.2012 from http://userwww.sfsu.edu/~efc/classes/biol710/discrim/discrim.pdf Rencher, A.C. (2002). Methods of multivariate analysis (2nd ed.). New York: John
Wiley & Sons, Inc.
Schermelleh-Engel, K., Moosbrugger, H. & Müller, H. (2003). Evaluating the fit of strcutural equation models: Tests of significance and descriptive goodness-of-fit measures. Methods of Psychological Research Online, 8 (2), 23-74.
Sümer, N.(2000).Yapısal eşitlik modelleri. (Structural equation models). Türk Psikoloji Yazıları, 3 (6), 49-74.
Şimşek, Ö.F. (2007). Yapısal eşitlik modellemesine giriş: Temel ilkeler ve LISREL uygulamaları (Introduction to structural equation modeling: Basic principles and LISREL applications). Ankara: Ekinoks.
Tabachnick, B.G. & Fidell, L.S. (2007). Using multivariate statistics (5th ed.). Boston: Pearson Education Inc.
Tatlıdil, H. (1996). Uygulamalı çok değişkenli istatistiksel analiz. (Applied multivariate statistical analysis) Ankara: Akademi Matbaası.
Timm, N.H. (2002). Applied multivariate analysis. New York: Springer-Verlag. Tomarken, A.J. & Waller, N.G. (2004). Structural equation modeling: Strengths,
limitations and misconceptions. Annual Review of Clinical Psychology, 1, 31-65.
Ullman, J.B. (2006). Structural equation modeling: Reviewing the basics and moving forward. Journal of Personality Assesment, 87 (1), 35-50.
Ullman, J.B. (2007). Structural equation modeling. In B.G.Tabachnick and L.S.Fidell (Eds.), Using multivariate statistics (pp.676-780), (5th ed.). New York: Allyn and Bacon.
Urbina, S. (2004). Essentials of psychological testing. New Jersey: John Wiley & Sons, Inc.
Yılmaz, V.&Çelik, H.E. (2009). Yapısal eşitlik modellemesi I (Structural equation modeling I).Ankara: Pegem Yay.