THE REPUBLIC OF TURKEY
BAHCESEHIR UNIVERSITY
DEMAND FORECASTING
IN MOBILE PHONE INDUSTRY
Master Thesis
ZEYNEP ÖRNEK
THE REPUBLIC OF TURKEY
BAHCESEHIR UNIVERSITY
GRADUATE SCHOOL OF NATURAL AND APPLIED
SCIENCES
INDUSTRIAL ENGINEERING
DEMAND FORECASTING
IN MOBILE PHONE INDUSTRY
Master Thesis
ZEYNEP ÖRNEK
Thesis Supervisor: ASST. PROF. ADNAN ÇORUM
i
THE REPUBLIC OF TURKEY BAHCESEHIR UNIVERSITY
GRADUATE SCHOOL OF NATURAL AND APPLIED SCIENCES INDUSTRIAL ENGINEERING
Name of the thesis: Demand Forecasting in Mobile Phone Industry Name/Last Name of the Student: Zeynep ÖRNEK
Date of the Defense of Thesis: 26.01.2018
The thesis has been approved by the Graduate School of Natural And Applied Sciences.
Prof. Dr. Nafız ARICA Graduate School Director
Signature
I certify that this thesis meets all the requirements as a thesis for the degree of Master of Arts.
Asst. Prof. Adnan ÇORUM Program Coordinator
Signature
This is to certify that we have read this thesis and we find it fully adequate in scope, quality and content, as a thesis for the degree of Master of Arts.
Examining Committee Members Signature____
Thesis Supervisor
Asst. Prof. Adnan ÇORUM --- Member
Asst. Prof. Ethem ÇANAKOĞLU --- Member
---ACKNOWLEDGEMENTS
Firstly, I thank to my mother and my brother for their unquestioning support that they have always gave me.
I thank to Sebahattin Yaman, Muzaffer Gölcü and Osman Varoğlu who helped me to choose incredible thesis subject and always encouraged me about my academic life. And, of course, I thank to my supervisor Asst. Prof. Adnan Çorum and Asst. Prof. Okan Şakar for their guidance, patience and continuous support throughout this study.
iv
ABSTRACT
DEMAND FORECASTING IN MOBILE PHONE INDUSTRY
ZEYNEP ÖRNEK Industrial Engineering
Thesis Supervisor: Asst. Prof. Adnan Çorum January 2018, 103 pages
The ever-changing developments in information and communication technologies in the globalizing world, the ever-increasing product variety in the sectors and the constant exacerbation of competition have led businesses to search for ways to achieve sustainable competitive advantage.
At the beginning of this kind of search is the management of all production, marketing and procurement processes with high performance from the strategic direction. In order to achieve sustainable competitive advantage especially for the enterprises in the mobile phone sector, it is very important for them to successfully predict the future strategic decisions to be taken within the scope of "supply chain management" (SCM) and "inventory management".
Quantitative and qualitative research models are employed together in this study, which the main objective is to determine effective demand forecasting method in order to provide full-time optimization of the SCM and inventory management processes of the enterprises in the mobile phone sector.
Within the scope of the research, similar researches abroad and domestically conducted for the basic concept and topic of the research have been searched and examined. Thus, the theoretical frame and method of the thesis have been tried to be determined. In the second phase of the study, the data of two telephone models subject to demand forecasting within the scope of this research by employing Negative Binomial Regression (NBR) Analysis, time series analysis and machine learning method. The quantitative findings obtained by using the listed methods have been tried to be interpreted in the light of qualitative information and findings obtained as a result of the literature review.
As a result of the research; Through NBR and time series analyzes, demand estimates for the mobile phone industry including weekly and monthly periods have been reached, which will enable more reliable sales forecasts for the future of the mobile phone industry. In addition, the optimum number of phones that mobile phone operators have stored in their stock before offering the sale is determined as a result of research. Another result of the study is that; the more precise and clear quantitative method for demand forecast method in mobile phone sector comparing the traditional methods is “machine learning” method.
v
Finally, in the research, the optimum amount of stocking and potential sales on a weekly and monthly basis were predicted by using random forest algorithm for a new mobile phone product offered for sale to national and global markets and another mobile phone pre-marketed.
Keywords: Mobile Phone Sector, SCM, Inventory Management, Demand Forecasting, Machine Learning Method
vi
ÖZET
MOBİL TELEFON ENDÜSTRİSİNDE TALEP PLANLAMASI Zeynep Örnek
Endüstri Mühendisliği
Tez Danışmanı:Yrd. Doç. Dr. Adnan Çorum Ocak 2018, 103 sayfa
Küreselleşen dünyada bilişim ve iletişim teknolojilerinde her geçen gün yaşanan gelişmeler, sektörlerde giderek artan ürün çeşitlilikleri verekabetin sürekli şiddetlenmesi işletmeleri sürdürebilir rekabet avantajı sağlamaya yönelik arayışlara yöneltmiştir. Bu tür arayışların en başında ise işletmelerin stratejik yönden tüm üretim, pazarlama ve tedarik süreçlerini yüksek performansla yönetmeleri gelmektedir.Özellikle mobil telefon sektöründeki işletmeler açısından yeni ekonomik düzende sürdürebilir rekabet avantajı elde edebilmek için “tedarik zinciri yönetimi” (TZY) ve “envanter yönetimi” kapsamında almaları gereken stratejik kararları, geleceği başarılı bir şekilde tahmin ederek oluşturmaları oldukça önemlidir.
Temel amacı, mobil telefon sektöründeki işletmelerin TZY ve envanter yönetimi süreçlerinde tam zamanlı optimizasyonu sağlamak üzere etkili talep tahmini yöntemi belirlemek olan bu araştırmada nitel ve nicel araştırma yöntemler birlikte kullanılmıştır. Araştırma kapsamında öncelikle araştırmanın temel kavram ve konusuna yönelik daha önce yurt dışında ve yurt içinde yapılmış benzer araştırmalar toplanmış ve incelenmiştir. Böylece tezin teorik çerçevesi ve yöntemi belirlenmeye çalışılmıştır. Araştırmanın ikinci aşamasında bu araştırma kapsamında talep tahminine konu edilen iki telefon modeline ait toplanan nicel veriler; kantatif talep tahmin yöntemi olarak literatürde anılan NBR modeli, zaman serileri analizi ve makine öğrenme yöntemi kullanılarak analiz edilmiştir. Sayılan yöntemler kullanılarak ulaşılan nicel bulgular ise, literatür incelemesi sonucunda ulaşılan nitel bilgi ve bulgular ışığında yorumlanmaya çalışılmıştır.
Araştırma sonucunda; NBR ve zaman serisi analizleri aracılığıyla ulaşılan bulgular, mobil telefon sektöründeki işletmelerin geleceği için daha güvenilir satış tahminlerini yapmalarını sağlayacak nitelikte haftalık ve aylık periyotlar içeren talep tahminlerine ulaşılmıştır. Bunun yanı sıra mobil telefon işletmelerinin satışa sunmadan önce stoklarında depoladıkları telefonların optimum sayısı araştırma sonucunda belirlenmiştir. Araştırmanın diğer bir sonucu da mobil telefon sektöründe geleneksel yöntemlerle yapılan talep tahminlerine göre çok daha net ve doğruluk düzeyi yüksek talep tahmininde bulunmaya olanak veren kantatif talep tahmin yönteminin ise “makine öğrenmesi” yönteminin, “random forest algoritması” olduğu tespit edilmiştir.
Araştırmada son olarak, random forest algoritması kullanılarak ulusal ve küresel pazarlara satışa sunulan yeni bir mobil telefon ürünü ile önceden satışa sunulan başka bir mobil telefonun, optimum düzeyde olması gereken stoklama ve potansiyel satış
vii
miktarlarını, haftalık ve aylık periyotta belirleyecek nitelikte kesin ve net bulgulara ulaşılmıştır.
Anahtar Kelimeler: Mobil Telefon Sektörü, TZY, Envanter Yönetimi, Talep Tahmini, Makine Öğrenme Yöntemi
viii CONTENTS ABSTRACT ... iv CONTENTS ... viii TABLES ... x ABBREVIATIONS ... xiii 1. INTRODUCTION ... 1 2. LITERATURE REVIEW ... 7 2.1 THEORETICAL FRAMEWORK ... 7
2.1.1 Supply Chain Management in Enterprises (SCM) ... 7
2.1.2 Inventory (Stock) Management Processes in Businesses ... 9
2.1.3 Order Policies in Inventory Management ... 11
2.1.4 Demand Management and Forecasting in Enterprises ... 12
2.1.5 Methods Used in Demand Forecasting and Machine Learning Method . 15 2.2 LITERATURE REVIEW OF RESEARCH HYPOTHESES ... 17
2.3 LITERATURE REVIEW FOR THE RESEARCH METHOD ... 20
2.3.1 Use of Time Series in Demand Forecasting ... 21
2.3.2 Use of Regression Analysis in Demand Forecasting ... 23
2.3.3 Use of Machine Learning Method in Demand Forecasting ... 25
2.4 METHODS USED IN DEMAND FORECASTING IN THE MOBILE ... 27
TELEPHONE SECTOR ... 27
2.5 THE GLOBAL DEVELOPMENTS OF MOBİLE PHONE SECTOR ... 29
3. DATA AND METHODOLOGY ... 45
3.1 AIMS AND OBJECTIVES OF THE RESEARCH ... 45
3.2 RESEARCH METHOD ... 45
3.3 RESEARCH DATA AND VARIABLES ... 46
3.4 METHODS USED IN THE ANALYSIS OF RESEARCH DATA ... 47
3.4.1 Time Series Analysis Method... 48
3.4.1.1 Simple Moving Average ... 48
3.4.1.2 Single Exponential Smoothing ... 48
3.4.1.3 Weighted Moving Average (3 period) ... 49
3.4.1.4. Trend Adjusted Exponential Smoothing ... 50
3.4.1.5 Trend and Seasonal Effects ... 50
ix
3.4.2 Negative Binomial Regression (NBR) Analysis Method ... 51
3.4.3 Machine Learning Analysis Method ... 54
4.1 NEGATIVE BINOMIAL REGRESYON (NBR) ANALYSIS FINDINGS ... 57
4.1.1 Demand Forecast for (A) Phone Model ... 57
4.1.1.1 Descriptive Statistics for (A) Phone Model ... 57
4.1.1.2 Findings of the Correlation Analysis for (A) Mobile Phone Model... 60
4.1.1.3 Findings of NBR Analysis for (A) Mobile Phone Model ... 63
4.2.2 Demand Forecast for (B) Mobile Phone Model ... 69
4.2.2.1 Descriptive Statistics for (B) Mobile Phone Model ... 69
4.2.2.2 Findings of Correlation Analysis for (B) Mobile Phone Model ... 72
4.2.2.3 Findings of NBR Analysis for (B) Mobile Phone Model ... 74
4.2 TIME SERIES ANALYSIS FINDINGS ... 80
4.2.1 Time Series Forecasting for (A) Mobile Phone Model ... 80
4.2.1.1 Simple Moving Average ... 80
4.2.1.2 Weighted Moving Average (3 period) ... 81
4.2.1.3 Single Exponential Smoothing ... 81
4.2.1.4 Trend Adjusted Exponential Smoothing ... 82
4.2.1.5 Trend and Seasonal Effects ... 83
4.2.2.6 Linear Trend ... 84
4.2.2 Time Series Forecasting for (B) Mobile Phone Model ... 86
4.2.2.1 Simple Moving Average ... 86
4.2.2.2 Weighted Moving Average (3 period) ... 87
4.2.2.3 Single Exponential Smoothing ... 88
4.2.2.4 Trend Adjusted Exponential Smoothing ... 88
4.2.2.5 Trend and Seasonal Effects ... 89
4.2.2.6 Linear Trend ... 90
4.3 MACHINE LEARNING ANALYSIS FINDINGS ... 92
5. DISCUSSION ... 96
6. CONCLUSION AND SUGGESTIONS ... 101
x
TABLES
Table 3.1: Values Related to the Independent Variables of the Study... 46
Table 4.1: Descriptive Statistics for the (A) Mobile Phone Model ... 58
Table 4.2: Descriptive Statistics for (A) Mobile Phone Model ... 60
Table 4.3: Truncated Correlation Matrix for the Dependent Variable Only... 61
Table 4.4: NBR Findings for (A) Mobile Phone – Model 1 and Model 2 ... 64
Table 4.5: NBR Findings for (A) Mobile phone- Model 3 and Model 4 ... 66
Table 4.6: Descriptive Statistics for (B) Mobile Phone Model ... 70
Table 4.7. Descriptive Statistics for (B) Mobile Phone Model ... 71
Table 4.8: Correlation Matrix for the Dependent Variable Only ... 73
Table 4.9: NBR Findings for (B) Mobile Phone: Model 1 and Model 2 ... 75
Table 4.10: NBR Findings for (B) Mobile Phone- Model 3 and Model 4 ... 78
Table 4.11: The Precisions of the Forecasting Models for (A) Mobile Phone Model .... 85
Table 4.12.The precisions of the forecasting models for (B) Mobile Phone Model ... 91
Table 4.13: (A) Mobile Phone Model Sim Activation Prediction/ Next Week ... 92
Table 4.14: (A) Mobile Phone Model Sim Activation Prediction / Next Month ... 93
xi
FIGURES
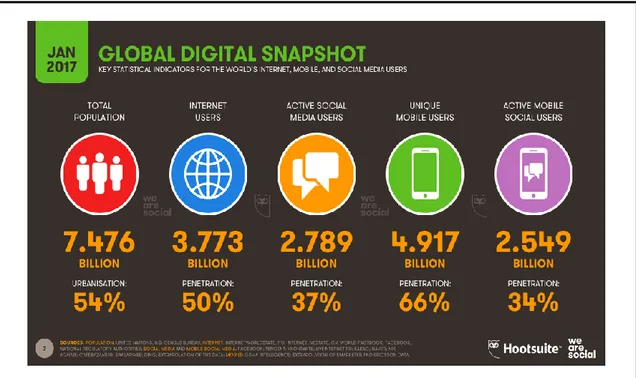
Figure 2.1: Number of Internet and Social Media Users in the World ... 30
Figure 2.2: Number of Internet Users and its Ratio to the World Population ... 31
Figure 2.3: Increases in the Number of Internet-Social Media Users in the World (2016-2017) ... 32
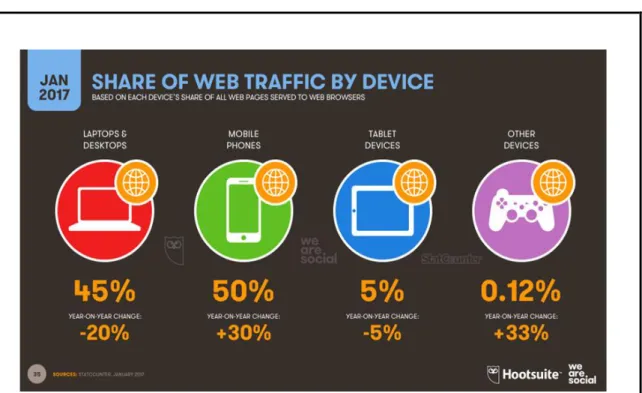
Figure 2.4: Share of Web Traffic by Device (2016-2017) ... 33
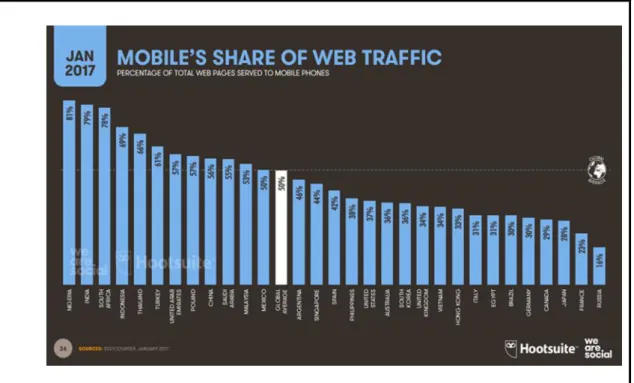
Figure 2.5: Mobile's Share of Web Traffic (2016-2017) ... 34
Figure 2.6: The Comparison of Mobile User of Mobile Connections ... 34
Figure 2.7: The Perspective of Mobile User Connections ... 35
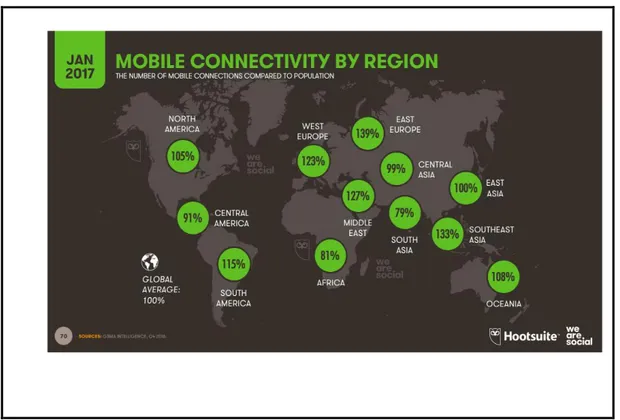
Figure 2.8: Mobile Connectivity by Region ... 36
Figure 2.9: Share of Mobile Web by Mobile Operation Systems ... 36
Figure 2.10: Global Smartphone Shipments Forecast From 2010 to 2021 ... 37
Figure 2.11: Global Revenue From Smartphone Sales From 2013 to 2017 (In Billion US Dollars) ... 38
Figure 2.13: Turkey's Internet and Social Media Usage Statistics ... 39
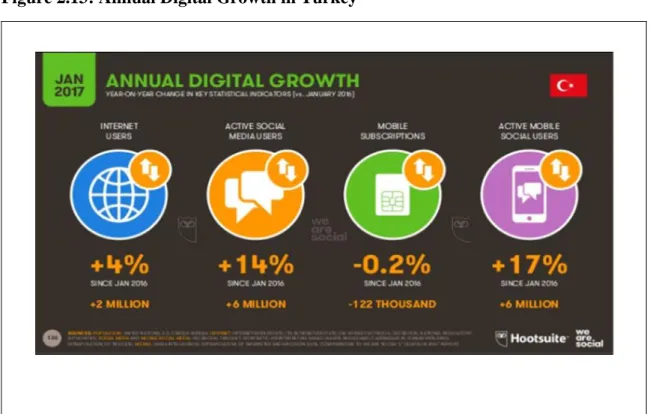
Figure 2.14: Annual Digital Growth in Turkey ... 40
Figure 2.15: Device Usage in Turkey ... 40
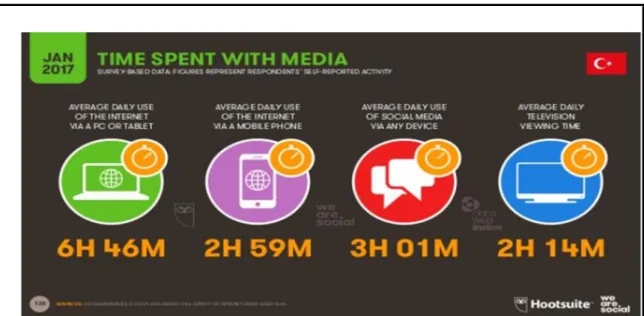
Figure 2.16: Time Spent with Media ... 41
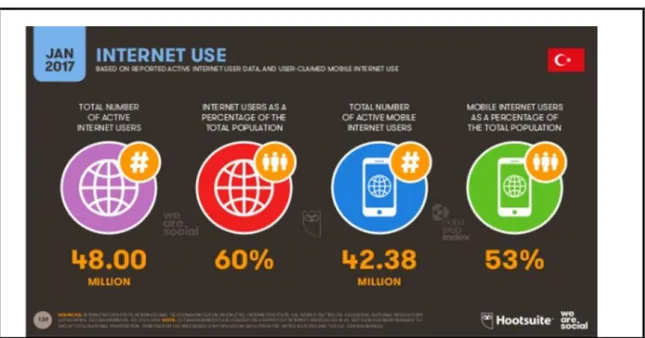
Figure 2.17: Internet Use in Turkey ... 42
Figure 2.18: Share of Web Traffic by Device ... 42
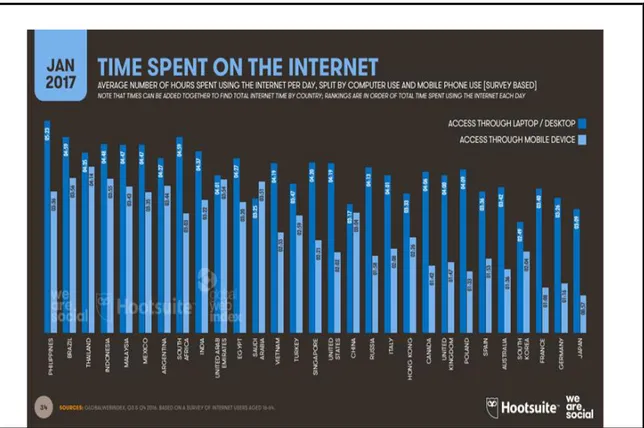
Figure 2.19: Countries' Internet Usage Times ... 43
Figure 2.20: Weekly Online Activities by Device ... 44
Figure 4.1. Seasonal Change in SIM card activations of (A) Mobile Phone Model... 69
Figure 4.2: Actual and Forecasted Sales Volume of (A) Mobile Phone Model -Simple Moving Average... 80
Figure 4.3: Actual and Forecasted Sales Volume of (A) Mobile Phone Model -Weighted Moving Average... 81
Figure 4.4: Actual and Forecasted Sales Volume of (A) Mobile Phone Model -Single Exponential Smoothing ... 82
Figure 4.5: Actual and Forecasted Sales Volume of (A) Mobile Phone Model -Trend Adjusted Exponential Smoothing ... 83
xii
Figure 4.6: Actual and Forecasted Sales Volume of (A) Mobile Phone Model-Trend and
Seasonal Effects ... 84
Figure 4.7: Actual and Forecasted Sales Volume of (A) Mobile Phone Model - Linear Trend ... 85
Figure 4.8: Simple Moving Average of (B) Mobile Phone Model ... 86
Figure 4.9: Weighted Moving Average (3 period) (B) Mobile Phone Model ... 87
Figure 4.10: Single Exponential Smoothing of (B) Mobile Phone Model ... 88
Figure 4.11: Trend Adjusted Exponential Smoothing of (B) Mobile Phone Model ... 89
Figure 4.12: Trend and Seasonal Effects of (B) Mobile Phone Model ... 90
xiii
ABBREVIATIONS
CB : Competative Brand.
MAD : Mean Absolute Deviation
MAE : Mean Absolute Error
NBR : Negative Binomial Regression
p.m. : Previous Month
p.w. : Previous Week
RAE : Relative Absolute Error
RMSE : Root Mean Squared Error
S. P. : Sales Price
S.V. : Sales Volume
SCM : Supply Chain Management
TDK : Türk Dil Kurumu
TL : Turkish Lira (TRY)
1. INTRODUCTION
The ever-changing developments in information and communication technologies in the globalizing world, increasing product diversity in the sectors and the constant exacerbation of competition are leading to various quests for businesses to provide sustainable competitive advantage. At the beginning of this kind of search is the management of all production, marketing and procurement processes with high performance from the strategic perspective.
Indeed, today's businesses are experiencing rapid changes and transformations both inside and outside. In order to survive in the new economic regime and be competitive, it is necessary to make strategic decisions under "supply chain management" (SCM) and "inventory management". Taking these decisions successfully by predicting the future will give them considerable gains.
The “demand forecast” success especially in terms of businesses operating in the mobile phone sector examined in this thesis, is highly critical in production, marketing and SCM processes generally, and especially in the context of inventory and order management. The most important reason for this is the constant growth of the mobile phone industry worldwide and the rapid increase in demand. As a matter of fact, it is seen that the number of smartphone usage which makes it easy to enter the internet and to make it mobile in the world has increased incredibly.
As a matter of fact, by the year 2017, when the world population is calculated as 7 billion 476 million, approximately 4 billion 917 million (66 percent of the world population) mobile phone users are in the World (DGO, 2017:3-4). By 2017, the number of laptop and PC usage as a means of connecting internets worldwide has increased by 45 percent compared to 2016, while the use of mobile phones for the same purpose has increased by 50 percent (DGO, 2017:6). Moreover, the increase in the number of mobile phones connecting to the internet in the previous year increased by 30 percent around the world, while the increase in the number of connections via PC and laptop decreased by 20 percent compared to the previous year (DGO, 2017:9).
In Turkey, as of 2017, 48 million people constituting 60 percent of the country's population are internet users and the number of people connecting to Internet via mobile
2
phones is 71 million. In addition, in the period between 2016 and 2017, connecting Internet by computers in Turkey decreased by 29 percent to 36 percent, while mobile web traffic increased by 33 percent to 61 percent (DGO, 2017:3-4).
This kind of statistics and data show that today mobile phone sector is an extremely dynamic and innovative sector that both in the world and in Turkey, where demand is changing every day according to the new models and competition is fierce. That's why all businesses that want to survive in the industry have to make "demand forecasts" within inventory, sales and order management very precisely. For this and similar reasons, defining "supply chain management", "inventory management" and "demand forecasting" concept, which are discussed in this thesis, will be the first priority.
From a literary perspective, it appears that the SCM concept is defined as the process of "integrating retailers, wholesalers, manufacturers and suppliers to produce and distribute products in the right quantity, in the right place and on time to meet customer service level requirements" (Mangan et al., 2008:12-13; Ungan, 2011:13; Nebol et al., 2014:11).
SCM in general consists of various processes and subsystems, although it shows changes according to sectors and businesses. These include managerial processes for demand forecasting, raw material supply, storage, transportation, ordering, sales, and similar operations for production, sales or marketing (Stevenson, 2012:76-77). Among these, it is stated in the literature that subsystems with the most strategic designation and value under SCM are "demand management" and "inventory management" (Kobu, 2005; Beamon, 1998; Lambert and Cooper, 2000; Bowersox et al., 2002; Croxton et al.2002; Feng et al. 2008; Tilford, 2009; Rexhausen et al., 2012; Stevenson, 2012; Krajewski et al. 2013).
In the literature, the concept of "inventory" is most simply defined as "a stock or warehouse where various goods are stored" (Kamauff, 2009: 187). Most of the goods contained in an operator's inventory consist of goods or business-related goods in which the operator is located (Stevenson, 2012:556). It is possible to define the concept of inventory management as "effective management of stocking level in enterprises, management of storage activities such as how to maintain stocks, when stocks should be
3
renewed and to determine order / production quantities" (Monks, 1996; Kobu, 2006; Nahmias, 2009; Yüksel, 2010).
In terms of businesses, the general objective of inventory management is to ensure that the required amount of goods or part is available at the desired time and place at the desired amount (Bowersox, 2002; Kobu, 2006; Schuh, 2006; Kumar and Suresh, 2008; Nahmias, 2009; Yüksel, 2010; Yenersoy, 2011). For a successful inventory management, having the right material in the right place at the right time and at the right cost Shows the success of inventory management (Kumar and Suresh, 2008; Nahmias, 2009; Stevenson, 2012). Thus, the success of "demand forecasting" under the SCM has a lot of precautionary measures in terms of the reduction of all costs in the business, the increase of production and marketing performance (Ülgen and Mirze, 2007; Nahmias, 2009; Yüksel, 2010; Yenersoy, 2011).
In the literature, the concept of "forecasting" is defined as "trying to predict the future in order to plan the decisions to be made and the operations to be carried out for business management" (Tek, 1999:296; Tilford, 2009:16). The concept of demand management is defined as "the ability of businesses to understand customer demand and balance this demand with supply chain capacity" (Lambert and Cooper, 2000:18).
As the definition implies, demand management is concerned with the ability of businesses to estimate accurately customer desires and needs (Lapide, 2008:14). A well-implemented demand management has considerable strategic importance and value in terms of ensuring customer satisfaction, increasing sales and ensuring the effectiveness of inventory management (Leenders et al., 2002; Rexhausen et al., 2012; Stevenson, 2012; Krajewski et al., 2013).
When the literature is examined, there are many studies pointing out that making forecasts with high accuracy in terms of business production processes, SCM process and stages, as well as strategic considerations will provide considerable gains to the enterprises (Fitzgerald et al., 1991; Stewart, 1995; Stewart, 1995; Beamon (1999), Bagchi (1996) Bowersox et al., 2002; Kehoe and Boughton (2001; Gunasekar et al. (2001); Gunasekaran et al. (2004); Lockamy et al., (1999), Stewart, 1995, Beamon and McCormack, 2004, Gunasekaran and Kobu, 2007, Deshpande, (2012; Rexhausen et al., 2012).
4
Many similar researches in the literature emphasize that successful "demand forecasting" in terms of inventory management will provide considerable and strategic benefits to businesses (Balkhi and Benkherouf, 2004; Teng and Chang, 2005; Teng et al., 2005; Sana, 2008; Sarkar et al., 2011; Bose, 2002; Singh and Singh, 2011; Majumder and Bera, 2013; Dem et al., 2014).
However, in today's rapidly growing and developing "mobile phone industry" it is becoming increasingly difficult to make successful estimates in the context of increasing production, procurement, sales, marketing, ordering and customer satisfaction (Stevenson, 2012:76-77). This is because the development of demand estimates in terms of businesses operating in this sector consists of multi-stage processes and applications, including both precursors and formal calculations and statistical estimates. In addition, demand forecasting that businesses have been using for many years can often yield inaccurate and statistically meaningless results in such a dynamic sector. (Mangan et al., 2008; Nebol et al., 2014; Stevenson, 2012).
Indeed, the mobile phone sector is a "high-tech-based production" sector (Decker, Gnibba and Yukawa, 2010). Another feature of the sector is that mobile phones manufactured and sold in this sector are included in the "Short sales season and products with a short lifespan" group (Graefe and Armstrong, 2011). In addition, it is often difficult to predict potential sales in the sector, because of the high uncertainty of demand for these products (Goodwin et al., 2012; Berbain, Bourbonnais, Vallin, 2011). Because of these reasons in mobile phone sector, traditional demand forecasting methods such as "time series analysis" are often inadequate and ineffective (Semco et al., 2013, Boese, 2015, Chen, Tzu and Liang, 2017).
In recent years, enterprises have faced such dilemmas in demand forecasting, and have been increasingly turning to the use of "machine learning" methods in "artificial intelligence" product technologies to solve problems that require "forecasting" and "estimate" (Dunham, 2003; Bahrololum, Salahi and Khalegni, 2009 Farid and Rahman, 2010; Jemili, Zaghdoud and Ahmed, 2007; Zhang and Zhu, 2010 Bace and Mell, 2011; Vural and Sağıroğlu, 2011; Zhang et al., 2012; Mu, Chen ve Zhang, 2012; Alazab, Hobbs, Abawajy and Alazab, 2012; Sharma ve Nema, 2013; Amos, Turner and White (2013); Faragher and Harle (2013; Wu and Hung (2014); Guinness (2015); Sağbaş and Ballı (2015).
5
"Machine Learning" in the literature; is a technique of creating computer software to produce better results using past experiences or sample data (Alpaydın, 2011:13 ). As can be understood from the description, machine learning allows to detect the hidden complex pattern between databases and to make new predictions and estimates by taking advantage of statistics and computational power for meaningful pattern extraction (Xiang, Yong and Meng, 2008: 918-924, Vural and Sagiroglu, 2011; Zhang et al., 2012; ICT, 2017).
It is not possible, however, to have a computer program, or algorithm, to forecast and predict where, how, and how much of a new product (such as a new mobile phone) will be sold on the market (Scarfone and Mell, 2007:80-94; Bace and Mell, 2011:4-5). It is stated in the literature that "machine learning method" which analyzes such problems according to "relationship rule" will have very effective results in solving similar problems. (Fader and Hardie, 2005; Liu, Yi and Yang, 2007; Alpaydın, 2011; Xiang, Yong and Meng, 2008; ICT, 2017).
Therefore, in order to solve a problem whose algorithm is not known in the above-mentioned manner, the "machine learning" method for making an inference according to the “relationship rule" by looking at the collected data is a very effective way of achieving accurate predictions. (Kendall, 1999; Çalış, Gazdağı and Yıldız, 2013). (Liu, Yi and Yang, 2007: 1561-1568).
However, as a result of the literature review, it has not been found (by the knowledge of the researcher) among the researches on SCM and demand forecasts under inventory management that the researcher using the "machine learning" method was used. For this reason, it is considered that this research which aims to make demand forecasting in SCM and inventory management in the "mobile phone sector", including a model newly introduced to the market, will make a significant contribution to the literature.
The main purpose of the study is to determine the effective demand forecasting methodology to provide full-time optimization of the mobile phone industry inventory management processes. To increase the accuracy of estimates made by qualitative estimation methods (expert opinion) and quantitative estimation methods (delphi method) which are frequently used in the mobile phone sector of the researcher; (delta) between "forecasting demand" and "actual sales" in such traditional methods in the
6
sector, and, more importantly, proposing a more effective demand forecasting method for the mobile phone sector.
Within the scope of this research, which primarily aims and goals are introduced, firstly the literature has been examined and qualitative data about the basic concepts of thesis have been collected at the theoretical level and the methods used in the researches about "demand forecasting" under SCM and inventory management have been examined. Finally, in the second part of the thesis, in the context of the research, there has been a review in the literature about whether "multi-regression analysis" and "machine learning methods" used in demand forecasting should be used in this study.
In the third part of the thesis, the purpose, scope, model, hypotheses of the research, population and sample and methods used in gathering and analyzing research data were tried to be explained. In the chapter, explanations are given in the context of descriptive tables about the machine learning method used in the research and also in the literature.
In the fourth part of the thesis, the findings of the demand forecasts made by SPSS and WEKA programs were interpreted in the context of descriptive tables. In this context, correlations and multiple regression findings in this section were evaluated together with machine learning findings, and finally the findings were discussed in the literature.
In the fifth and last section of the thesis, quantitative findings reached within the scope of the research were interpreted in the light of the qualitative information reached in the theoretical sections and some results were tried to be reached. Finally, some suggestions have been made to the researchers who are planning to work in the same subject and in the same way with this thesis and with the enterprises in the mobile telephone sector.
7
2. LITERATURE REVIEW
Findings of the literature on the basic concepts of this research, which aim to determine the effective demand forecasting method to provide full-time optimization in the inventory management processes of the mobile phone industry, are briefly summarized under the following headings.
2.1 THEORETICAL FRAMEWORK
This research is primarily concerned with the concepts of supply chain management, inventory management, and demand forecasting, and the underlying research concepts are described based on the literature.
2.1.1 Supply Chain Management in Enterprises (SCM)
The ever-changing developments in information and communication technologies in the globalizing world, increasing product diversity in the sectors and continuously increasing global competition conditions drive businesses to various quests to provide a sustainable competitive advantage (Tengilimoğlu and Yiğit, 2013).
Supply Chain Management (SCM) has become an increasingly strategic and managerial space for all businesses to achieve a high-quality output, increase customer satisfaction and increase the organizational efficiency of the business to gain a competitive advantage globally (Rexhausen et al. 2012).
In the literature, the concept of "supply chain" is defined as "processes in which raw materials are procured by enterprises to use in production, raw materials are converted into semi-finished or final products, and these products are delivered to the end user" (Mangan et al., 2008:12-13). In the supply chain, there is information/product, and fund flows between various subsystems throughout the chain. Customers, retailers, wholesalers/distributors, manufacturers and input suppliers in such schemes come together to meet customer needs directly or indirectly (Uzun and Karataş, 2012; Acar and Köseoğlu, 2014).
SCM is defined as the process of integrating retailers, wholesalers, manufacturers, and suppliers to produce and distribute products in the right quantity, in the right place and
8
on time to meet customer service level requirements (Ungan, 2011:13; Nebol et al., 2014:11).
From a literary perspective, it is possible to come up with many definitions similar to the SCM description mentioned above: For example, Quinn (1997: 5) defines the concept of SCM as "all processes related to products from the raw material stage to the end user.".According to Kopczak (1997: 9) it is "a set of elements covering suppliers, producers, distributors, retailers and providing the flow of materials, products, and information between them." Shin et al. (2000: 18) define "the art of managing raw materials, goods and products forwards, cash backward, knowledge for both directions" (Lambert and Cooper, 2000: 14).
The last point reached in the processes and practices of SCM, which has undergone various development processes, is the development of different types of SCM models according to "product" and "customer." (Vonderembse et al., 2006). Undoubtedly, at the forefront of such new models and applications are the information and communication sectors, which are composed of high-tech production systems such as the mobile communication sector. (Mangan et al., 2008; Nebol et al., 2014). To ensure the sustainable competitive advantage of the enterprises operating in such sectors, effective management of the processes and practices of SCM is significant and vital. (Stewart, 1995; Rexhausen et al., 2012).
On the other hand, although it shows some changes according to the sectors, in general, in today's enterprises, the stages of SCM consists of sub-systems and administrative processes listed (1) demand management; (2) distribution management; (3) supplier relationship management; (4) customer relationship management; (5) purchase; (6) new product development; (7) inventory management; (8) process management; (9) capacity planning; (10) site selection. (Bowersox et al., 2002).
The most important processes and subsystems within the scope of SCM are "demand management" and "inventory management" processes and applications. (Lambert and Cooper, 2000; Croxton et al.2002; Feng et al. 2008; Tilford, 2009; Rexhausen et al. 2012). For example, according to Beamon (1998), the two processes will be operated and managed in a harmonious manner, which will provide the maximum benefit expected from all the processes and processes. (Krajewski et al. 2013).
9
Finally, it should be said that in sectors where competition is intensified globally, in terms of an economic regime in which new developments and changes are taking place every day, every hour and minute, in both internal and external environment of enterprises, effective inventory management practices under the scope of SCM has quite a significant importance (Stevenson, 2012:76-77).
Also, with demand forecasting managed under SCM, being successful in the inventory management processes contributes to increasing the production and sales performance of the enterprises, to increase the product quality and to obtain the sustainable competitive advantage of the enterprises. (Leenders et al. 2002; Lockamy and McCormack, 2004; Gunasekaran and Kobu, 2007).
Because of these kinds of contributions and gains mentioned in the literature, demand estimation and inventory management are covered under the scope of this research. A model for accurate and successful demand forecasting for businesses to be successful in SCM, managing inventory and order have been tried to be developed.
2.1.2 Inventory (Stock) Management Processes in Businesses
The most important and most fundamental of the SCM practices that are carried out regarding strategic management in the enterprises is undoubtedly the "inventory management" processes and applications (Koçel, 2015: 270). "Inventory management" based on logistics management and accounting management is at the forefront of the basic concepts discussed in this thesis.
The word "inventory," which is transliterated into Turkish as a counterpart to the words "stock" and "inventory" in English, is used in this same meaning (TDK, 2017). In fact, the term "stock" is used to describe the physical and monetary elements of the SCM and the production process, while the term "inventory" is used to express the inventory of goods that are physically counted at the end of the year in accounting (Kobu, 2005: 341).
A stock or a warehouse where the inventory goods are stored, as the word implies. For that reason, most of the items on an enterprises’ inventory are comprised of sectors, products, or business-related commodities that the enterprise is in (Kamauff, 2009: 187).For example, manufacturing firms stock raw materials, purchased parts, partially
10
finished products and spare parts for finished products and machines; a healthcare facility holds medical supplies, spare parts of medical devices and other logistics procurement supplies in stock. What will be the problem and the primary success criterion here is the art of responding correctly to these questions; keeping what, how long, how much and in which depot will be more ergonomic and profitable? (Stevenson, 2012:556).
In this sense, it is possible to define the concept of inventory management in terms of adequate follow-up of inventory levels in enterprises, management of storage activities, determination of when stock should be renewed, and management of applications such as determination of order / production quantities (Monks, 1996; Kobu, 2006; Nahmias, 2009; Yüksel, 2010).
It is understood from the definition that the general aim of inventory management and systems is to ensure that the required parts are available at the desired time and place at the desired quantity (Bowersox, 2002). Inventory control systems that will serve this purpose vary depending on factors such as the structure of business/organization, product structure, management approaches. (Kobu, 2006; Schuh, 2006; Kumar and Suresh, 2008; Nahmias, 2009; Yüksel, 2010; Yenersoy, 2011):
Generally, regarding businesses, the types of inventories are considered as raw materials, semi-finished goods, auxiliary material stocks and final products (Aghezzaf, 2006). They also prefer to have safety stocks so that they are not adversely affected by uncertainties in the system, such as demand, duration of supply and operating supply (Kumar and Suresh, 2008; Nahmias, 2009; Yüksel, 2010; Yenersoy, 2011).
The general inventory costs for a business are a long list: Order / production preparation cost (per cycle); Purchase / production (variable) cost (per unit);Cost of availability (per unit); Storage cost; Cost of capital; Insurance and tax costs; Deterioration, aging and waste costs; System costs; non-possession cost (per unit) (Tersine, 1994; Eroğlu, 2002; Nahmias, 2009; Yenersoy, 2011; Stevenson, 2012).
On the other hand, for a successful inventory management, it is necessary to keep the right material in the right place at the right time and the right cost (Stevenson, 2012). Since the success of the demand forecasting will affect the decrease or increase of all the costs mentioned above, it is significant and essential to predict highly accurate
11
regarding SCM and the success of the inventory management for the performance of the enterprise (Kumar and Suresh, 2008; Nahmias, 2009).
Inventory management in all sectors and businesses is seen as the most basic and most important SCM operation management process. Because the success of inventory management affects all production operations, marketing, and even financing processes (Ülgen and Mirze, 2007: 290). The businesses also must improve strategies that will reduce storage costs to the most considerable extent by balancing businesses with satisfactory production efficiency and customer demand. (Collier, 2009: 186).
Finally, it should be said that to correctly configure the inventory management functions in the system, the processes related directly with each other such as ordering, purchasing, warehousing, distribution and inventory control within these functions should be performed with the most accurate estimations (Aytekin, 2009: 113). Therefore, the "accurate demand forecast" in inventory management under the scope of SCM in the enterprises has strategic meaning and prevention. (Aghezzaf, 2006; Rexhausen et al. 2012).
2.1.3 Order Policies in Inventory Management
The main aim of inventory management is providing customer services at a satisfactory level while keeping the stock prices within reasonable limits (Kumar ve Suresh, 2008). There are two primary considerations of inventory management about this aim. The first one is the level of customer services, in other words having the right amount of goods at the right place, at the right time. The other one is ordering and transportation costs (Lockamy and McCormack, 2004; Gunasekaran and Kobu, 2007).
The enterprises keep various inventory ordering policies to overcome these two main considerations. These kinds of policies provide background for inventory managers to give their decisions about two main issues; “when the orders should be given” and “what amount of orders should be given” (Nahmias, 2009; Yenersoy, 2011).
“The optimum ordering amount” which gains importance in this sense reflects the balance between transportation costs and ordering costs. Depending on the change in orders, one of the costs increases while the other one decreases. For example, if the amount of order is relatively small, the average inventory becomes low, and the
12
transportation costs become low, too. Whereas, the small amount of order will require frequent orders and then it will increase the annual ordering costs. Inversely, giving orders in higher amounts but lower frequency may decrease annual ordering costs which in turn yields the average stock levels would be higher and then causes an increase in transportation costs. Consequently, the ideal solution is not a big amount of order or a small amount of order but a balance between these two (Stevenson, 2012:558-562).
Three main ordering models are widely used currently and identified as “basic economic ordering quantity model,” “Quantity decrease model” and “economic production quantity model” (Stevenson, 2012:562-566). These models suggest continuous inventory tracking to know when the order is re-ordered.
For this, four key determinants are used to determine the amount of reorder points maintained under order models: 1. Demand rate (usually based on an estimate). 2. Term time. 3. The grade of the tally and the term time variability. 4. Acceptable end of stock risk for management is the risk level (Stevenson, 2012:574).
Finally, it should be said that to reduce the risk of becoming stuck at the term time (safe stock) for ordering within a forecasting model, it is necessary to carry additional stock, called safety stock. Because re-order point safety will vary according to the quantity (Stevenson, 2012:578).
2.1.4 Demand Management and Forecasting in Enterprises
All economic activities are based on the demand of the consumer. Without considering the demand level of the society to which it will be addressed, an enterprise in production will have to produce in inappropriate quantities (Nahmias, 2009; Yüksel, 2010; Yenersoy, 2011). In this new economic regime where competition is intensified, such problems are being tried to be solved by sufficient "demand management" applications.
In this context, businesses do not want to produce more than they can sell, nor do they want to produce under their selling capacity. Businesses that produce more than they can afford to sell have to cope with too much inventory cost and have to sell their remaining products at meager prices. Businesses that produce less than their suppliers
13
can miss out on more profit, and their brand values and corporate reputations are damaged.
In the literature, the concept of "forecasting" is defined as "trying to predict the future to plan the decisions to be made and the operations to be carried out for business management." Demand forecasting is the function of estimating the number of goods and services that consumers will demand in the future (Tilford, 2009:16). In another source, demand forecasting is defined as "estimating sales of a given product within a certain future time" (Tek, 1999:296).
The concept of demand management in the literature is defined as "the ability of businesses to understand customer demand and balance this demand with supply chain capacity" (Lambert and Cooper, 2000:18). As the definition implies, demand management is concerned with the ability of businesses to accurately estimate customer needs and needs (Lapide, 2008:14).
Demand forecasts are the most critical inputs that must be reached in many business decisions.As a matter of fact, according to Croxton et al. (2002), demand management is the most crucial element of supply chain management. According to Raxhausen et al. (2012), well-implemented demand management has considerable strategic importance and value regarding ensuring customer satisfaction, increasing sales and ensuring the effectiveness of inventory management.
So, according to the literature, it can be said that the amount of production in terms of the enterprises is a fundamental balance issue, and the only way to achieve this balance is to make a "demand forecast" in a correct and full time within the scope of successful "demand management" (Krajewski vd., 2013).
The development of demand estimates is a multi-stage process with both premise and precise estimates (Kress and Snyder, 1994:6). This is the basis for determining the level of production of the enterprise. Demand estimates are often made by businesses for which the product will be produced, what the consumer will demand from that product, and where the likelihood of such a claim is likely to occur (Lapide, 2007).
However, management in the business requires different estimates of the future level of activity based on the interest and focal points of the various stages. Different estimates
14
such as market forecast, financial forecast, stock forecast, sales forecast, order forecast and production forecast are developed in this way (Schroeder, 1989:71).
The selection of demand forecasting techniques that businesses will use, especially in strategic decision making; it is very important to take into account such factors as the time and interval covered by the estimates, the long or short term of decisions to be made according to the results of the estimates, the accessibility to the data, the quality of the data obtained and the ease of understanding and application of the technique (Klassen and Flores, 2001:172).
In such cases, the available capacity can often meet most of the demand volume. Product features and demand model affects the type of forecast to be done, and the time it takes to cover. In particular, if demand trends are expected to be increasing in a long period compared to demand forecasts, it is necessary to make a forecast for a period that allows planning for the necessary expansion or equipment. This time interval varies from a few months to a few years (Rexhausen et al., 2012).
In this context, the demand forecasts to be made in the enterprises are grouped into "time periods" in four ways.The first is "Long-term forecasts" (maybe five or more years), the second is "Medium-term forecasts" (which may cover a period of up to five years starting from six months); "Short-term estimates" (three months, up to six months), and fourth "Very short-term estimates" (weekly, even daily) (Feng et al., 2008:16).
Finally, it should be said that the precise estimates are significant regarding supply chain and inventory management. Incorrect estimates can cause deficiencies and oversights throughout the supply chain (Leenders vd., 2002).
Excessively optimistic estimates may cause a material and capacity overruns that may increase costs. Both the shortcomings in the supply chain and the excesses have a negative impact not only on customer service but also on profits. Moreover, incorrect estimates may cause temporary increases and decreases in orders in the supply chain (Stevenson, 2012:76-77).
15
2.1.5 Methods Used in Demand Forecasting and Machine Learning Method
The wide variety of goods and services produced in the new economic era; the differentiation demands of consumer goods, intermediate goods, capital goods from one another; the limited availability of the available statistics and the wide variation in reliability ratings of these statistics make it impossible to use a single demand forecasting method.
As noted in the literature, businesses need information on existing situations and plans for the future to collect the ideas and judgments of normal persons. (Monks, 1987; 268; Render and Stair, 2000; 157). Moreover, while choosing the most appropriate method for estimating the demand to be made, it is said in the literature that two main factors to consider are "cost" and "accuracy." Other factors to consider when choosing an estimation technique include the existence of historical data; the time required to collect, analyze and forecast the data and the existence of the computer software (Fildes and Hastings, 1994:13).
Demand forecasting models that are shaped according to these variables are mainly classified into two groups. The first of these is qualitative, namely qualitative demand forecasting techniques, while the other groups are called quantitative, namely quantitative demand forecasting models. The first group of qualitative techniques can be used if the numerical data for the case to be estimated cannot be obtained, the uncertainty and the variability of the data are excessive (Stevenson, 2012:424).
For example, expert opinions, individual experience and judgments, and subjective factors can be addressed. The inputs of qualitative estimation techniques, which provide for the handling of such subjective factors, can be obtained from various sources. These sources of information can be customers, salespeople, managers, technical staff or experts from outside the business (Stevenson, 2012:425). The main qualitative techniques used in the decision-making process can be grouped into four groups: Delphi technique, market research, expert group opinion and sales force mix (Demir and Gümüşoğlu, 2003:497).
Quantitative demand forecasting techniques in the second group are divided into two subgroups as time series and causal techniques (regression analysis) (Sanders and Manrodt, 2003:513). In the time series analysis in the first group, the past data for the
16
variable to be estimated is analyzed to obtain a particular data trend. Time Series Analysis is based on the assumption of future predictions based on the observation of the past (Tütek and Gümüşoğlu, 2000:197).
On the other hand, in some recent researches, "Machine Learning" method is seen to be used in demand forecasts for different sectors. It will be appropriate to describe briefly the method of machine learning that is used in the demand forecasts made within the scope of this research.
"Machine Learning" in the literature; is a technique of creating computer software to produce better results using experiences or sample data (ICT, 2017). Machine learning is a system that studies the work and construction of algorithms that can be learned as a structural function and can be predicted through the data (Fader and Hardie, 2005).
In another source, "machine learning" is defined as writing descriptive or predictive inferences using descriptive data or using experience (Alpaydın, 2011:13).
It is clear from the definitions that machine learning takes advantage of the statistics and computers to determine the hidden complex patterns between databases and to extract meaningful patterns (Xiang, Yong, and Meng, 2008: 918-924). For example, search engines such as Google and Yandex on the internet offer alternative search criteria, and the introduction of a new search suggests an example for machine learning applications. Likewise, in countries where different languages are spoken, the automatic translation of such a search engine to a different language in a different language is an example of machine learning applications. (Vural and Sağıroğlu, 2011; Zhang et al., 2012; ICT, 2017).
However, it should be said immediately that the algorithm must be known so that any problem can be solved by the computer (Bace and Mell, 2011:4-5). The concept of the algorithm is defined as a sequence of commands that will be applied to translate "input to output" in the computer software language (Vural and Sağıroğlu, 2011: 89-103). It does not have the chance to use these types of software, which have effective results in many issues and problems. For example, it is not possible to have an algorithm written to estimate and predict where, how, and how much of a new product will be sold to the market (Scarfone and Mell, 2007:80-94).
17
Because there are hundreds of factors that can cause such a problem. Even if there was an algorithm for this problem, it would be possible to write a separate computer program for it and to get an exact result on it, which would often be impossible due to the lack of data constraints and past sales data (Bace and Mell, 2011:4-5). Here, the "relationship rule" in the statistics and philosophical science enters the circuit. To explain the rule with an example; If a customer buys product X and also buys product Y, then it is said that the customer who buys X is a candidate to buy Y (Cristianni et al., 2000).
It is stated in the literature that the "machine learning method" which is designed according to the association rule in the solution of these and similar problems will have very effective results (Fader and Hardie, 2005; Liu, Yi and Yang, 2007; Alpaydın, 2011; Xiang, Yong and Meng, 2008; ICT, 2017). Therefore, in order to solve a problem whose algorithm is unknown, the "machine learning" method is very useful in making an inference based on collected data. It is also possible to say that it is a very efficient method in terms of reaching specific predictions (Kendall, 1999; Çalış, Gazdağı and Yıldız, 2013).
Finally, it should be said that this method could be used in many different areas. Generally, however, this method produces solutions to problems by making deductions or estimates from existing examples and data. This allows the method to be used in demand forecasting and to achieve satisfactory results (Liu, Yi and Yang, 2007: 1561-1568).
As can be seen, demand forecasting methods and techniques, which play a crucial role in making strategic decisions in all management and production processes today, continue to be developed and widely used. Clearly, even in this respect, it is possible to say that this research, which aims to make demand forecasting using the "machine learning" method, will make an essential contribution to the literature.
2.2 LITERATURE REVIEW OF RESEARCH HYPOTHESES
In this part of the study, the relationships between dependent and independent variables in the hypotheses developed within the scope of the research were tried to be examined within the framework of previous research in the literature. In this context, in the literature review, firstly, the research about the application of demand forecasting in
18
terms of inventory management processes and applications maintained under SCM have been examined.
When the literature is examined, there are many studies indicating that it is very important to make predictions with high accuracy in demand forecasting in terms of production processes and SCM processes and stages (Fitzgerald et al., 1991; Stewart, 1995; Stewart, 1995; Beamon (1999), Bagchi (1996) Bowersox et al., 2002; Lockamy and McCormack, 2004; Gunasekaran and Kobu, 2007).
For example, Bowersox et al., (2002) pointed out that all of the applications and activities in the SCM process have great importance and significance in terms of the performance of the enterprises; especially “demand management” and “inventory management” applications have more strategic importance and value due to the fact that they affect production directly compared to all other SCM subsystems.
Kehoe and Boughton (2001) compared inventory management systems based on traditional and knowledge-based estimates with each other. In this context, the performance of the changing and transforming SCM systems with electronic markets entering the economic systems via the internet has been analyzed by the developed regression model. As a result of the research, it is revealed that the new computer-aided SCM systems are more successful than traditional SCM systems and that the most critical performance indicator that explains this success is "the success of demand forecasting."
Under the SCM, Gunasakaran conducted three types of research that looked at the success of demand forecasting and made essential contributions to the literature. Gunesekaran et al. (2001) and Gunesekaran (2004) research and Gunesekaran and Kobu (2007) research have reached some results which will shed light on the relation between these administrative areas.
Gunasekaran et al. (2001) argued that the supply chain performance of firms is directly related to demand forecasts based on decisions to be made at strategic, tactical and operational level. After 3 years of research by the same researchers, it has been determined that the biggest contribution to "SCM performance" measured by dividing into five classes is the "demand planning" and "delivery planning" variables (Gunasekaran et al., 2004).
19
Gunasekaran and Kobu (2007) found that demand forecasting models based on algorithms on calculations made by various computer programs and inventory management systems supported by modern technologies (e.g., machine learning methods based on artificial intelligence) are very effective on SCM performance in enterprises.
In addition, in the literature, it is seen that, in some research, the effect of demand forecasting is investigated in terms of the reduction of stock costs and duration of customer demands within strategic SCM applications (Deshpande, 2012; Rexhausen et al., 2012).
Deshpande (2012), for instance, has found that full-time deliveries based on actual demand and order forecast plans under the strategic SCM practices have a positive impact on reducing business inventory costs, reducing response time to satisfy customer requests, and increasing customer satisfaction.
Similarly, Rexhausen et al. (2012) investigated the effectiveness of demand management on SCM performance and argued that the right demand estimates in terms of all SCM processes were the most important factors enhancing performance.
In the second stage of the literature review aimed at developing research hypotheses, the research that investigated the roles and functions of demand forecasting in terms of enterprises' inventory management practices and processes were examined.In this context, it can be seen from the literature that the number of research focusing on demand forecasting within inventory management has increased considerably.
In this context, it is seen that the meaning and the importance of "forecasting of demand" are discussed in terms of inventory management in some research in the literature (Balkhi and Benkherouf, 2004, Teng and Chang, 2005, Teng et al., 2005, Sana, 2008;Sarkar et al., 2011).
With a general evaluation, these studies mostly refer to the "demand forecast success" of the enterprises on the basis of various "reasons for uncertainty” such as: "Situations of lack of stocks caused by the production environment" (Salameh and Jaber, 2000)."Claiming after-action event" (Bayındır et al., 2007). "Reducing defects in production, quality control and control errors" (Hayek and Salameh, 2001; Liao, 2007)
20
and "allowing delays in payments" (Pentico et al., 2009; Teng and Chang, 2009). "Commercial credit policies launched by businesses" (Darwish, 2008; Jaber et al., 2008; Mahata, 2012).
In the literature, it seems that some research emphasize the necessity of making demand forecasting under the name of "continuous surveillance" in the models known as "probable inventory models", which include cases where the demand uncertainty is represented by a probability distribution (Axsater, 1993; Chen, 1999; Hariga, 2010; Yang et al. 2011).
It is also emphasized that in the literature, the demand forecasts of the enterprises in terms of inventory management success have been changed depending on the demand forecast time and / or stock quantity (Bayındır et al., 2006; Ben-Daya et al., 2008; Ertogral, 2011).In some studies, it was emphasized that estimates made in terms of inventory management were generally "blurry" in other words, not clear (Bose, 2002; Singh and Singh, 2011; Majumder and Bera, 2013; Dem et al., 2014).
As a result of the literature review, it has been understood that "demand forecasting" has become very important in terms of increasing SCM and inventory management performance, due to technological developments in the globalized world, global competition increases in markets, and product and service suppliers presenting to a new product market every day.
2.3 LITERATURE REVIEW FOR THE RESEARCH METHOD
As emphasized in previous sections of the study; each enterprise must make some managerial decisions at strategic, tactical, and operational levels based on accurate estimates of the success of its day-to-day operations.If the estimates made are not correct, programs will be produced that will provide very little or too much resource, too little or too much output, false output or incorrect timing of output, all of which will lead to additional costs and dissatisfied customers (Stevenson, 2012:76-77).
Various demand forecasting methods are used in "demand forecasts," which are designed especially to be based on SCM and production management, as well as on decisions to be made in inventory and order management. Essentially these methods are basically divided into two groups as "qualitative" and "quantitative" methods.
21
Qualitative techniques allow the addition of soft information (e.g., human factors, personal opinions, preliminary tests) to the forecasting process (Stevenson, 2012:80). "Judgment prediction" is an example of qualitative techniques based on the analysis of subjective inputs from various sources such as consumer surveys, sales staff, executive and expert panels.
The quantitative techniques in the second group mainly consist of the analysis of objective or challenging data. It is emphasized in the literature that such methods provide more clear and favorable results in the demand forecasts to be made. For this reason, information and determinations about demand forecasting methods which are used most widely in the literature and which are also preferred in the scope of this research are briefly described below.
2.3.1 Use of Time Series in Demand Forecasting
When the literature is examined, it can be said that the oldest method used in demand forecasting is "Time series analysis" method (Stevenson, 2012:76-77). An analysis of time series that tries to reflect only past experiences into the future includes examining past values and determining whether they are trends. In cases where there is no significant deviation, time series analysis also includes forecasting (Stevenson, 2012:76-77).
When the literature is examined, it is seen that the most commonly used estimation techniques in the time series analysis are "Arithmetic Mean Method", "Moving Average Method", "Weighted Moving Average Method", "Exponential Correction Method" and "Least Squares Method" (Bhattacharya, 1997:5; Stevenson, 2012:76-77).
Much research has been done in the literature on demand forecasts using the above-mentioned methods within the time series models:For example, Kirby (1966) calculated demand estimates using 23 different time series of 7.5-year monthly sales data of different sewing machine product groups from five different countries.As a result of the research, forecasts were made according to the demand season and the month of the UK market.Zhou et al. (2002) used a time series analysis method to estimate the hourly and daily water demand for the urban area of the Melbourne water supply system.
22
exponential correction in the prediction of daily urgent health care and routine health care claims for four districts of South Carolina.Schultz (1987) used the "exponential correction method" in predicting the irregularity of product demand in a business operating in the healthcare sector.Sani and Kingsman (1997) estimated and compared the results of different qualitative spare parts requests with simple exponential correction and moving average methods in different inventory management.Gavcar et al., (1999) tried to determine the demand estimates of paper-cardboard types used in Turkey by means of multiple regression analysis and determine the correlation between the variables.
When attention is paid to the research summarized above, it is noticed that the sectors and businesses that are subject to such research have been predicting the products and services that have been selling in the market for many years. Moreover, it is observed that in all studies no new product market has been put on the market. It is essential to understand that the products for which demand forecasting is aimed at are both "extremely long-lasting" and "medium-tech products." More importantly, it appears that past semester data for variables used in studies using time series analysis can be easily reached. (Bhattacharya, 1997:5-7).
It is proper to say that it is not possible to use "time series" in a sector where the diversity of products is changing and enriched every day, necessitating intensive technology like mobile telephone sector (Bhattacharya, 1997:5; Stevenson, 2012:76-77). Furthermore, it is not possible to use the "time series analysis" method to calculate demand estimates for new products that have not yet been marketed(Kotler, Wong, Saunders and Armstrong, 2005; Stevenson, 2012).
Because time-based data such as sales, order, or ratings for past periods of a product newly introduced into the market will not be available yet. Even so, there will not be much meaning and prospect in terms of rapid technological development and the prediction of the demand patterns of future products of such time series in an intensified competitive environment. (Kotler, Wong, Saunders and Armstrong, 2005).
Using "time series analysis" in forecasting demand for sales, order, production, SCM and inventory management of businesses that market products featured with "short life