FRAUD DETECTION
IN MOBILE COMMUNICATION NETWORKS
USING DATA MINING
BÜLENT KUŞAKSIZOĞLU
FRAUD DETECTION
IN MOBILE COMMUNICATION NETWORKS
USING DATA MINING
A THESIS SUBMITTED TO THE GRADUATE SCHOOL
OF
THE UNIVERSITY of BAHCESEHIR BY
BÜLENT KUŞAKSIZOĞLU
IN PARTIAL FULFILMENT OF THE REQUIREMENTS FOR THE DEGREE OF MASTER OF SCIENCE
IN
THE DEPARTMENT OF COMPUTER ENGINEERING
Approval of the Graduate School of (Name of the Graduate School)
________________
(Title and Name)
Director
I certify that this thesis satisfies all the requirements as a thesis for the degree of Master of Science
___________________
(Title and Name)
Head of Department
This is to certify that we have read this thesis and that in our opinion it is fully adequate, in scope and quality, as a thesis for the degree of Master of Science.
_________________ _________________
(Title and Name) (Title and Name)
Co-Supervisor Supervisor
Examining Committee Members
... _____________________ ... _____________________ ... _____________________ ... _____________________ ... _____________________
ABSTRACT
FRAUD DETECTION
IN MOBILE COMMUNICATION NETWORKS USING DATA MINING
Kuşaksızoğlu, Bülent
M.S Department of Computer Engineering Supervisor: Asst. Prof. Dr. Adem Karahoca
September 2006, 67 pages
Fraud is a significant source of lost revenue to the telecom industry. Efficient fraud detection systems and analysis system can save telecom operators a lot of money. Automated fraud detection systems enable operators to respond to fraud by detection, service denial and prosecutions against fraud.
In this study, we examine the call detail records (CDR’s), demographic data and payment data of mobile subscribers in order to develop models of normal and fraudulent behavior via data mining techniques. First we have done some Exploratory Data Analysis (EDA) on the data set and discovered that some variables like Account length, Package type, Gender, Type, Total Charged Amount showed important tendency for fraudulent use and then we applied k-means cluster method to cluster the customer, based on their call behaviors. Standard variables with ranked attributes and variables obtained from factor analysis due to some correlated variables were used as two different set of variables.
Finally we performed the data mining techniques – Decision trees, Rule based methods, and Neural Networks- for both training and test sets and then discussed the collected results based on performance measures such as accuracy, sensitivity, specificity, precision and RMSE.
Key words: fraud, mobile communication, data mining, machine
ÖZET
VERİ MADENCİLİĞİ YARDIMIYLA MOBİL TELEKOMÜNİKASYON ŞEBEKELERİNDE
SAHTEKARLIK TESPİTİ
Kuşaksızoğlu, Bülent
Yüksek Lisans, Bilgisayar Mühendisliği Bölümü Tez Yöneticisi: Yrd. Doç. Dr. Adem Karahoca
Eylül 2006, 67 sayfa
Sahtekarlık/kötü niyetli kullanım telekom endüstrisinde kayıp gelir’in önemli bir kaynağıdır. Etkin sahtekarlık keşfetme sistemleri ve analiz sistemleri telekom operatörlerine çok para tasarruf ettirebilir. Otomatik sahtekarlık sistemleri, operatörlere sahtekarlık yapanları keşfetme, servislerini reddetme ve kovuşturma olanağı vermektedir.
Bu çalışmada, veri madenciliği yöntemleriyle normal kullanıcıları, sahtekearlık yapanlardan ayıran bir model geliştirmek için mobil abonelerin konuşma detay kayıtları(CDR’s), demografik verileri ve ödeme verileri incelenmiştir. Önce açıklayıcı veri analizi ile veri seti incelenmiş ve abonelik süresi, paket tipi, cinsiyet, abonelik tipi, toplam fatura tutarı gibi değişkenlerin kötü niyetli kullanımın tespitinde önemli oldukları ortaya çıkmıştır. Daha sona k-means algoritması ile konuşma alışkanlıklarına gore abone kümelemesi yapılmıştır. Önem sırasına gore sıralanmış değişken seti ile ilişkili/bağlantılı değişkenler nedeni ile factor analizi sonuçu elde edilen değişken seti olmak üzere iki farklı değişken seti kullanılmıştır.
Son olarakta eğitim ve test setleri üzerinde karar ağaçları, kural tabanlı methodlar, yapay sinir ağları gibi veri madenciliği teknikleri uygulanmış ve çıkan sonuçlar doğruluk, duyarlılık, özgüllük, hassaslık ve hata kareleri ortalamalarının karekökü(HKOK) gibi performans ölçümlerine gore tartışılmıştır.
Anahtar Kelimeler: Sahtekarlık, Mobil telekomünikasyon , Veri
ACKNOWLEDGMENTS
I would like to express my sincere gratitude to my supervisor Asst.
Prof. Dr. Adem Karahoca, for his valuable guidance and advice. He
has been very supportive and patient throughout the progress of my thesis.
TABLE OF CONTENTS
ABSTRACT ... IV TABLE OF CONTENTS ... VII LIST OF TABLES ... VIII LIST OF FIGURES ... IX LIST OF ABBREVIATIONS ...X
1 INTRODUCTION TO TELECOM FRAUD ... 1
1.1 MOTIVATION... 8
1.2 RELATED WORK... 9
1.3 ROADMAP... 11
2 REVIEW OF DATA MINING ... 12
2.1 INTRODUCTION... 12
2.2 DATA DESCRIPTION FOR DATA MINING... 16
2.2.1 Summaries and visualization... 16
2.2.2 Clustering ... 17
2.2.3 Link Analysis ... 17
2.3 PREDICTIVE DATA MINING... 18
2.4 DATA MINING MODELS AND ALGORITHMS... 20
2.4.1 Neural Networks... 20
2.4.2 Decision Trees ... 23
2.4.3 Multivariate Adaptive Regression Splines (MARS) ... 24
2.4.4 Rule Induction... 25
2.4.5 K-Nearest neighbor and memory-based reasoning (MBR) ... 26
2.4.6 Logistic Regression... 27
2.4.7 Discriminant analysis ... 27
2.4.8 Generalized Additive Models (GAM)... 28
2.4.9 Boosting ... 29
2.4.10 Genetic Algorithms ... 29
2.5 THE DATA MINING PROCESS... 30
3 METHODS... 33
3.1 DATA SETS... 33
3.2 EXPLORATORY DATA ANALYSIS... 34
3.2.1 Getting to know the Data Set... 34
3.2.2 Dealing with Correlated Variables ... 36
3.2.3 Exploring Variables ... 37
3.3 CLUSTER ANALYSIS... 42
3.4 FACTOR ANALYSIS... 46
4 RESULTS & DISCUSSIONS ... 51
4.1 USED METHODS... 51
4.2 PERFORMANCE MEASURE... 54
4.3 USING WEKA WITH STANDARD VARIABLES... 54
4.4 USING WEKA WITH VARIABLES OBTAINED FROM FACTOR ANALYSIS... 60
5 CONCLUSION AND FUTURE DIRECTION ... 64
REFERENCESS... 65
LIST OF TABLES
Table 3. 1 Subscriber information (call, demographic and, payment data)... 35
Table 3. 2 Pearson Correlation Table... 37
Table 3. 3 Mean () results for different clustering ... 44
Table 3. 4 the results of Cluster Analysis ... 45
Table 3. 5 KMO and Barlett’s Test ... 48
Table 3. 6 Total Variance explained ... 49
Table 3. 7 Renamed Factor Variables... 49
Table 3. 8 Rotated Compenent Matrix ... 50
Table 4. 1 Ranked Attributes ... 54
Table 4. 2 Misclassification Matrix for the Training Set ... 55
Table 4. 3 Misclassification Matrix for the Test Set... 55
Table 4. 4 Training Results for the methods used ... 56
Table 4. 5 Testing Results for the methods used ... 57
Table 4. 6 Misclassification Matrix for the Training Set ... 60
Table 4. 7 Misclassification Matrix for the Test Set... 60
Table 4. 8 Training results for methods used ... 61
LIST OF FIGURES
Figure 2. 1 A Neural Network with a hidden layer ... 22
Figure 2. 2 A Simple Classification tree ... 23
Figure 2. 3 Phases of the CRISP-DM reference model... 31
Figure 3. 1 Process of fraud detection with Data Mining... 33
Figure 3. 2 Subscriber account length ... 38
Figure 3. 3 Distribution of Region attribute with fraud overlay ... 38
Figure 3. 4 Distribution of PackID attribute with fraud overlay ... 39
Figure 3. 5 Distribution of Gender attribute with fraud overlay ... 39
Figure 3. 6 Distribution of Type attribute with fraud overlay... 39
Figure 3. 8 Web graph of Cluster vs. Fraud ... 41
Figure 3. 9 Silhouette plot for 5 clusters... 44
Figure 4. 1 Sequence graph of the methods for the Test Set for standard variables... 57
Figure 4. 2 ROC curve for Test Set with NBTree, Ridor and BayesNet... 58
Figure 4. 3 Weka knowledgeFlow for NBTree method for Test Set ... 59
Figure 4. 4 Results for NBTree for Test set... 59
Figure 4. 5 Sequence graph of the methods for the Test Set ... 62
Figure 4. 6 ROC curve for Test Set with MLP for Class A (Normal Subscriber) ... 63
LIST OF ABBREVIATIONS
GSM Global System for Mobile Communications IMSI International Mobile Subscriber Identity SIM Subscriber Identity Module
CDR Call Detail Record PBX Public Branch Exchange
1 INTRODUCTION TO TELECOM FRAUD
There are many different types of telecom fraud. It could be to steal a phone and make calls or a retailer that reports an incorrect number of subscriptions sold in order to get better commission. Probably every company in telecom business has their own definition of what telecom fraud is. In general fraud can be defined as: “Every
attempt to use the operator’s network with no intention of paying for it”
There are an important difference between bad debt and fraud. Bad debt concerns people with occasional difficulties in paying for their invoices. This happens only once or twice per person. If the subscriber really can’t pay, he or she will most probably be suspended and denied to open a new subscription in the future.
A fraudster, however never has the intention to pay. A fraudster is also more likely to repeat a committed crime. If a subscription is disconnected, the fraudster will probably find ways to obtain a new subscription and continue the fraudulent activities.
The difference between bad debt and fraud can be defined as :”Fraud and bad debt both have to do with network users not paying for the used services. Fraud always includes a lie, and there is no intention to pay involved. Bad debt simply is normal people without resources to pay for the used services.”
Telecom fraud emerged in the late 1980’s. In the beginning, the only fraud committed was subscription fraud. Subscription fraud is a concept involving different ways to obtain subscription under false identities. Later on, fraudster found out how easy to commit tumbling within analogue networks. Tumbling means to change the
subscription identification information between calls to facilitate calls using other people's subscription. Tumbling quickly became the most common form of telecom fraud. When the operators discovered this, they replied by setting up databases containing valid identity combinations.
This fraudster then started with cloning of analogue handsets. i.e. to copy the complete handset identity and enter it into another handset. Identities in analogue networks could be obtained by scanning the air with a simple scanning device. There have been cases where the subscription and handset identities could be read on the handset packages. A fraudster could simply walk into a store and get the information. In 1998 a new phase of cloning of subscriptions emerged: Cloning of subscription identities with GSM networks.
Today’s fraud situation differs some between analogue and digital networks. In analogue networks, the greatest problems still are cloning and tumbling. GSM networks have the encryption and authentications embedded into the system, and therefore haven’t experienced any severe problems with tumbling and cloning fraud. Cloning within GSM requires hard-to-get information and special equipment. However, there are currently strong indications on that this is changing. Cloning equipment is now offered from various sources, at constantly dropping prices, and the time required to clone a SIM card is said to get shorter and shorter.
Telecom operators are investing quite significant sums of money in technology and staff training in their efforts to prevent and detect and analyze fraud. Technology investments include authentication, encryption, fingerprinting, profiling systems,
fraud detection systems etc. These investments are costly, but are often required to stop losses as a result of increasing fraud.
In many markets, the actions taken to prevent tumbling and cloning have forced the fraudsters to go back to committing subscription fraud. This is hence another area where many operators are focusing on preventing and detecting fraud, both in analogue and digital networks.
The costs of fraud do not only include unpaid invoices. Fraud might also lead to a potential loss of new and existing customers, as well as bad publicity. Fraud case investigations involve a lot of manpower. Roaming fraud generates roaming and interconnect charges. If it is a common knowledge that an operator does not make any attempts to prevent fraud, customers will turn to another operator for subscriptions. The fraudsters will most probably go to other way.
No one can be certain about the future. One thing that we do know is that fraud will continue to increase if operators do not implement an anti-fraud strategy consisting of different technical solutions, fraud management polices, and procedural solutions. Another area that is interesting for the future is 3G. The 3G expansion involves a complex integration of different types of network entities and services, in combination with content billing as a complement to the existing usage billing. This opens up vulnerability for operators, but opportunities for the fraudsters, to be compared with same evolution the computer industry just experienced with massive virus threats when the internet was introduced. Neither users nor the industry were prepared for the new threats and concentrated more on features and functions than on security. This is very logical since features and functions are the driving forces
within most development. 3G opens up new ways of using the networks, making services and content more valuable than itself.
It is probably true that it is impossible to totally eliminate fraud. The fraudsters will always seek a way to beat the system and any fraud detection mechanism has to be cost effective.
There are many different fraud types. Here we explain the most important ones.
Subscription Fraud: This is by far the most common fraud encountered on the GSM
network. Subscription fraud can be performed in different ways. – By using own identity (with changing some of his personal information) and by using false, or other people’s identities- Subscription fraud can be further subdivided into two categories. The first is for personal usage by the fraudster, or someone he passes the phone on to. The second is for real profit; here the fraudster claims to be a small business to obtain a number of handsets for Direct Call Selling purposes. The fraudster, who has no intention of paying his bill, now sells on the airtime, probably for cash, to people wishing to make cheap long distance calls.
Cloning: The purpose of cloning is to facilitate calls where another person's
subscription is used. The benefit of cloning is that calls that are made from a cloned phone will be charged to the person having the original subscription. Cloning has mainly considered as related to analogue networks. However, cloning is now reality also within GSM. Cloning of GSM phones has been considered as a very complicated operation. Each subscriber is identified by the IMSI number. The IMSI is stored on the SIM card. The SIM card also holds a secret key that is required when
authenticating the subscriber in the network. To further enhance security, the authentication process involves encryption of the information.
Cloning of a GSM phone means that a copy of the SIM card is made. What makes this complicated is that the fraudster needs both the IMSI and the encryption key. There is no use of scanning the air for it since the encryption key is never transmitted. The required information may be obtained from the operator’s network (internal fraud) or from the SIM supplier (supplier fraud) but to read it from SIM card, the encryption algorithm has to be cracked. However, now it can be done by using off-the-shelf equipment. Cloning of SIM cards, as it is known to be performed today, requires the actual SIM card that should be copied. A smart card reader, connected to a computer, is used to read the information on it and than copied to an empty SIM card.
Premium Rate Fraud: This involves the abuse of the premium rate services and can
occur in different ways. For example, a person could set up a premium rate line with a national operator. The operator is obliged to pay the owner of the line a proportion of the revenue generated. The fraudster then uses a fraudulent mobile phone to dial this number for long period. He may also get other people to do the same. The fraudster then gets the revenue without paying for his own calls. A further way in which premium rate services can be abused is by setting up a fraudulent mobile to divert calls to a popular premium rate line. The caller then only pays normal rates whilst the fraudulent mobile picks up the tab at premium rate. Characteristics are again long back-to-back calls.
Roaming Fraud: Roaming means that operators let visiting subscribers use their
networks and their own subscribers use their partners’ networks. This makes it possible for subscribers to use their mobile phones also in foreign countries, or in areas not covered by their home operators' networks.
Roaming fraud is a considerable threat for an operator of two reasons.
- Roaming fraud is more interesting from a fraud point of view, since this is an area where the potential profit is higher
- The call data has to be provided from the roaming partners, and this causes a delay in the analysis process. Roaming fraud is therefore harder to detect for an operator lacking the proper equipment.
A solution to detect roaming fraud at an earlier stage would be if roaming partners (operators) exchange roaming CDR’s more often, and faster.
Another aspect that has to be considered is that roaming fraud causes actual loss of money for the operators. The roaming partners have to be paid for providing their networks, no matter if the customer pays in the end.
Prepaid Fraud: Many operators believe that prepaid subscriptions are the solution to
solve telecom fraud. This is not true. Well some fraud types do not exist within the prepaid area, but prepaid subscriptions open up doors for some new fraud types. A commonly used payment method for prepaid subscription is payment via vouchers. The voucher represents a value. This value is added to the prepaid account when a certain number is called, and the PIN code that follows with voucher is entered. The PIN code is hidden when voucher is purchased e.g. by a layer that can
be removed by scratching it off. The voucher systems is an example of what can be weakness with prepaid subscriptions. Identified instances include cheque fraud, credit card fraud, voucher theft, voucher ID duplication, faulty vouchers, network access fraud, network attack, long duration calls, handset theft, and roaming fraud.
Fixed Line Fraud : Fraud is a problem also in fixed line networks. There are
numerous examples of public phones that have been misused for making free calls, e.g. by using simple tone generators. Another concrete example of fraud in fixed line networks is misuse of company PBXs. Companies may e.g. provide toll free numbers that route calls long distance or international. These numbers, enter a PIN code, and then be routed to their final destination. This enables the staff to make these calls without being charged for more than a local call.
The toll free numbers and PIN codes can be obtained in numerous ways, e.g. via the companies’ staff or by hackers. Once this information is known it will spread quickly, at the same time as the misuse will be difficult to detect for the company. Without proper routines, they might not become aware of it until to receive the bill or when the PBX is congested with unauthorized traffic.
Dealer Fraud: Dealers often get commissions on the number of subscriptions they
have sold. It is important to have rules surrounding the payment of the commissions to avoid having dealer exploiting any weaknesses. Below is a list of some known commission fraud cases.
- Subscriptions were first sold fictitiously to get the commission. The handsets that were included in the subscriptions were sold again or exported.
- Dealers purchased stolen units, changed the IMEI number and connected the units to the network.
Dealers are also potential source for GSM cloning cases. They have not only physical access to SIM cards, but also have possession of them the amount of time that is required to copy them.
1.1 Motivation
Huge amounts of data are being collected and kept in the warehouses as a result of increased use of mobile communication services. Insight information and knowledge derived from the databases in order to give operators a competitive edge in terms of customer care and retention, marketing and fraud detection. Thus telecommunication fraud has become a high priority item on the agenda of most telecom operators. Fraud is a significant source of lost revenue to the telecom industry. Efficient fraud detection systems and analysis systems can save telecom operators a lot of money. Automated fraud detection systems enable operators to respond to fraud by detection, service denial and prosecutions against fraudulent users.
In general, the more advanced a service, the more it is vulnerable to fraud. In the future, operators will need to adopt rapidly to keep pace with new challenges posed by fraudulent users.
1.2 Related Work
In this section, we review published work with relevance to fraud detection in telecommunication networks. Phua, Lee, Smith, and Gayler(2005) made a comprehensive survey of data mining techniques applied to fraud detection. The biggest revenue leakage area in the telecom industry is fraud (Wieland, 2004). Global telecommunications fraud losses are estimated in the tens of billions of dollars every year (FML, 2003). Some authors have emphasized the importance of distinguishing between fraud prevention and fraud detection (Bolton & Hand 2002). Fraud prevention describes measures to avoid fraud to occur in the first place. In contrast, fraud detection involves identifying fraud as quickly as possible once it has been committed. Bolton & Hand(2002) reviewed the statistical and machine learning technologies for fraud detection including their application to detect activities in money laundering, e-commerce, credit card fraud, telecommunication fraud and computer intrusion.
Cahill-Lambert-Pinheiro-Sun, (2000) The basis of the approach to detection is an account summary which is called an account signature, that is designed to track legitimate calling behavior for an account. An account signature might describe which call durations, times between calls, days of week and times of day, terminating numbers and payment methods are likely for the account and which are unlikely for the account. Signatures evolve with each new call that is not considered fraudulent, so each established customer eventually has its own signature. Likewise fraud signatures are defined for each kind of fraud using the same structure as an account signature. A call is scored by comparing its probability to belong to the account signature and fraud signature. For new accounts the first calls are used to assign
signature components associating them with calling patterns of a given segment of customers with similar initial information. The history of telecommunication crime, including several types of fraudulent activities, was reviewed by (Collins 1999a,b-2000).
Shawe-Taylor(1999) distinguished six different fraud scenarios; subscription fraud, the manipulation of PBX , frees phone fraud, handset theft, roaming fraud, premium rate service fraud. Subscription fraud which is defined as the use of telephone services with no intention of paying is most significant and prevalent telecom fraud. Subscription fraud is difficult to distinguish from bad debt, particularly if the fraud is personal usage.
Burge-Shawe-Taylor(1997)and Fawcett-Provost (1997) presented adaptive fraud detection. Fraudster adapt to new prevention and detection measures, so fraud detection needs to be adaptive and evolve over time. However, legitimate account users may gradually change their behavior over a longer period of time, and it is important to avoid spurious alarms. Models can be updated at fixed time points or continuously over time.
Moreau-Vandewalle (1997), designing a multilingual information system, the most important success factors of a multilingual information system should be examined that are the degree of authoring automation and cultural customization it offers and cross-lingual processing capability.
ACTS AC095 (1996-1997), The detection of fraud in mobile telecommunications was investigated in European project Advanced Security for Personal Communications Technologies (ASPeCT). The ASPeCT fraud detection tool is
based on investigating sequences of call detail records which contain the details of each mobile phone call attempt for billing purposes. The information produced for billing also contains usage behavior information valuable for fraud detection. A differential analysis is performed to identify a fraudster through profiling the behavior of a user. The analysis of user profiles are based on comparison of recent and longer term histories derived form the toll ticket data. ASPeCT fraud detection tool utilizes a rule based system for identifying certain frauds and neural networks to deal with novel or abnormal instances. Fawcett-Provost (1997) developed a method for choosing account specific thresholds rather than universal thresholds. Their procedure takes daily traffic summaries for a set of accounts that experienced at least 30 days of fraud free traffic activity followed by a period of fraud. This method was applied to cellular cloning, in which fraudulent usage is superimposed upon legitimate usage of an account. For each account a set of rules that distinguish fraud from non-fraud was developed. The superset of the rules for all accounts was then pruned by keeping only those that cover many accounts with possibly different thresholds for different accounts.
1.3 Roadmap
This study examines the Fraud Detection via use of Data Mining Techniques. First we take a look at the various Data Mining Techniques, then we use the Exploratory Data Analysis (EDA) in order to get to know the data set, then apply k-means cluster method to segment the customer based on their call behaviors. Two different set of variables were used. 1) Standard Variables, 2) Variables obtained from Factor Analysis due to some correlated variables. Finally, we perform the data mining methods for both training and test sets, and then we discuss the collected results.
2 REVIEW OF DATA MINING
2.1 Introduction
Data mining is predicted to be "one of the most revolutionary developments of the next decade" according to the online technology magazine ZDNET News (February 8, 2001). In fact, the MIT Technology Review chose data mining as one of ten emerging technologies that will change the world. According to the Gartner Group, "Data mining is the process of discovering meaningful new correlations, patterns and trends by sifting through large amounts of data stored in repositories, using pattern recognition technologies as well as statistical and mathematical techniques."
Databases today can range in size into the terabytes. Within these masses of data lies hidden information of strategic importance. But when there are so many trees, how do you draw meaningful conclusions about the forest.
The newest answer is data mining, which is being used both to increase revenues and to reduce costs. The potential returns are enormous. Innovative organizations worldwide are already using data mining to locate and appeal to higher value customers, to reconfigure their product offering to increase sales, and to minimize losses due to errors or fraud.
Data mining is a process that users a variety of data analysis tools to discover patterns and relationships in data that may be used to make valid prediction.
The first and simplest analytical step in data mining is to describe the data – summarize its statistical attributes (such as means and standard deviations), visually review it using charts and graphs, and look for potentially meaningful links among variables(such as values that often occur together) .
But the data description alone cannot provide an action plan. You must build a
predictive model based on patterns determined from results, and then test that model
on results outside the original sample.
The final step is to empirically verify the model. For example, from a database of customers who have already responded to a particular offer, you’ve built a model predicting which prospects are likeliest to respond to the same offer.
Data mining takes advantages in the fields of artificial intelligence(AI) and statistics. Both disciplines have been working on problems of pattern recognition and classification. Both communities have made great contributions to the understanding and application of neural nets and decision trees.
Data mining does not replace traditional statistical techniques. Rather, it is an extension of statistical methods that is in part the result of a major change in the statistics community. The development of most statistical techniques was, until recently on elegant theory and analytical methods that worked quite well on the modest amounts of data being analyzed. The increased power of computers and their lower cost, coupled with the need to analyze enormous data sets with millions of rows have allowed the development of new techniques based on a brute force exploration of possible solutions.
New techniques include relatively recent algorithms like neural nets and decision trees, and new approaches to older algorithms such as discriminant analysis. By virtue of bringing to bear the increased computer power on the huge volumes of available data, these techniques can approximate almost any functional form or
interaction on their own. Traditional statistical techniques rely on the modeler to specify the functional form and interactions.
The key point is that data mining is the application of these and other and statistical techniques to common business problems in a fashion that makes these techniques available to the skilled knowledge worker as well as the trained statistics professional. Data mining is a tool for increasing the productivity of people trying to build predictive models.
Data mining is increasingly popular because of the substantial contribution it can make. It can be used to control costs as well as contribute to revenue increases. Many organization are using data mining to help manage all phase of customer life cycle, including acquiring new customers, increasing revenue from exiting customers, and retaining good customers. By determining characteristics of good customers (profiling), a company can target prospects with similar characteristics. By profiling customers who have bought particular product it can focus attention on similar customers who have not bought that product (cross-selling). By profiling customers who have left, a company can act to retain customers who are at risk for leaving (reducing churn or attrition), because it is usually far less expensive to retain a customer than acquire a new one.
Data mining offers value across a broad spectrum of industries. Telecommunications and credit card companies are two of the leaders in applying data mining to detect fraudulent use of their services. Insurance companies and stock exchanges are also interested in applying this technology to reduce fraud.
Medical applications are another fruitful area: data mining can be used to predict the effectiveness of surgical procedures, medical tests or medications. Companies active in the financial markets use data mining to determine market and industry characteristics as well as to predict individual company and stock performances. Retailers are making more use of data mining to decide which products to stock in particular stores(and even how to place them within a store), as well as to assess the effectiveness of promotions and coupons. Pharmaceutical firms are mining large databases of chemical compounds and of genetic material to discover substances that might be candidates for development as agents for the treatments of disease.
There are two keys to success in data mining. First is coming up with a precise formulation of the problem you are trying to solve. A focused statement usually results in the best payoff. The second key is using the right data. After choosing from the data available to you, or perhaps buying external data, you may need to transform and combine it in significant ways.
The more the model builder can “play” with the data, build models, evaluate results, and work with the data some more (in a given unit of time), the better the resulting model will be. Consequently, the degree to which a data mining tool supports this interactive data exploration is more important than the algorithms it uses.
Ideally, the data exploration tools (graphics/visualization, query/OLAP) are well-integrated with the analytics or algorithms that build the models.
2.2 Data Description for Data Mining
2.2.1 Summaries and visualization
Before we can build good predictive model, we must understand our data. We can start by gathering a variety of numerical summaries (including descriptive statistics such as averages, standard deviations, and so forth) and looking at the distribution of the data. We may want to produce cross tabulations (pivot tables) for multi-dimensional data.
Data can be continuous, having any numerical value (e.g., quantity sold) or categorical, fitting into discrete classes (e.g., red, blue, green). Categorical data can be further defined as either ordinal, having a meaningful order (e.g., high/medium/low) , or nominal, that is unordered(e.g., postal codes). Graphing and visualization tools are vital aid in data preparation and their importance to effective data analysis cannot be overemphasized. Data visualization most often provides the Aha! leading to new insights and success. Some of the common and very useful graphical displays of data are histograms or box plots that display distributions of values. We may also want to look at scatter plots in two or three dimensions of different pairs of variables. The ability to add a third, overlay variable greatly increases the usefulness of some types of graphs.
Visualization works because it exploits the broader information bandwidth of graphics as opposed to text or numbers. It allows people to see the forest and zoom in on the trees. Patterns, relationships, exceptional values and missing values are often easier to perceive when shown graphically, rather than as lists of numbers and text. The problem in using visualization stems from the fact that models have many
dimensions or variables, but we are restricted to showing these dimensions on a two-dimension computer screen or paper.
2.2.2 Clustering
Clustering divides a database into different groups. The goal of clustering is to find groups that are different from each other, and whose members are very similar to each other. Consequently, someone who is knowledgeable in the business must interpret the clusters. Often it is necessary to modify the clustering by excluding variables that have been employed to group instances, because upon examination by the user identifies them as irrelevant or not meaningful. After you have found clusters that reasonably segment your database, these clusters may be used to classify new data. Some of the common algorithms used to perform clustering include Kohonen feature maps and K-means.
2.2.3 Link Analysis
Link analysis is a descriptive approach to exploring data that can help identify relationships among values in a database. The most common approaches to link analysis are association discovery and sequence discovery. Association discovery finds rules about items that appear together in an event such as a purchase transaction. Market-basket analysis is a well-known example of association discovery. Remember that association or sequence rules are not really rules, but rather descriptions of relationships in a particular database. There is no formal testing of models on other data to increase the predictive power of these rules. Rather there is an implicit assumption that the past behavior will continue in the future. It is often difficult to decide what to do with association rules you are discovered. In store planning, for example, putting associated items physically close together may reduce
the total value of market basket- customers may buy less overall because they no longer pick up unplanned items while walking through the store in search of desired items. Insight, analysis and experimentation are usually required to achieve any benefit from association rules .Graphical methods may also be very useful in seeing the structure of links. For instances, looking at an insurance database to detect potential fraud might reveal that a particular doctor and lawyer work together on an unusually large number of cases.
2.3 Predictive Data Mining
The goal of data mining is to produce new knowledge that the user can act upon. It does this by building a model of the real world based on data collected from variety of sources which may include corporate transactions, customer histories and demographic information, process control data, and relevant external databases such as credit bureau information or weather data. The result of the model building is a description of patterns and relationships in the data that can be confidently used for prediction.
To avoid confusing the different aspects of data mining. It helps to envision a hierarchy of the choices and decisions you need to make before you start;
• Business Goals • Type of prediction • Model type
• Algorithm • Product
At the highest level is the business goal: what is the ultimate purpose of mining this data? For example, seeking patterns in your data to help you retain good customers, you might build one model to predict customer profitability and a second model to identify customers likely to leave (attrition). Your knowledge of your organization's needs and objectives will guide you in formulating the goal of your models.
The next step is deciding on the type of prediction that's most appropriate:
(1) classification: predicting into what category or a class a case falls, or
(2) regression: predicting what number value a variable will have (if it's a variable
that varies with time, it is called time series prediction), in the example above, you might use regression to forecast the amount of profitability, and classification to predict which customers might leave. These are discussed in more detail below. Now you can choose the model type: a neural net to perform the regression, perhaps, and a decision tree for the classification. There are also traditional statistical models to choose from such as logistic regression, discriminant analysis, or general linear models.
Many algorithms are available to build your models. You might build the neural net using back propagation or radial basis functions. For the decision tree, you might choose among CART, C5.0, QUEST, or CHAID.
When selecting a data mining product, be aware that they generally have different implementations of a particular algorithm even they identify it with the same name. These implementation differences can affect operational characteristics such as
memory usage and data storage, as well as performance characteristics such as speed and accuracy.
Many business goals are best met by building multiple model types using a variety of algorithms. You may not able to determine which model type is best until you’ve tried several approaches.
In predictive models, the values or classes we are predicting are called the response, dependent or target variables. The values used to make the prediction are called the predictor or independent variables.
Predictive models are built, or trained, using data for which the value of response variable is already known. This kind of training is sometimes referred to as supervised learning because calculated or estimated values are compared with the known results. By contrast, descriptive techniques such as clustering are sometimes referred to as unsupervised learning because there is no already-known result to guide the algorithms
2.4 Data Mining Models and Algorithms
Let’s look at some of the types of models and algorithms used to mine data. Most products use variations of algorithms that have been published in computer science or statistics journals.
2.4.1 Neural Networks
Neural networks are of particular interest because they offer a means of efficiently modeling large and complex problems in which there may be hundreds of predictor variables that have many interactions. (Actual biological neural networks are
incomparably complex.) Neural nets may be used in classification problems (where the output is a categorical variable) or for regression (where the output variable is continuous).
A neural network starts with an input layer, where each node corresponds to a predictor variable. These nodes are connected to a number of nodes in a hidden
layer. Each input node is connected to every node in the hidden layer. The nodes in
the hidden layer may be connected to nodes in another hidden layer, or to an output
layer. The output layer consists of one or more response variables.
One of the advantages of neural network models is that they can be implemented to run on massively parallel computers with each node simultaneously doing its own calculations. Users must be conscious of several facts about neural networks. First, neural networks are not easily interpreted. There is no explicit rationale given for the decisions or predictions a neural network makes.
Second, they tend to over fit the training data unless very stringent measures, such as weight decay and/or cross validation, are used judiciously. This is due to the very large number of parameters of the neural network which, if allowed to be of sufficient size, will fit any data set arbitrarily well when allowed to train convergence.
Third, neural networks require an extensive amount of training time unless the problem is very small. Once trained, however they can provide predictions very quickly.
3 1 2 5 4 6 Inputs Output Hidden Layer
Fourth, they require no less data preparation than any other method, which is to say they require a lot of data preparation. One myth of neural networks is that data of any quality can be used to provide reasonable predictions. The most successful implementations of neural networks (or decision trees, or logistic regression, or any other method) involve very careful data cleansing, selection, preparation and pre-processing. For instance, neural nets require that all variables be numeric. Therefore categorical data such as ‘state’ is usually broken up into multiple dichotomous variables, each with “1”(yes) or “0” (no) value. The resulting increase in variables is called the categorical explosion.
Finally, neural networks tend to work best when the data set is sufficiently large and the signal-to noise ratio is reasonable high. Because they are so flexible, they will find many false patterns in a low signal-to-noise ratio situation.
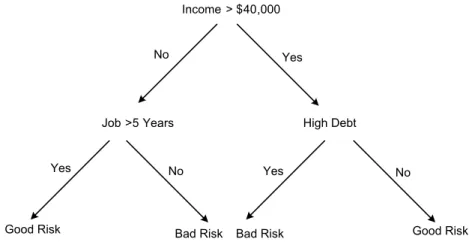
2.4.2 Decision Trees
Decision trees are a way of representing a series of rules that lead to a class or value. For example, you may wish to classify loan applications as good or bad credit risks. Figure 2.2 shows a simple decision tree that solves this problem while illustrating all the basic components of a decision tree: the decision node, branches and leaves.
Income > $40 000,
No Yes
5
Job > Years High Debt
Yes No Yes No
Good Risk Bad Risk Bad Risk Good Risk
Figure 2. 2 A Simple Classification tree
The first component is the top decision node, or root node, which specifies a test to be carried out. The root in this example is "Income > $ 40,000." The results of this test cause the tree to split into branches, each representing one of the possible answers. In this case, the test “Income> $40,000” can be answered either “yes” or “no”, so we get two branches.
Depending on the algorithm, each node may have two or more branches. For example, CART generates trees only two branches at each node. Such a tree is called a binary tree. When more than two branches it is called a multi way tree.
Decision trees models are commonly used in data mining to examine the data and induce the tree and its rules that will be used to make predictions. A number of different algorithms may be used for building decision trees including CHAID (Chi-squared Automatic Interaction Detection), CART(Classification And Regression Trees), QUEST, and C5.0. Decision trees which are used to predict categorical variables are called classification trees because they place instances in categories or classes. Decision trees used to predict continuous variables are called
regression trees.
2.4.3 Multivariate Adaptive Regression Splines (MARS)
In the mid-1980’s one of the inventors of CART, Jerome H. Friedman, developed a method designed to address its shortcomings.
The main disadvantages he wanted to eliminate were: • Discontinuous predictions (hard splits). • Dependence of all splits on previous ones.
• Reduced interpretability due to interactions, especially high-order interactions.
To this end he developed the MARS algorithm. The basic idea of MARS is quite simple, while the algorithm itself is rather involved. Very briefly, the CART disadvantages are taken care of by:
• Replacing the discontinuous branching at a node with a continuous transition modeled by a pair of straight lines. At the end of the
model-building process, the straight lines at each node are replaces with a very smooth function called spline.
• Not requiring that new splits be dependent on previous splits.
Unfortunately, this means is a method for deriving a set of rules to clarify and MARS loses the tree structure of CART and cannot produce rules. On the other hand, MARS automatically finds and lists the most important predictor variables as well as the interactions among predictor variables. MARS also plots the dependence of the response on each predictor. The result is an automatic non-linear step-wise regression tool.
2.4.4 Rule Induction
Rule induction is a method for deriving a set of rules to classify cases. Although decision trees can produce a set of rules, rule induction methods generate a set of independent rules which do not necessarily (and are unlikely to) form a tree. Because the rule inducer is not forcing splits at each level, and can look ahead, it may be able to find different and sometimes better patterns for classification. Unlike trees, the rules are generated may not cover all possible situations. Also unlike trees, rules may sometimes conflict in their predictions, in which case it is necessary to chose which rule to follow. One common method to resolve conflicts is to assign a confidence to rules and use the one in which you are most confident. Alternatively, if more than two rules conflict, you may let them vote, perhaps weighting theirs votes by confidence you have in rule.
2.4.5 K-Nearest neighbor and memory-based reasoning (MBR)
When trying to solve new problems, people often look at situation to similar problems that they have been previously solved. K-nearest neighbor (K-NN) is a classification technique that uses a version of this same method. It decides in which class to place a new case by examining some number – the “k” in k-nearest neighbor – of the most similar cases of neighbor. It counts the number of cases for each class, and assigns the new case to the same class to which most of its neighbors belong.
The first thing you must do to apply k-NN is to find a measure of the distances between attributes in the data and then calculate it. While this is easy for numeric data, categorical variables need special handling. For example, what is the distance between blue and green? You must then have a way of summing the distance measures for the attributes. Once you can calculate the distance between cases, you then select a set of already classified cases to use as the basis for classifying new cases, decide how large a neighborhood in which to do the comparisons, and also decide how to count the neighbors themselves. (e.g., you might give more weight to nearer neighbors than farther neighbors).
K-NN puts a large computational load on computer because the calculation time increases as the factorial of the total number of points. K-NN models are very easy to understand when there are few predictor variables. They are also useful for building models that involve non-standard data types, such as text. The only requirement for being able to include a data type is the existence of an appropriate metric.
2.4.6 Logistic Regression
Logistic regression is a generalization of linear regression. It is used primarily binary variables (with values such as yes/no or 0/1) and occasionally multi-class variables. Because the response variable is discrete, it cannot be modeled directly by linear regression. Therefore, rather than predict whether the event itself (the response variable) will occur, we build the model to predict the logarithm of odds of its occurrence. This logarithm is called the log odds or the logit transformation. The odds ratio:
Probability of an event occurring / probability of the event not occurring Having predicted the log odds, you then take the anti-log of this number to find the odds.
While logistic regression is a very powerful modeling tool, it assumes that the response variable (the log odds, not the event itself) is linear in the coefficients of the predictor variables. Furthermore, the modeler, based on his or her experience with the data and data analysis, must choose the right inputs and specify their functional relationship to the response variable. It is up to model builder to search for the right variables, find their correct expression, and account for their possible interactions.
2.4.7 Discriminant analysis
Discriminant analysis is the oldest mathematical classification technique, having been first published by R.A. Fisher in 1936 to classify the famous Iris botanical data into three species. It finds hyper-planes (e.g., lines in two dimension, planes in
three etc.) that separate the classes. The resultant model is very easy to interpret because all the user has to do is determine on which side of the line (or hyper-plane) a point falls. Training is simple and scalable. The technique is very sensitive to patterns in the data. It is used very often in certain disciplines such as medicine, the social science, and field biology.
Discriminant analysis is not very popular in data mining, however, for three main reasons. First, it assumes that all of the predictor variables are normally distributed (i.e., their histograms look like bell-shaped curves), which may not be the case. Second, unordered categorical predictor variables (e.g., red/blue/green) cannot be used at all. Third, the boundaries that separate the classes are all linear forms(such as lines or planes), but sometimes the data just can’t be separated that way. Recent versions of discriminant analysis address some of these problems.
2.4.8 Generalized Additive Models (GAM)
There is a class of models extending both linear and logistic regression; known as generalized additive models or GAM. They are called additive because we assume that the model can be written as the sum of possibly non-linear functions, one for each predictor. GAM can be used either for regression or for classification of a binary response. The response variable can be virtually any function of the predictors as long as there are not discontinuous steps. GAM, using computer power in place of theory or knowledge of the functional form, will produce a smooth curve, summarizing the relationship as described above. The most common estimation procedure is backfitting. Instead of estimating large numbers of parameters as neural nets do, GAM goes one step further and estimates a value of the output for each value of the input. – one point, one estimate. As with the
neural net, GAM generates a curve automatically, choosing the amount of complexity based on the data.
2.4.9 Boosting
If you were to build a model using one sample data, and then build a new model using the same algorithm but on a different sample, you might get a different result. After validating the two models, you could choose the one best met your objectives. Even better results might be achieved if you build several models and let them vote, making a prediction based on what the majority recommended. Of course, any interpretability of the prediction would be lost, but the improved results might be worth it.
This is exactly the approach taken by boosting, a technique first published by Freund and Schapire in 1996. Basically, boosting takes multiple random samples from the data and builds a classification model for each. The training set is changed based on the results of the previous models. The final classification is the class assigned most often by the models. The exact algorithms for boasting have evolved from the original, but the underlying idea is the same. Boosting has become a very popular addition to data mining packages.
2.4.10 Genetic Algorithms
Genetic algorithms are not used to find patterns, but rather to guide the learning process of data mining algorithms such as neural nets. Essentially, genetic algorithms act as a method for performing a guided search for good models in the solution space.
They are called genetic algorithms because they loosely follow the pattern of biological evolution in which the members of one generation (of models) compete to pass on their characteristics to the next generation (of models), until the best (model) is found. The information to be passed on is contained in “chromosomes,” which contain the parameters for building the model.
For example, in building a neural net, genetic algorithms can replaces backpropagation as a way to adjust the weights. The chromosome in this case would contain the weights. Alternatively, genetic algorithms might be used to find the best architecture, and chromosomes would contain the number of hidden layers and the number of nodes in each layer.
While genetic algorithms are an interesting approach to optimizing models, they add a lot of computational overhead.
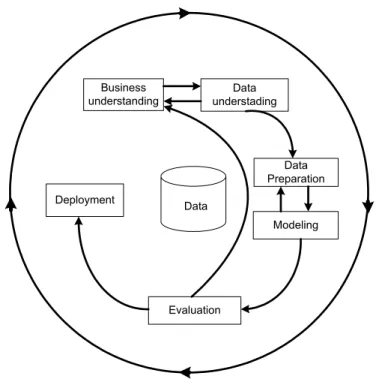
2.5 The Data Mining Process
Recognizing that a systematic approach is essential to successful data mining, many vendor and consulting organizations have specified a process model designed to guide the user (especially someone new to building predictive models) through a sequence of steps that will lead to good results. SPSS used 5A’s – Assess, Access, Analyze, Act and Automate- and SAS uses SEMMA – Sample, Explore, Modify, Model, Assess.
A consortium of vendors and users consisting of NCR systems engineering (Copenhagen-Denmark), Daimler-Benz AG (Germany), SPSS/Integral Solutions Ltd(England) and OHRA Verzekeringen en Bank Groep B.V (The Netherlands) has
been developed a specification called CRISP-DM – Cross Industry Standard Process for Data Mining.
The general CRISP-DM process model includes six phases that address the main issues in data mining. The six phases fit together in a cyclical process, illustrated in the following figure.
Data Deployment Evaluation Data Preparation Modeling Business understanding Data understading
Figure 2. 3 Phases of the CRISP-DM reference model
These six phases cover the full data mining process, including how to incorporate data mining into your larger practices. The six phases include:
• Business Understanding: This is perhaps the most important phase of data mining. Business understanding includes determining business objectives, assessing the situation, determining data mining goals, and producing a project plan.
• Data Understanding: Data provides the "raw materials" of data mining. This phase addresses the need to understand what your data resources are
and the characteristics of these resources. It includes collecting initial data, describing data, exploring data, and verifying data quality.
• Data Preparation: After cataloging your data resources, you will need to prepare your data for mining. Preparations include selecting, cleaning, constructing, integrating, and formatting data.
• Modeling: This is, of course, the flashy part of data mining, where sophisticated analysis methods are used to extract information from the data. This phase involves selecting modeling techniques, generating test designs and building and assessing models.
• Evaluation: Once you have chosen your models, you are ready to evaluate how the data mining results can help you achieve your business objectives. Elements of this phase include evaluating results, reviewing the data mining process, and determining the next steps.
• Deployment:. This phase focuses on integrating your new knowledge into your everyday business processes to solve your original business problem. This phase includes plan deployment, monitoring, and maintenance, producing a final report, and reviewing the project.
3 Methods
3.1 Data Sets
In this thesis, fraud detection is based on the calling activity of mobile phone subscriber (CDR’s), demographic data, and payment data. In order to develop models of normal and fraudulent behavior and to be able to diagnostic accuracy of the model, call data, demographics and payment data exhibiting both kinds of behavior are needed.
Data Warehouse CDR’s
Customer
Demographic InformationBilling
Data Extraction Data Preprocess Sample DB Customer Segmentation Model Creation Model Performance Evaluation
The data of 560 post-paid subscribers from 2002 is obtained from a Mobile Phone Operator’s data warehouse. Normal and fraudulent ratio was one to one. First daily CRD’s are extracted and aggregated weekly, and then demographic data and payment data are extracted. All of the extracted data are preprocessed and inserted into a table in the database. Then data set is divided into training and test sets. The training set consists of 2/3 of 560 subscribers which is 374 and the test set consists of 1/3 which is 186.
3.2 Exploratory Data Analysis
3.2.1 Getting to know the Data Set
Simple (or-not-so-simple) graphs, plots, and table often uncover important relationships that could indicate fecund areas for further investigation. We use exploratory methods to delve into the fraud data set. We use the Clementine data mining software package from SPSS Inc. for the Exploratory Data Analysis (EDA).The data set contains 40 variables worth of information about 560 customers, along with an indication (status flag A/I) for fraud.
Table 3. 1 Subscriber information (call, demographic and, payment data)
CallerId Categorical unique subscriber ID
GenTotMin Integer total minutes customer used
GenTotCharge Continuous total charge of calls
GenTotCalls Integer total number of calls
SMSCharge Continuous total charge of SMS calls
SMSCalls Integer total number of SMS calls
PSTNTotMin Integer total minutes of PSTN calls
PSTNTotCharge Continuous total charge of PSTN calls
PSTNTotCalls Integer total number of PSTN calls
INTTotMin Integer total minutes of International calls
INTTotCharge Continuous total charge of international calls
INTTotCalls Integer total number of int. calls
VASTotMin Integer total minutes of VAS calls
VASTotCharge Continuous total charge of VAS calls
VASTotCalls Integer total number of VAS calls
ROATotMin Integer total minutes of Roaming calls
ROATotCharge Continuous total charge of Roaming calls
ROATotCalls Integer total number of Roaming calls
OGSMTotMin Integer total minutes of other GSM
OGSMTotCharge Continuous total charge of other GSM
OGSMTotCalls Integer total number of OGSM calls
GSMTotMin Integer total minutes of GSM calls
GSMTotCharge Continuous total charge of GSM calls
GSMTotCalls Integer total number of GSM calls
PRETotMin Integer total minutes of Premium calls
PRETotCharge Continuous total charge of Premium calls
PRETotCalls Integer total number of PRE. Calls
ReasonCode Integer reason code for fraud type
ActInvNum Integer active number of invoices
ActInvCost Integer amount of active invoices
AddressCity Integer city name (1-81)
PackageID Integer package Type (1-53)
AccountLength Integer duration of the subscription
Type Integer 1= Corporate, 2= Person
Gender Integer 1= Male, 2= Female
Age Integer subscriber age
AlarmNum Integer number of raised alarms
AlarmScore Integer value of alarms
Cluster Integer customer segments
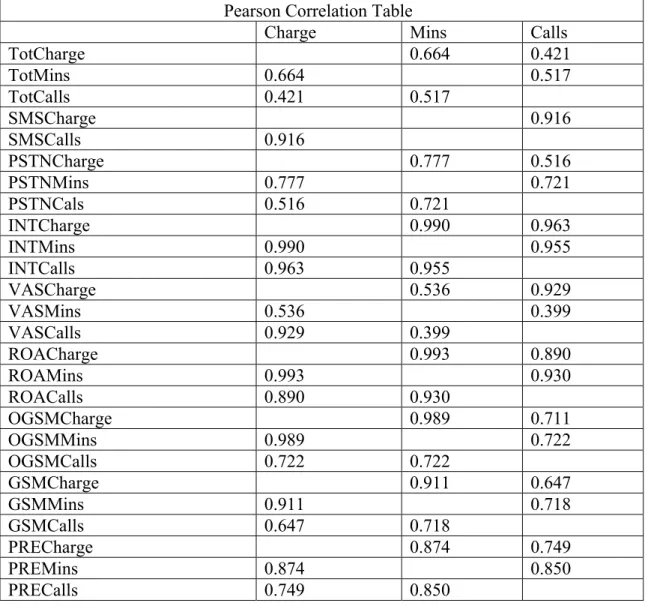
3.2.2 Dealing with Correlated Variables
One should take care to avoid feeding correlated variables to one’s data mining and statistical models. At best, using correlated variables will overemphasize one data component: at worst, using correlated variables will cause the model to become unstable and deliver unreliable results.
The call behavior data set contains three variables: mins, calls, and charge. The data description indicates that the charge variable may be a function of minutes and calls, with the result that the variables would be correlated.
There does seem to be relationship between Mins and Calls or between Charge and Calls. One may have expected that the number of calls increased, the number of minutes would tend to increase (and similarly for charge), resulting in a positive correlation these fields. The Table 3.2 shows the Pearson correlation for these fields. The only difference is TotCharge, TotMins and TotCalls which does not show positive strong correlations like others. Since these fields are derived from the sum of other call type. We can eliminate these there fields for the data mining.
The other call types which have strong positive correlation, we should eliminate the correlated values in order not to get incoherent results.
After ranking the attributes with Gain Attribute Evaluator in Weka and only getting the attributes with higher impact on the outcome, there were not any correlated attributes anymore.
Meantime, we will also apply the Factor Analysis in order to reduce the number of variables as an alternative way.
Table 3. 2 Pearson Correlation Table
Pearson Correlation Table
Charge Mins Calls
TotCharge 0.664 0.421 TotMins 0.664 0.517 TotCalls 0.421 0.517 SMSCharge 0.916 SMSCalls 0.916 PSTNCharge 0.777 0.516 PSTNMins 0.777 0.721 PSTNCals 0.516 0.721 INTCharge 0.990 0.963 INTMins 0.990 0.955 INTCalls 0.963 0.955 VASCharge 0.536 0.929 VASMins 0.536 0.399 VASCalls 0.929 0.399 ROACharge 0.993 0.890 ROAMins 0.993 0.930 ROACalls 0.890 0.930 OGSMCharge 0.989 0.711 OGSMMins 0.989 0.722 OGSMCalls 0.722 0.722 GSMCharge 0.911 0.647 GSMMins 0.911 0.718 GSMCalls 0.647 0.718 PRECharge 0.874 0.749 PREMins 0.874 0.850 PRECalls 0.749 0.850 3.2.3 Exploring Variables
One of the primary reasons for performing exploratory data analysis is to investigate the variables, look at histograms of numeric variables, examine the distributions of categorical variables, and explore the relationships among sets of variables.
Figure 3.2 shows that there is an association of fraud with the account length. We may say that fraudsters are usually from the new subscribers.
Figure 3. 2 Histogram of subscribers’ account length with status overlay
Figure 3.3 show that there are more fraudsters in some regions.
Figure 3.4 shows that, the number of the fraudsters in some tariff packages is higher.
Figure 3. 4 Distribution of PackID attribute with status overlay
Figure 3.5 shows that Male fraudster are much higher than the female.
Figure 3. 5 Distribution of Gender attribute with status overlay
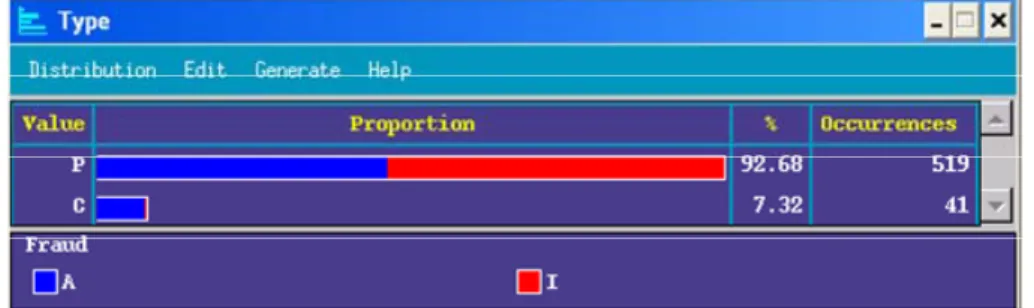
Figure 3.6 show those fraudsters are mainly individual subscriber rather than corporate subscribers.
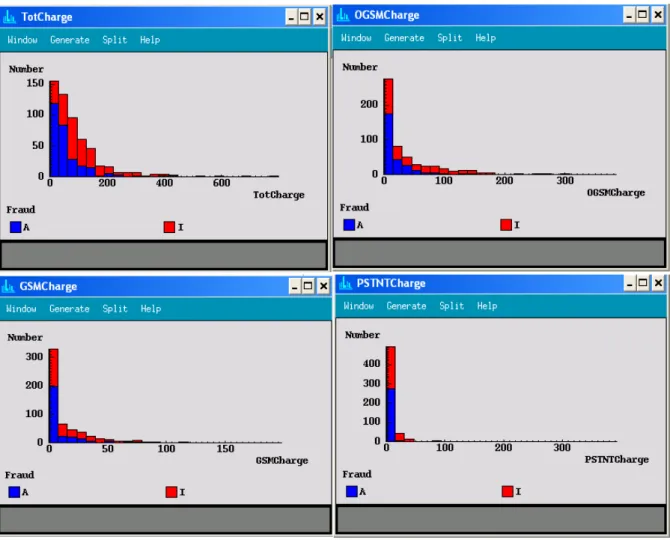
Figure 3.7 shows that TotCharge, OGSMCharge, GSMCharge and PSTNCharge variables are important variable to detect fraudsters.
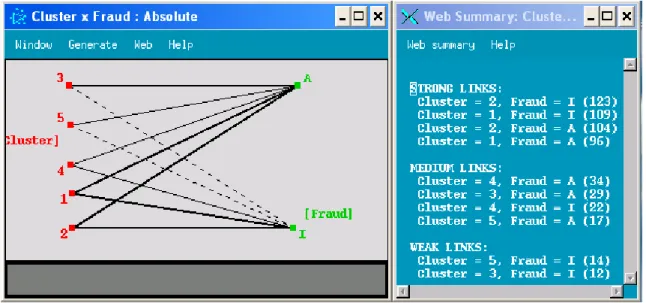
Figure 3.8 shows the links between Fraud and Clusters. While Clusters 3 and 5 have weak links, Clusters 1 and 2 have strong links, Cluster 4 has medium link, with fraudulent user.
Clusters 1 and 2 have strong links, Cluster 3, 4 and 5 have medium link with normal user.
Figure 3. 8 Web graph of Cluster vs. Fraud
As a result of Exploratory Data Analysis, we have found that some variables like AccLentgh, Region, PackID, Gender, Type , TotCharge, OGSMCharge, GSMCharge and PSTNcharge with status overlay show important tendency for fraudulent use. While some of the other variables show slight tendency, others show no tendency at all.
3.3 Cluster Analysis
Cluster analysis is an exploratory data analysis technique designed to reveal natural groupings within a collection of data. The basic criterion used for this is distance, in the sense that cases close together should fall into the same cluster, while observations far apart should be in different clusters. Ideally the cases within a cluster would be relatively homogenous, but different from those contained in other clusters.
As cluster analysis is based on distance derived from the fields in the data, these fields are typically interval, ordinal or binary in scale. When clustering is successful, the results suggest separate segments within the overall set of data.
Given these characteristics, it is not surprising that cluster analysis often employed in market segmentation studies, since the aim is to find distinct types of customers towards whom more targeted and effective marketing and sales action may be taken. In addition, for modeling applications, clustering is sometimes performed first to identify subgroups in the data that might behave differently. These subgroups can then be modeled separately or the cluster membership variable can be included as a predictor.
There are many different clustering methods, but in the area of data mining two are in wide usage. This is because the large class of hierarchical clustering methods requires that distances between every pair of data records be stored (n*(n-1)/2) and updated, which places a substantial demand on memory and resources for the large files common in data mining. Instead clustering is typically performed using
K-means algorithm or using an unsupervised neural network method (Kohonen). Of the two, K-means clustering is considerably faster.
Cluster analysis is not an end in itself, but one step in a data mining project. We would like to use this clusters as predictors for late assistance in classifying customers as fraudulent or not. Therefore, we will not to include the demographics data and Status field among the variables used to build the clusters.
We used K-means clustering and function "k-means" partitions into K mutually exclusive clusters, and return a vector of indices indicating to which of the k clusters it has assigned each observation. Unlike the hierarchical clustering methods used, K-means does not create a tree structure to describe the groupings in your data, but rather creates a single level of clusters. K-means treats each observation in your data as an object having a location in space. It finds a partition in which objects within each clusters are as close to each other as possible, and as far from objects in other clusters as possible. Each cluster in the partition is defined by its member objects and by its centroid, or center. The centroid for each cluster is the point to which the sum of the distances from all objects in that cluster is minimized. (Mathworks 2002) We apply the K-means algorithm only to the call behavior data in the fraud data set using Matlab Statistics Toolbox.
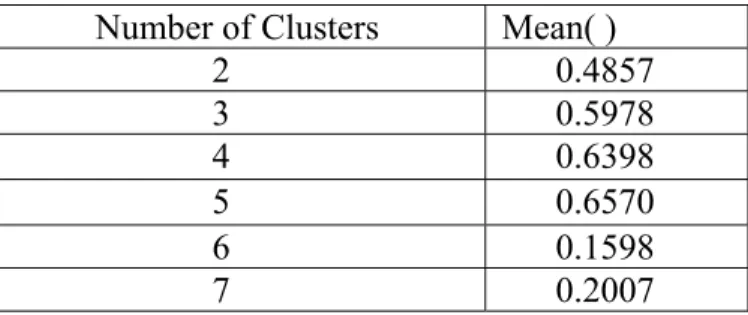
Attempts to cluster the fraud data set into 2,3,4,5,6 and 7 clusters are made. Silhouette plots and average silhouette values of 2,3,4,5,6,7 clusters made by k-means are compared. It is obviously seen that the best values are in cluster 5. In figure 3.9 silhouette plot for 5 clusters created by k-means are shown.