The volatility spillover effects among risk appetite indexes: Insight from the
vix and the rise
Saffet AKDAG
aa Department of Banking and Finance, Faculty of Applied Sciences, Tarsus University,
Turkey, E-mail: [email protected] Orcid: 0000-0001-9576-6786
Ömer İSKENDEROGLU
bb Department of Business, Faculty of Economics and Administrative Sciences, Nigde Ömer
Halisdemir University, Nigde, Turkey, E-Mail: [email protected], Orcid: 0000-0002-3407-1259
Andrew Adewale ALOLA*
c, dc Department of Economics and Finance, Faculty of Economics, Administrative and Social
Science. Istanbul Gelisim University. *E-mail: [email protected]
d Department of Financial Technologies,
South Ural State University, Chelyabinsk, Russia
DECLARATION
Acknowledgements: The author declares that he has no relevant or material financial interests that relate to the research described in this paper. We thank the editor and anonymous referees for their constructive comments, which greatly improved the quality of the paper.
Availability of data: Data will be made availabe upon request
Competing interests: In this study, there is no conflicting interest
Funding: During the process of preparing the manuscript there is no kind of financial
Author’s contribution:
Saffet AKDAG- Assistant Professor Saffet AKDAG was responsible for the data collection and estimation.
Ömer İSKENDEROGLU- On his own part, Assistant Professor Ömer İSKENDEROGLU contributed to the writing and formatting the manuscript in accordance to journal requirement.
Andrew Adewale ALOLA- In addition to making significant contribution in the aspect of writing, Assistant Professor Andrew Adewale ALOLA was significantly responsible for the language editing and corresponding with the journal.
Abstract
This study aims to test the volatility spillover effects among the global risk appetite, the VIX (also known as the fear index) and the RISE index (known as the indicator of investor risk appetite index in Turkey). A temporary or permanent causality Granger and Breitung Candelon (2006) frequency domain causality analyses were performed by using the weekly dataset spanning from January 2010 to December 2018. The results obtained from the study reveals a unilateral causal relationship running from the VIX toward the RISE index. This causality inference is also observed separately in the short-, medium- and the long-run. Consequentlyshort-, the investigation found that there is a permanent causal relationship running from the VIX toward the RISE index. These results also indicate the existence of the volatility spillover effect among the risk appetite indexes. Consequently, the current study offers significant policy directives from the side of the government and other stakeholders especially that are targeted at mitigating fear factors in the economy.
Keywords: Risk Appetite, Volatility Spillover Effects, Frequency Domain Causality,
1. Introduction
One of the most important factors for investment in capital markets is the existence of appropriate investment conditions. Appropriate investment conditions are usually examined by market volatility arising from market situations and dynamics (Balcilar et al., 2018; Alola, Cop & Alola, 2019; Saint Akadiri, Alola & Uzuner, 2019). Market volatility has been a subject of frequent scrutiny in the hands of practitioners and researchers. The volatility index (VIX) was first introduced by the Chicago Board Options Exchange in 1993 for measuring volatility (Black & Scholes, 1973; Merton, 1973). The VIX is an index calculated using the American type call and put option price movements, including the S&P 100 index options at an average expiration of 30 days. The development of the index was carried out by Black and Scholes (1973) and Merton (1973). The increase of the VIX in excess of 30% refers to the rise of uncertainty and volatility and it suggests that the market does not fulfill adequate investment conditions. In this case, investors are expected to exhibit an attitude of investment fear.
Generally, practical studies reveal that volatility becomes higher whenever the market is on a downward trend (Jung, 2016; Alola & Uzuner, 2019). Accordingly, it is possible to claim that under the existence of the information asymmetry investors exhibit a risk-averse attitude (Wang, 2019). Also, the rise of the VIX can be expressed as the rise of risk, thus a high volatility conditions expectedly increase uncertainty. In this case, it is stated that all investors have random and wrong selections and they wrongly measure the values of securities (Zou & Sun, 2012). The VIX value below 20% indicates that volatility is decreased, the investors’ risk appetite is increased, and the investors become optimistic about the future.
Investors may be influenced by many factors in making investment decisions. In relation to the issue; Chang et al. (2000) stated that investors make investment decisions in accordance with market volatility. There are many studies that examined the volatility of the stock exchange markets and the VIX as well as the structure of such interaction. Fleming, Ostdiek, and Whaley (1995), Whaley (2000), Giot (2005), Corrado and Miller (2005), Baur and Jung (2006), Ting (2007), Whaley (2008), Bekaert et. al (2009), Sarwar (2012), Kumar (2012), Rapach, Strauss, and Zhou (2013), Hao and Zhang (2013), Yunus (2013), Fernandes, Medeiros and Scharth (2014), Shaikh and Padhi (2014), Kaya and Coşkun (2015) are among the example studies in the literature. The vast majority of these studies have concluded that volatility affects market returns. However, does the volatility of a market affect only the returns on securities in the relevant market?
Given this question, one of the important problems encountered in the investment process is that a negative situation observed in one country also affects the other country’s markets. This negative situation in the markets is referred as the Volatility Spillover Effects (Wang, 2007; Alola, Cop & Alola, 2019). The dependence of the markets on each other has resulted in a positive or negative effect of volatility in one market on another (Finta et al., 2017; Gamba-Santamaria et al., 2017). The transmission mechanism of this contagion in developing countries has been examined particularly by Kaminsky and Reinhart (2003), and Dungey et al. (2006) for markets with the same capital size in the applied finance literature. Volatility spillover among countries with different capital sizes has been examined by Kanas (1998), Edwards and Susmel (2001), Fuiji (2005), Baur and Fry (2009) and Joshi (2011). There is a wide range of results obtained from related studies.
Risk appetite index in Turkey (RISE), is calculated separately for different investor groups (all investors, domestic investors, foreign investors, domestic real entities, domestic legal entities, domestic funds, and qualified investors) by the cooperation of The Central Securities Depository (CSD) of Turkey and the Özyegin University. The RISE is a weekly index calculated based on the weekly portfolio changes of each investor with a stock portfolio value at and in excess of 5,000 TL. at any past period. The index is calculated by using the portfolio value change of the stocks and type-A investment funds which are owned by the investors every Friday excluding the change in ISE100 index. The weighted average of the previous 52-week values is subtracted from the adjusted portfolio value of the related week, and it is calculated how much each investor deviates from its normal during that week. Based on these deviations matrix, the investors are scored between ‘0’ and ‘100’ and a general risk appetite index is calculated for the whole market by taking the weighted average of the scores according to the ratio of the investors’ portfolio size of that week to the total market size (Sarac et al., 2016). The RISE index assumes a threshold value of 50, below which the risk appetite of the investors is decreased and above which the risk appetite of the investors is increased.
In respect to this, the current study objectively aimad at examining whether or not there is a volatility spillover between the VIX and the RISE index. In the literature, the volatility spillovers are often studied by the derivatives of GARCH analysis either between different market returns or between the VIX and market returns. However, the current study is novel in that it considered the causal relationship between the VIX and the RISE index for the first time to the best of authors’ knowledge. In doing so, the study emplyed the Granger causality approach and through the frequency domain causality test proposed by Breitung and Candelon
(2006) which is different from other relevant studies because it presnet the causality in term of frequency. Thus, the volatility spillover is evaluated based on the causal relationship for the short-, medium- and long-run over the period of January 2010 to December 2018.
Consequently, the study consists of five parts. In the first part, the basic concepts related to the subject are presented, while in the second part, the review of previous literature including the studies on the volatility spillover effects as well as studies which examined the relationships between the VIX (fear index) and financial markets are undertaken. In the third part, the data employed and the methodology used in the study are introduced. In the fourth part, the findings of the study are presented. In the last part, a general evaluation is made in the direction of the findings which also contains policy implications.
2. Literature Review
The volatility that emerges in a country’s markets affects not only financial products of the country’s markets but also affects the financial products of other countries’ markets. In the world of accelerated globalization, countries’ financial markets which are integrated into the World financial markets tend to become more prone to the volatility effects that are brought forth in other financial markets due to contagion (Schmukler et al., 2003). Volatility spillover effects are observed through the volatile market conditions affecting the other countries’ markets due to an adverse situation observed in one country (Wang, 2007). As a matter of fact, many studies that examine this subject of market volatility are increasingly availabe in existing literature (Adam, Marcet & Nicolini, 2016; Brunetti, Büyükşahin & Harris, 2016; Bašta & Molnár, 2018; Graham, Nikkinen & Peltomäki, 2019). Although these studies are the same regarding their contents, they differ regarding the variables used. In this context, the literature is composed of two parts. In the first part of the studies, the extant literature that examined the determinants of market volatility and the impact of such volatility on different markets is primarily considered. On the other hand, the second part of the studies comprises of the studies on the impacts of volatility indexes (the risk appetite index or the fear index) on different financial markets become the subject of the relevant analyses. In this concept, the studies conducted on whether or not the volatility that occurs in the first group has an impact on other markets are summarized below.
Liu and Pan (1997), as one of the pioneering studies conducted on the interactions of the volatility in different markets using the GARCH model, stated that the volatility spillover effect
in the US and Japan has impacts on the Hongkong, Singapore, Taiwan, and Thailand markets. As a result of the study, it is determined that the volatility spillover effect in the US market is larger than in the other markets. Similarly, Ng (2000) detected the existence of the volatility spillover effect between the shocks occurring in the US and Japanese stock exchanges and the stock markets of six Pacific countries by using the GARCH model. However, Kanas (2000) examined the existence of volatility spillover effect between stock returns and exchange rates in the United States, United Kingdom, Japan, Germany, France, and Canada using EGARCH models. As a result of the study, it is stated that in all other countries except for Germany, the volatility spillover effect exists from the stocks toward the exchange rates, and this effect increased even more especially after 1987.
In another stusdy by Yang and Doong (2004), the emplooyed estimation model (the EGARCH models) detected the existence of the volatility spillover effect between stocks and foreign exchange markets in the G7 countries. Yu and Hassan (2008), another study in which a similar methodology (AR-GARCH model) was used, stated that the volatility in the US markets is effective in the majority of the MENA (the Middle East and North Africa) countries including Turkey. In Lee (2009), the VAR-GARCH model was used, and the presence of volatility spillover effect was detected among the stock exchange markets of six Asian countries as a result of the analysis. Du et al. (2011), which was carried out with a different method than the studies mentioned so far, used the Bayesian Markov Chain Monte Carlo method. As a result of the study, it is stated that the volatility in crude oil prices in the USA is effective on commodity markets. Allen et al. (2013), in which the Asian countries were also included in the analysis using VARMA-AGARCH models, stated that there is a volatility spillover effect between the Chinese stock exchange market and Australia, Japan, Hong Kong, Taiwan, and Singapore stock exchange markets.
Furthermore, the study of Haixia and Shiping (2013) examined the existence of volatility spillover effect in the commodity markets of crude oil, corn and fuel ethanol traded in relation to the Chinese stock exchange market by using EGARCH and BEKK-MVGARCH models. As a result of the study it was found that there is a unilateral spillover effect from crude oil market toward corn and fuel ethanol, and there is a bilateral spillover effect between corn market and fuel ethanol market. However, there is significant evidence of spillover effect from corn and fuel ethanol markets toward crude oil market was found. The threshold GARCH model was applied in Jawadi et al. (2015), and weak evidence of the volatility spillover effect between the US and Frankfurt, London and Paris stock markets was detected during the pre-crisis period.
However, again in Jawadi et al. (2015), strong evidence of the volatility spillover effect from the US stock market toward the other stock markets during and after the crisis was found. In order to determine whether or not there is the volatility spillover effect from developed countries towards the developed countries, Balli et al. (2015) used the AR-GARCH model, and it is stated that there is strong evidence of the volatility spillover effect from developed countries toward developing countries.
Moreover, in the study of Liow (2015) which is centered on the analytical study of developing countries, the financial data such as exchange rates and interest rates in relation to the stocks and bonds of various developing countries were examined using the GARCH model. The study found the there is excessive volatility in the markets was which is sufficient to cause significant volatility of the examined countries. In the current literature, the volatility spillover effect has not only been examined in financial markets or commodity markets but also different goods and service markets. Panagiotou (2015) which was conducted on olive oil markets in this direction also used ARCH and GARCH models in parallel with current literature. The results of the study stated that the volatility spillover effect exists between the olive oil markets of Spain, Italy, and Greece. In Bajo-Rubio et al., (2017) which was recently performed on Turkey, the GARCH model was used in parallel to the existing literature. The study revealed that the volatility spillover effect between Dollar and Euro exchange rates and the DAX and the S&P 500 stock markets is effective on Turkey’s stock exchange markets. In Baumöhl et al. (2018), a very comprehensive study, the Granger causality analysis was used to examine the existence of the volatility spillover effect among the stock exchange markets of 40 developed and developing countries. According to the analysis results, the existence of the volatility spillover effect among the markets was detected.
In the second part of this section, the study of Haugen (2006) examined the effect of volatility indexes (risk appetite or fear index) on financial markets. The study found that there is a relationship among the Norwegian macroeconomic factors and risk appetite data of investors. Haugen (2006) employed the Bayesian approach and found that there is a significant and unilateral relationship between macroeconomic factors and risk appetite. Similarly, Shen and Hu (2007) examined different samples and found a significant and negative relationship between the risk appetite index of Taiwan banks and various index returns of the Taiwan stock exchange. Whereas, Hermosillo (2008) used a vector autoregression (VAR) model and found a significant relationship among the global risk appetite index (the VIX) and the bond prices of 17 countries in the Eurozone and the crises experienced in these countries. Additionally, the
study of Korkmaz and Çevik (2009) which considered several countries also employed the GJR-GARCH model and found that the VIX influenced the stock market of 15 countries such that the volatility of stock exchange markets in those countries are observed to have increased.
Additionally, Ekşi (2011) examined the existence of the direction of self-sufficiency of a unilateral causality running from the VIX to the bank credits using the cointegration test and the ARDL error correction method. The Ekşi (2011) study is similar to Ozair (2014) in which the direction of variation was similarly examined. Ozair (2014) examined a bilateral causality between the S&P 500 index and the VIX data using the VAR and the Granger causality analyses. Also, the study of Adhikari and Hilliard (2014) employed simialr methodology of Granger causality analysis and found that VIX is a signicant Granger cause of the volatility in the S&P 100 index. Unlike the other studies, Kaya et al. (2014) used the ARDL model to measure whether or not the VIX could be regarded as a global appetite index internationally. In that respect, Kaya et al. (2014) concluded that the VIX and stock markets in the OECD countries had a significant and long-term relationship. But the study of Kaya and Coşkun (2015) which considered the case of Turkey by employing the Granger causality approach found a unilateral causal relationship from the VIX to the BIST 100 index. Also, the study found that VIX index negatively affect the BIST 100 index.
Similarly, Erdoğdu and Baykut (2016) used the Toda-Yamamato Granger causality along with ARDL bounds tests and found lack of evidence of a long-term relationship between the VIX and the MOVE index. However, the study revealed the existence of a unilateral causality running from the VIX to the Borsa Istanbul Bank index. Likewise, Huang and Wang (2017) employed the cross-sectional standard deviation of return (CSSD), the cross-sectional absolute deviation of return (CSAD) for the Taiwan stock exchange and found the existence of a relationship between the VIX and the Taiwan Stock Exchange. Moreover, the increase in the VIX affected the investors’ behavior more quickly, while the decline in the VIX affected investors more slowly. Kula and Baykut (2017) in like manner examined within the field of corporate governance also found the existence of a long-term relationship between the Borsa Istanbul corporate governance index and the VIX by using the ARDL boundary test. Additionally, Sarwan and Khan (2017) indicated that the VIX has a significant impact on the stock returns in case of the Latin American countries during all periods and that the increase of the VIX leads to decrease in stock returns.Upon considering the aforementioned extant studies, it can be generally inferred that the volatility in financial markets of one country affects the financial markets of other countries.
3. Data and Methodology
3.1 Data SeriesThe VIX (Volatility Index) and the RISE (Risk Appetite Index) data used in the study consist of 469 observations in weekly frequency over the period from January 2010 to December 2018. The VIX data is obtained from the Chicago Board of Exchange (CBOE) website. The RISE index data are calculated in weekly frequency separately for domestic investors, foreign investors, real domestic entities, domestic legal entities, domestic funds and qualified investors by The Central Securities Depository (CSD) of Turkey. In this study, the RISE index data calculated for all investors and the related data are obtained from The Central Securities Depository (CSD) of Turkey website (https://www.mkk.com.tr/).
3.2 Methodology
In this study, the VIX and the RISE index data to be used in the analysis are subjected to the structural unit root test of Zivot and Andrews (1992) along with the traditional unit root tests of Phillips and Perron (1988) and the extended Dickey-Fuller (ADF) developed by Dickey and Fuller (1981) firstly. Then, the causality test is applied according to the frequency distribution between variables, which was developed by Granger (1969) causality test and Breitung and Candelon (2006) study and based on the VAR model. Thus, the existence of the causality between the variables in the short-, medium- and long-run which could not be determined by Granger (1969) is tried to be detected.
Yule (1926) is one of the first studies that drew attention to stationarity analysis on macroeconomic data. Stationarity can be expressed as the fact that the mean of the time-series and its variance are time-independent. Nelson and Plosser (1982) stated that statistical methods could not be used in the evaluation of non-stationary time series. Traditional unit root tests commonly used in testing for stability are Philips and Perron, Dickey-Fuller and Extended Dickey-Fuller tests (Saraç et al., 2016). In the case of existing structural breaks, traditional unit root tests may reveal incorrect results. Therefore, unit root tests with structural breaks are used to determine whether or not there are structural breaks in the time-series. In this study, Zivot Andrews (1992) unit root test, the most commonly used unit root test with structural breaks in the literature, is also performed.
The sample size, the assumptions about unit root and stationarity tests, the hypotheses and the consequent results may result in differences between the tests. For instance, the ADF test can produce different results based on the level of statistical confidence level, the lag length and the sample size (Campbell and Perron, 1991). Balke and Fomby (1997) and Schwert (2002) stated that the sample size of the Philips and Perron tests reveal more accurate results for larger series. Nonetheless, it is stated that the sampling skewness due to the asymptotic distribution weakens the Philips and Perron test. Sample size problems encountered in the Philips and Perron test are also present in the KPSS test. These deficiencies of the relevant tests render the reliability of test results disputable (Saraç et al., 2016).
The Granger Causality test, which can be performed with stationary datasets, is based on testing of whether or not there is a reciprocal or unidirectional relationship between two datasets. In Granger (1969), causality is expressed as a measure of the likelihood that the past values of X are used for the anticipation of Y versus the case where the past values of X are not used. According to Granger (1988), if the use of past values makes the forecasting more successful, then X is the Granger cause of Y. Measurements in the relevant test are performed with F and Wald tests. Accordingly, four different results can be achieved with the Granger Causality test. These include the results indicating that X is the Granger cause of Y, or vice versa, where Y is the Granger cause of X or X and Y are reciprocally related to each other, and finally there is no reciprocal causality. Upon evaluation of this process, even though the Granger Causality test points out some results regarding the causality between series, the Wald and F tests used in the methodology may reveal a long-run relationship, whereas the short-term relationships may be ignored. In order to solve this problem, Geweke (1982), Hosoya (1991) and Yao and Hosoya (2000) proposed the measurement of causality for frequencies based on the decomposition of spectral density functions. Frequency domain causality is preferred since it allows Granger causality to be evaluated at different frequencies and is an easily applicable model because of being based on linear constraints (Yanfeng, 2012). The spectral density function, which constitutes the basis of frequency domain causality, can be expressed by the following equation (Kratschell and Schmidt, 2012).
( ) = 1
However, the problem of using the F test in the implementation of the relevant tests has been solved by applying the linear constraints proposed in Breitung and Candelon (2006). The Granger Causality test examines a single test statistic for the variables involved in the analysis. A nonlinear causality test is performed by the Frequency Domain Causality test. Granger causality at different frequencies is expressed by Geweke (1982) and Hosoya (1991) as in the following equation below.
→ ( ) =
2 ( )
| ( )| = 1 +
( )
| ( )| (2)
If ( ) = 0 according to the equality, a causality would be running from the y variable toward the x variable at any frequency (Ciner, 2011: 500). Breitung and Candelon (2006) proposed a new method for testing the null hypothesis suggesting that there is no causality.
If → ( ) = 0, ( ) = 0, then the following equation would be used:
( ) = ( ) and ( ) = − ( )
| ( )| (3)
denotes the lower diagonal element of matrix, whereas | ( )| stands for the determinant of ( ). Thus, the hypothesis suggesting that “ ” does not cause “ ” at frequency “ ” can be tested by courtesy of the following equation (Bodart and Candelon, 2009):
( ) = , cos( ) − , sin( ) = 0 (4)
( ) = 0 is the sufficient condition corresponding to the case where “ ”’ does not cause “ ” at frequency “ ”. The model brought forth by Breitung ve Candelon (2006) is based on the following linear restrictions.
, sin (kω) = 0
(6)
Upon simplification of the notations under these linear restrictions; = , and =
, , so that the VAR equation for can be written as follows:
= + ⋯ + + + ⋯ + +
(7)
Since the hypothesis → ( ) = 0 is equivalent to the linear restrictions, H0 can be written as follows:
H0: ( ) = 0 ( = , … , ) whereas ( ) can be estimated with the following equation: ( ) = cos ( ) sin ( ) cos (2 ) sin (2 ) … … cos ( ) sin ( ) (8)
Since the test method has (2, T-2p) degree of freedom and F-distribution for ∈ (0, ), the causality can be tested by standard F-test for H0 : ( ) = 0.
As a result of the literature review, the models and hypotheses (9) and (10) are developed to be tested depending on the following studies: Sarwar (2012); Ozair (2014); Sarwar and Khan (2017); Huang and Wang (2017).
The causality test between the VIX and the RISE is performed by testing the following models:
= + ∑ + ∑ + (9)
= + ∑ + ∑ + (10)
coefficients pertaining to the models (9) and (10) are tested. in models (9) and (10) ; = 0, ( = 1, 2, … , )
; ≠ 0
If is not rejected, there is a causality running from the VIX towards the RISE for Equation (9), and there is a causality running from the RISE towards the VIX for Equation (10). However, if is rejected, it is assumed that the causality relationship does not exist.
4. Findings and Discussion
Descriptive statistics of the relevant data are calculated before the causality analysis of the VIX and RISE data obtained in the study is performed. In Table 1, the descriptive statistics which shows the mean maximum, minimuma, skewness, kurtosis and the normality evidence by the Jarque-Bera statistics of the VIX and the RISE index datasets are presented.
Table 1: Descriptive Statistics
Variables Mean Maximum Minimum Stand. Deviation Skewness Kurtosis Jarque-Bera VIX 17.2595 44.25 9.22 5.8899 1.6460 6.4221 440.6433 (0.0000) RISE 43.3703 69.00 11.4069 11.4362 -0.2035 2.6515 5.6132 (0.0406) Values in parentheses indicate probability values.
Upon examining Table 1, it is seen that the fluctuation in the RISE dataset is higher than in the VIX dataset. As a matter of fact, Santis and İmrohoroğlu (1997) it is stated that the stock exchange volatility of developing countries tends to be higher than of the developed countries. In order to determine whether or not the VIX and the RISE index datasets are stationary, ADF and PP traditional unit root tests were employed. Additionally, the Zivot and Andrews (1992) structural unit root tests are performed such that the result of the unit root tests and the break dates are all presented in Table 2.
Table 2: Unit Root Test Results
Variables Test Type ADF t-stats. PP t-stats. Zivot Andrews t-stats. The break dates VIX Constant -4.3195* -4.8593* -5.6805* 11/28/2011 Constant and Trend -4.8019* -5.5821* -5.8383* 11/28/2011 VIX Constant -26.6084* -30.1794* -8.9446* 10/03/2011 Constant and Trend -26.5868* -30.4475* -9.1407* 10/03/2011 RISE Constant -9.4979* -9.5431* -9.7798* 1/16/2012 Constant and Trend -9.5001* -9.5483* -9.7809* 1/16/2012 RISE Constant -27.1226* -47.9431* -10.0275* 8/22/2014 Constant and Trend -27.0936* -47.8473* -10.0729* 8/22/2011
* significant at 1% significance level.
Upon examining Table 2, it is determined that all series are stationary, in other words, all datasets do not contain unit roots at 1% significance level according to the concentional ADF and PP unit root test results in addition to the Zivot Andrews structural unit root test results. In
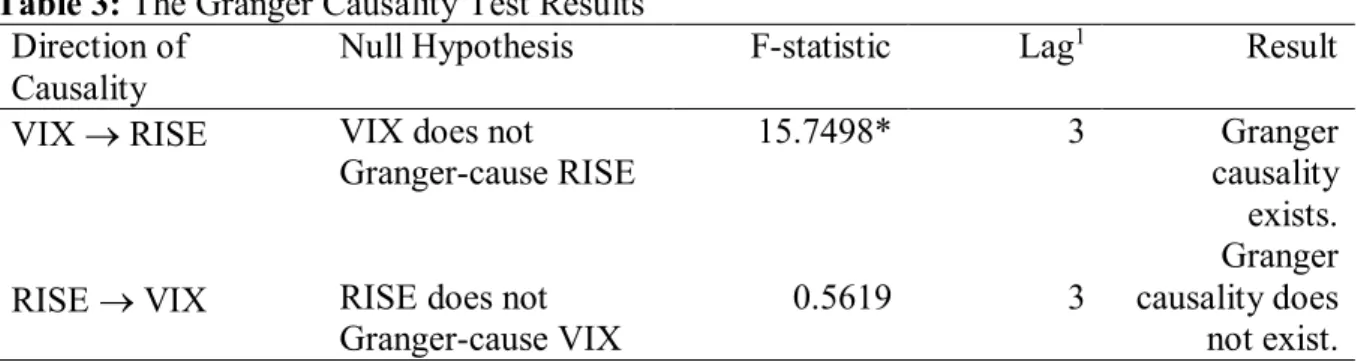
this context, it can be stated that the relevant series have a mean-reverting tendency. The mean reverting-tendency indicates that the related series can be estimated. Accordingly, the variance and the mean of the series are fixed over time, and causality analyses can be performed on the relevant series. Table 3 presents the test results of Granger causality between the VIX and the RISE index datasets.
Table 3: The Granger Causality Test Results Direction of
Causality
Null Hypothesis F-statistic Lag1 Result
VIX RISE VIX does not
Granger-cause RISE
15.7498* 3 Granger
causality exists.
RISE VIX RISE does not Granger-cause VIX
0.5619 3
Granger causality does not exist. 1 The lag lengths are determined according to Akaike information criteria.
* significant at 1% significance level.
Upon examining Table 3, the Granger causality test results indicate that there is a unilateral causality running from the VIX toward the RISE index at 1% significance level. According to the test results, the VIX Granger-causes the RISE index. In Table 4, Breitung and Candelon (2006) frequency domain causality test results are presented.
Table 4: Breitung Candelon Frequency Domain Causality Test Results Direction of
Causality
Long run Medium run Short run
w=0.1 w=0.5 w=1 w=1.5 w=2 w=2.5 VIX RISE 41.2039* 40.8666* 44.2138* 46.4060* 46.9216* 47.0629* RISE VIX 0.3979 0.1779 0.1396 1.0074 1.4039 1.5248
The lag lengths are selected according to Akaike information criteria. =0.5 corresponds to 13 – 14 weeks, and =2.5 corresponds to 2 – 3 weeks. * significant at 1% significance level.
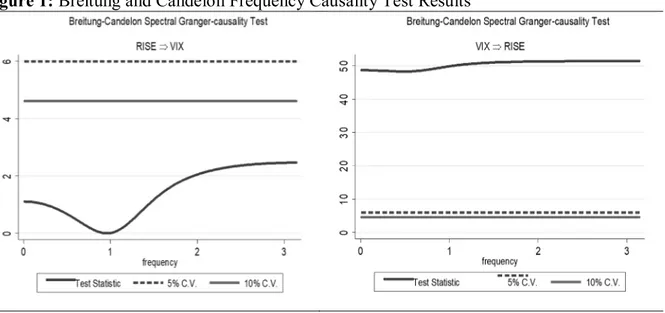
According to Breitung and Candelon (2006) Frequency Domain Causality test results, there is a long-, medium- and short-term causality relationships running from the VIX toward the RISE index. Nevertheless, it is found that the RISE index does not cause the VIX. The graphs that can be seen in different periods of analysis results are displayed in Figure 1.
Figure 1: Breitung and Candelon Frequency Causality Test Results
The horizontal axis indicates (0, π) frequency range and the vertical axis indicates the test values of Breitung and Candelon (2006). The truncated and straight lines parallel to the frequency axis represent the critical values at the 5% and 10% levels of significance, respectively. The first part of the graph indicates the causality running from the RISE index to the VIX. The test statistic value is below the critical value. In this case, there is no causality running from the RISE index toward the VIX. It is thought that the risk appetite index of a developing country does not result in a statistically significant causality on the global risk appetite index such as the VIX, and is also consistent with market expectations. The second part of the graph indicates the causality running from the VIX toward the RISE index. Since the test statistic value is above the critical value, there is causality for all computable frequencies running from the VIX toward the RISE index.
As a result of this study, in which the volatility spillover effect is tested using volatility indexes, the existence of the volatility spillover effect running from developed country-specific volatility indexes toward developing country-specific volatility indexes is detected. These results are similar to the previous studies on volatility and uncertainty dynamics as examined by Yu and Hassan (2008) Korkmaz and Çevik (2009), Kaya and Çoşkun (2015), Erdoğdu and Baykut (2016), Bajo-Rubio et al. (2017), and Akadiri, Alola & Uzuner (2019). This study differs from other studies on certain aspects such as that other studies usually examined whether on not the volatility spillover effect exists in the countries’ stock exchange indexes and whether or not the VIX is related to the volatility in the stock indexes of various countries, whereas the volatility spillover is examined based on the risk appetite indexes in this study. Accordingly, it can be said that throughout volatile VIX periods, the stakeholders may expect more intense
dividends. On this issue, Ismailescua and Kazemi (2011) stated that the stockholders could be protected with international diversification during periods of high volatility. In addition, as the VIX has an causal effect on the RISE in all periods, it can be suggested that in periods when the VIX is raised, investors may use more sophisticated active investment strategies instead of passive investment strategies which is also implied by Ratner ve Chiu (2017). As a matter of fact, Bleich et al., (2013) asserted that the change in the interest rate policy of central banks in times of high volatility might contribute to stability in national markets.
5. Conclusion and Policy Direction
The volatility spillover effect expressed as the impact of fluctuations in a country’s markets on other country’s markets is widespread, especially in financial markets. Also, there are studies in the literature conducted on the volatility spillover effect not only concerning financial markets but also commodity markets. In this context, there may be a similar interaction amongst the investors’ risk appetites. For this purpose, detecting whether or not the volatility between the global risk appetite index (the VIX) and the risk appetite indicator of the investors in Turkey (the RISE index) is contagion involves the subject of this study. In this context, it is aimed to determine whether or not the causal relationship between the VIX and the RISE index exists, and whether it is permanent or temporary in case such causality exists. Both Granger causality and Breitung and Candelon frequency domain causality analyses are applied in the study. According to Granger causality analysis results, a causal relationship running from the VIX toward the RISE index is found, whereas no causality running from the RISE index toward the VIX is found. According to the results of Breitung and Candelon causality analysis that is conducted to detect the existence of causal relationship at different frequencies, it is concluded that such causality is permanent, as there is a short-, medium- and long-term causality running from the VIX toward the RISE index.
5.1 Policy Direction
In the analysis results, it is suggested that the VIX is a parameter that must be followed by the stock exchange investors in Turkey and the investors who wish to invest in the stock markets in the short-, medium-, and long-run must make investment decisions concerning the VIX besides other parameters. In terms of market-makers such as the central bank, monitoring the VIX may contribute to the establishment of a preventive policy in order to eliminate the adverse impacts of the global crises on the global markets. As stated by Whaley (2008), monitoring of
the VIX, which is also accepted as a global crisis indicator, by the players who trade in financial markets would allow them to take positions in advance for the adverse situations they may face. Upon evaluating the results of the study in terms of stockholders, it is possible to claim that capital gains would be affected by the volatility of the VIX, whereas profit gains would be less affected. Performing similar analyses along with risk appetite indexes of other countries and the impact of risk appetite indexes on bond and futures markets would constitute the subjects of new studies to be conducted in the future.
References
Adam, K., Marcet, A., & Nicolini, J. P. (2016). Stock market volatility and learning. The
Journal of Finance, 71(1), 33-82.
Adhikari, B.K., and Hilliard, J.E. (2014). The VIX, VXO and Realized Volatility: A Test of Lagged and Contemporaneous Relationships. International Journal Financial Markets
and Derivatives, 3(3): 222–240.
Akadiri, S. S., Alola, A. A., & Uzuner, G. (2019). Economic policy uncertainty and tourism: evidence from the heterogeneous panel. Current Issues in Tourism, 1-8.
Allen, D. E., Amram, R., and McAleer, M. (2013). Volatility Spillovers From The Chinese Stock Market to Economic Neighbours. Mathematics and Computers in Simulation, 94:238-257.
Alola, U. V., Cop, S., & Adewale Alola, A. (2019). The spillover effects of tourism receipts, political risk, real exchange rate, and trade indicators in Turkey. International Journal of
Tourism Research, 21(6), 813-823.
Alola, A. A., & Uzuner, G. (2019). The housing market and agricultural land dynamics: Appraising with Economic Policy Uncertainty Index. International Journal of Finance &
Economics.
Bajo-Rubio, O., Berke, B., and McMillan, D. (2017). The Behaviour of Asset Return and Volatility Spillovers in Turkey: A Tale of Two Crises. Research in International Business
and Finance, 41: 577-589.
Balcilar, M., Gupta, R., Pierdzioch, C., & Wohar, M. E. (2018). Terror attacks and stock-market fluctuations: Evidence based on a nonparametric causality-in-quantiles test for the G7 countries. The European Journal of Finance, 24(4), 333-346.
Balke, N.S., and Fomby, T.B. (1997). Threshold Cointegration. International Economic
Review, 38(3): 627-645.
Balli, F., Hajhoj, H. R., Basher, S. A., and Ghassan, H. B. (2015). An Analysis of Returns and Volatility Spillovers and Their Determinants in Emerging Asian and Middle Eastern Countries. International Review of Economics & Finance, 39: 311-325.
Bašta, M., & Molnár, P. (2018). Oil market volatility and stock market volatility. Finance
Research Letters, 26, 204-214.
Baumöhl, E., Kočenda, E., Lyócsa, Š., and Výrost, T. (2018). Networks of Volatility Spillovers Among Stock Markets. Physica A: Statistical Mechanics and its Applications, 490: 1555-1574.
Baur, D., and Jung, R. C. (2006). Return and Volatility Linkages between The Us and The German Stock Market. Journal of International Money and Finance, 25(4): 598-613.
Baur, D. G., and Fry, R. A. (2009). Multivariate Contagion and Interdependence. Journal of
Asian Economics, 20(4): 353-366.
Bekaert, G., Engstrom, E., and Xing, Y. (2009). Risk, Uncertainty, and Asset Prices. Journal
of Financial Economics, 91(1): 59-82.
Black, F., and Scholes, M. (1973). The Pricing of Options and Corporate Liabilities. Journal of
Political Economy, 81(3): 637-654.
Bleich, D., Fendel, R., and Rülke, J. C. (2013). Monetary Policy and Stock Market Volatility.
Deutsche Bundesbank Discussion Paper, No: 45/2013: 1-8.
Bodart, V., and Candelon, B. (2009). Evidence of Interdependence and Contagion Using A Frequency Domain Framework. Emerging Markets Review, 10(2): 140–150.
Breitung, J., and Candelon, B. (2006).Testing for Short and Long-Run Causality: A Frequency Domain Approach. Journal of Econometrics, 132(2): 363–378.
Brunetti, C., Büyükşahin, B., & Harris, J. H. (2016). Speculators, prices, and market volatility. Journal of Financial and Quantitative Analysis, 51(5), 1545-1574.
Campbell, J. C., and Perron, P. (1991), Pitfall and Opportunities: What Macroeconomists Should Know About Unit Roots. NBER Technical Working Paper.
CBOE (2018), Chicago Board Options Exchange, available at http://www.cboe.com/vix. (Accessed 07 January 2018).
Chang, E. C., Cheng, J. W., and Khorana, A. (2000), An Examination of Herd Behavior in Equity Markets: An International Perspective. Journal of Banking & Finance, 24(10): 1651-1679.
Ciner, Ç. (2011) Eurocurrency Interest Rate Linkages: A Frequency Domain Analysis.
International Review of Economics and Finance, 20(4): 498–505.
Corrado, C. J., and Miller Jr, T. W. (2005). The Forecast Quality of CBOE Implied Volatility Indexes. Journal of Futures Markets, 25(4): 339-373.
Dickey, D.A., and Fuller, W.A. (1981). Likelihood Ratio Statistics for Autoregressive Time Series with a Unit Root. Econometrica, 49(4): 1057-1072
Du, X., Cindy, L. Y., and Hayes, D. J. (2011). Speculation and Volatility Spillover in The Crude Oil and Agricultural Commodity Markets: A Bayesian Analysis. Energy
Economics, 33(3): 497-503.
Dungey, M., Fry, R., González-Hermosillo, B., and Martin, V. (2006). Contagion in International Bond Markets during The Russian and the LTCM Crises. Journal of
Financial Stability, 2(1): 1-27.
Edwards, S., and Susmel, R. (2001), Volatility Dependence And Contagion in Emerging Equity Markets. Journal of Development Economics, 66(2): 505-532.
Ekşi, H.İ. (2011). Firmaların Banka Kredisi Kullanımında Güven Faktörünün Etkisi. Anadolu
Üniversitesi Sosyal Bilimler Dergisi, 11(2): 33-42.
Erdoğdu, H., and Baykut, E. (2016). BIST Banka Endeksinin (XBANK) VIX ve MOVE Endeksleri ile İlişkisinin Analizi. Bankacılar Dergisi, 98: 57-72.
Fernandes, M., Medeiros, M. C., and Scharth, M. (2014), Modeling and Predicting the CBOE Market Volatility Index. Journal of Banking & Finance, 40: 1-10.
Finta, M. A., Frijns, B., and Tourani‐Rad, A. (2017). Contemporaneous Spillover Effects Between The US and The UK Equity Markets. Financial Review, Vol.52 No.1, pp.145-166.
Fleming, J., Ostdiek, B., and Whaley, R. E. (1995). Predicting Stock Market Volatility: A New Measure. Journal of Futures Markets, 15(3): 265-302.
Fujii, E. (2005). Intra and Inter-Regional Causal Linkages of Emerging Stock Markets: Evidence from Asia and Latin America in and Out of Crises. Journal of International
Financial Markets, Institutions, and Money, 15(4): 315-342.
Gamba-Santamaria, S., Gomez-Gonzalez, J. E., Hurtado-Guarin, J. L., and Melo-Velandia, L. F. (2017), Stock Market Volatility Spillovers: Evidence for Latin America. Finance
Research Letters, 20: 207-216.
Giot, P. (2005). Relationships between Implied Volatility Indices and Stock Index Returns. Journal of Portfolio Management, 31(3): 92-100.
Graham, M., Nikkinen, J., & Peltomäki, J. (2019). Web-Based Investor Fear Gauge and Stock Market Volatility: An Emerging Market Perspective. Journal of Emerging Market
Finance, 0972652719877473.
Granger, C.W.J. (1969). Investigating Causal Relations by Econometric Models and Cross-Spectral Methods. Econometrica, 37(3): 424-438.
Granger, C.W.J. (1988). Some Recent Development in A Concept Of Causality. Journal of
Econometrics, 39(1–2): 199-211.
Geweke, J. (1982). Measurement of Linear Dependence and Feedback Between Multiple Time Series. Journal of the American Statistical Association, 77(378): 304-313.
Hao, J., and Zhang, J. E. (2013). GARCH Option Pricing Models, The CBOE VIX, and Variance Risk Premium. Journal of Financial Econometrics, 11(3): 556-580.
Haixia, W., and Shiping, L. (2013). Volatility Spillovers in China’s Crude Oil, Corn, And Fuel Ethanol Markets. Energy Policy, 62: 878-886.
Haugen, P. (2006), Financial Risk, Risk Appetite and The Macroeconomic Environment. Master Thesis of Science in Physics and Mathematics, Norwegian University.
Hosoya Y. (1991). The Decomposition and Measurement of The Interdependency Between Second-Order Stationary Processes. Probability Theory Relat Fields, 88(4): 429–444.
Hermosillo, G.B. (2008), Investor’s Risk Appetite and Global Financial Market Conditions.
International Monetary Fund Working Paper, No:08/85: 1-75.
Huang, T. C., and Wang, K. Y. (2017). Investors’ Fear and Herding Behavior: Evidence From The Taiwan Stock Market. Emerging Markets Finance and Trade, 53(10): 2259-2278.
Ismailescu, I., and Kazemi, H. (2011). Contagion or Interdependence in Emerging Debt Markets. The Banking and Finance Review, 3(2): 1-15.
Jawadi, F., Louhichi, W., and Idi Cheffou, A. (2015). Intraday Bidirectional Volatility Spillover Across International Stock Markets: Does The Global Financial Crisis Matter?. Applied
Economics, 47(34-35): 3633-3650.
Joshi, P. (2011). Return and Volatility Spillovers among Asian Stock Markets. Sage Journals
Open, 1(1), 1-8.
Jung, Y. C. (2016). A portfolio insurance strategy for volatility index (VIX) futures. The
Quarterly Review of Economics and Finance, 60, 189-200.
Kaminsky, G. L., and Reinhart, C. (2003). The Center and The Periphery: The Globalization
of Financial Turmoil, (No. w9479). National Bureau of Economic Research.
Kanas, A. (1998).Volatility Spillovers Across Equity Markets: European Evidence. Applied
Financial Economics, 8(3): 245-256.
Kanas, A. (2000). Volatility Spillovers Between Stock Returns And Exchange Rate Changes: International Evidence. Journal of Business Finance & Accounting, 27(3‐4): 447-467.
Kaya, A., Güngör, B., and Özçomak, M.S. (2014). Is VIX Indeks A Fear Indeks for Investors? OECD Countries Stock Exchange Example with ARDL Approach Roceedings of The First Middle East Conference on Global Business, Economics, Finance and Banking (ME14 DUBAI Conference) Dubai, 10-12 October 2014.
Kaya, A., and Çoşkun, A. (2015). VIX Endeksi Menkul Kıymet Piyasalarının Bir Nedeni midir? Borsa İstanbul Örneği. Cumhuriyet Üniversitesi İktisadi ve İdari Bilimler Dergisi, 16(1): 175-186.
Korkmaz, T., and Çevik, E. İ. (2009). Zımni Volatilite Endeksinden Gelişmekte Olan Piyasalara Yönelik Volatilite Yayılma Etkisi. Journal of BRSA Banking & Financial Markets, 3(2): 87-105.
Kratschell, K., and Schmidt, T. (2012). Long-Run Trends or Short-Run Fluctuations – What Establishes The Correlation Between Oil and Food Prices? Ruhr Economic Paper, 357: 3-19.
Kula, V., and Baykut, E. (2017). Borsa İstanbul Kurumsal Yönetim Endeksi (XKURY) ile Korku Endeksi (Chicago Board Options Exchange Volatility Index-VIX) Arasındaki
İlişkinin Analizi. Afyon Kocatepe Üniversitesi İktisadi ve İdari Bilimler Fakültesi
Dergisi, 19(2): 27-37.
Kumar, S. S. S. (2012). A First Look at the Properties of India’s Volatility Index. International
Journal of Emerging Markets, 7(2): 60–176.
Lee, S. J. (2009). Volatility Spillover Effects Among Six Asian Countries. Applied Economics
Letters, 16(5): 501-508.
Liow, K. H. (2015). Volatility Spillover Dynamics and Relationship across G7 Financial Markets. The North American Journal of Economics and Finance, 33: 328-365.
Liu, Y. A., and Pan, M. S. (1997). Mean and Volatility Spillover Effects in The US and Pacific-Basin Stock Markets. Multinational Finance Journal, 1(1): 47-62,
Merkezi Kayıt Kuruluşu (2015) Risk İştahı Endeksi, https://www.mkk.com.tr/risk-index, (09.01.2018)
Merton, R. C. (1973). Theory of Rational Option Pricing. The Bell Journal of Economics and
Management Science, 4(1): 141-183.
Nelson, C.R., and Plosser, C.R. (1982). Trends and Random Walks in Macroeconomic Time Series: Some Evidence and Implications. Journal of Monetary Economics, 10(2): 139-162.
Ng, A. (2000). Volatility Spillover Effects from Japan and the US to The Pacific–Basin. Journal
of International Money and Finance, 19(2): 207-233.
Ozair, M. (2014). What does the VIX Actually Measure? An Analysis of The Causation of SPX and VIX. ACRN Journal of Finance and Risk Perspectives, 3(2): 83–132.
Panagiotou, D. (2015). Volatility Spillover Effects in The Extra Virgin Olive Oil Markets of The Mediterranean.. International Journal of Food and Agricultural Economics, 3(3): 63-73.
Phillips, P.C.B., and Perron, P. (1988). Testing for a Unit Root in Time Series Regression.
Biometrika, 75(2): 335-346.
Rapach, D. E., Strauss, J. K., and Zhou, G. (2013). International Stock Return Predictability: What is The Role of The United States?, The Journal of Finance, 68(4): 1633-1662.
Ratner, M., and Chiu, C. C. J. (2017). Portfolio Effects of VIX Futures Index. Quantitative
Saint Akadiri, S., Alola, A. A., & Uzuner, G. (2019). Economic Policy Uncertainty and Tourism: Evidence from the Heterogeneous Panel.
Santis, G., and İmrohoroğlu, S. (1997). Stock Returns and Volatility in Emerging Financial Markets. Journal of International Money and Finance, 16(4): 561-579.
Saraç, T. B., İskenderoğlu, Ö., and Akdağ, S. (2016). Yerli ve Yabancı Yatırımcılara Ait Risk İştahlarının İncelenmesi: Türkiye Örneği. Sosyoekonomi, 24(30): 29-44.
Sarwar, G. (2012). Is VIX an Investor Fear Gauge in BRIC Equity Markets?, Journal of Multinational Finance Management. 22(3): 55–65.
Sarwar, G., and Khan, W. (2017). The Effect of US Stock Market Uncertainty on Emerging Market Returns. Emerging Markets Finance and Trade, 53(8): 1796-1811.
Schmukler, S. L., Zoido, P., and Halac, M. (2003). Financial Globalization, Crises, and Contagion, Globalization World Bank Policy Research Report.
Schwert, G.W. (2002). Tests for Unit Roots: A Monte Carlo Investigation. Journal of Business
& Economic Statistics, 20(1): 5-17.
Shaikh, I., and Padhi, P. (2014). The Forecasting Performance of Implied Volatility Index: Evidence From India VIX. Economic Change and Restructuring, 47(4): 251-274.
Shen, D. B., and Hu, K. H. (2007). Bank Risk Appetite Measurement and The Relationship With Macroeconomic Factors: Case of Taiwan’s Banks. International Journal of
Information Systems for Logistics and Management, 3(1): 25-39.
Ting, H. A. (2007). Fear in The Korea market. Review of Futures Markets, 16(1): 106-140.
Wang, J. (2007). Foreign Equity Trading and Emerging Market Volatility: Evidence from Indonesia and Thailand. Journal of Development Economics, 84(2): 798-811.
Wang, H. (2019). VIX and volatility forecasting: A new insight. Physica A: Statistical
Mechanics and its Applications, 533, 121951.
Whaley, R. E. (2000), The Investor Fear Gauge. The Journal of Portfolio Management, 26(3): 12-17.
Whaley, R. E. (2008). Understanding the VIX. Journal Of Portfolio Management. 35: 98–105. http://ssrn.com/abstract=1296743.
Yang, S. Y., and Doong, S. C. (2004). Price and Volatility Spillovers Between Stock Prices and Exchange Rates: Empirical Evidence from The G-7 Countries. International Journal of
Business and Economics, 3(2): 139-153.
Yanfeng, W. (2013). The Dynamic Relationships between Oil Prices and the Japanese Economy: A Frequency Domain Analysis. Review of Economics & Finance, 3: 57-67.
Yao, F., and Hosoya, Y. (2000). Inference on One-Way Effect and Evidence in Japanese Macroeconomic Data. Journal of Econometrics, 98(2): 225–255.
Yu, J. S., and Hassan, M. K. (2008), Global and Regional Integration of The Middle East and North African (MENA) Stock Markets. The Quarterly Review of Economics and
Finance, 48(3): 482-504.
Yule, G.U. (1926), Why do We Sometimes Get Nonsense-Correlations Between Time-Series?--A Study in Sampling and The Nature Of Time-Series. Journal of the Royal Statistical
Society, 89(1): 1-63.
Yunus, N. (2013). Contagion in International Financial Markets: A Recursive Cointegration Approach. Journal of Multinational Financial Management, 23(4): 327-337.
Zivot, E., and Andrews, D.W.K. (1992). Further Evidence on The Great Crash, The Oil Price Shock, and The Unit Root Hypothesis. Journal of Business and Economic Statistics, 10: 25–44.
Zou, H., and Sun, L. (2012). The Influence of Investor Sentiment on Stock Return and Its Volatility under Different Market States. Business Intelligence and Financial
Engineering (BIFE), 2012 Fifth International Conference on (pp. 337-341), IEEE,