Utilization of Biomass Fly Ash for Improving Quality of Organic
Dye-Contaminated Water
Safana Dogar, Sana Nayab, Muhammad Qamar Farooq, Amir Said, Raheel Kamran, Hatice Duran,
*
and Basit Yameen
*
Cite This:ACS Omega 2020, 5, 15850−15864 Read Online
ACCESS
Metrics & More Article Recommendations*
sı Supporting InformationABSTRACT: Development of innovative methodologies to convert biomass ash into useful materials is essential to sustain the growing use of biomass for energy production. Herein, a simple
chemical modification approach is employed to functionalize
biomass fly ash (BFA) with 3-aminopropyltriethoxy silane
(APTES) to develop an inexpensive and efficient adsorbent for
water remediation. The amine-functionalized BFA (BFA−APTES)
was fully characterized by employing a range of characterization
techniques. Adsorption behavior of BFA−APTES was evaluated
against two anionic dyes, namely, alizarin red S (ARS) and bromothymol blue (BTB). In the course of experimental data
analysis, the computation tools of data fitting for linear and
nonlinear form of Langmuir, Freundlich, and the modified
Langmuir−Freundlich adsorption isotherms were used with the aid of Matlab R2019b. In order to highlight the misuse of
linearization of adsorption models, the sum of the squares of residues (SSE) values obtained from nonlinear models are compared
with R2values obtained from the linear regression. The accuracy of the data fitting was checked by the use of SSE as an error
function instead of the coefficient of determination, R2. The dye adsorption capacity of BFA−APTES was also compared with the
nonfunctionalized BFA. The maximum adsorption capacities of BFA−APTES for ARS and BTB dye molecules were calculated to be
around 13.42 and 15.44 mg/g, respectively. This value is approximately 2−3 times higher than the pristine BFA. A reasonable
agreement between the calculated and experimental values of qe obtained from the nonlinear form of kinetic models verified the
importance of using equations in their original form. The experimentally calculated thermodynamic parameters including molar
standard Gibbs free energy (ΔadGm0) and molar standard enthalpy change (Δ
adHm0) reflected that the process of adsorption of dye
molecules on the BFA−APTES adsorbent was spontaneous and exothermic in nature. Moreover, the used BFA−APTES adsorbent
could be regenerated and reused for several cycles with significant dye adsorption capacity. The remediation capability of the BFA−
APTES adsorbent against ARS dye was also demonstrated by packing a small columnfilled with the BFA−APTES adsorbent and
passing a solution of ARS through it. Overall, we provide a simple and scalable route to convert BFA into an efficient adsorbent for
water remediation applications.
1. INTRODUCTION
Human population has increased by more than 50% in the past 5 decades, and according to an estimate by World Population Clock, there are about 7.78 billion humans living on planet Earth as of May 2020. Increase in population increases the demand of resources that are necessary to sustain the ever-improving standard of living. Besides increase in the demand of several other resources, energy demand is on a continuous rise. Electricity constitutes an important part of the global energy demand. According to International Energy Agency (IEA), the total gross electricity production was 26,700 TWh in 2018, which is about 3.8% higher than gross energy production during 2017. Despite much debated negative environmental
effects associated with the use of coal, it is still the largest
contributor to the global electricity generation. Recently, plant
biomass is gaining popularity as the thermal source of electricity because of its low cost and availability in large quantities particularly as agricultural residues. In addition, the plant biomass is considered as a renewable and carbon neutral
source of electricity because the CO2 produced during the
combustion of plant biomass in thermal power stations can be reused by the plants in the process of photosynthesis to
generate more biomass.1,2
Received: February 28, 2020
Accepted: June 4, 2020
Published: June 22, 2020
Article
http://pubs.acs.org/journal/acsodf
copying and redistribution of the article or any adaptations for non-commercial purposes.
Downloaded via TOBB UNIV OF ECONOMICS & TECHNOLOGY on January 25, 2021 at 08:30:56 (UTC).
Combustion of coal and biomass in thermal power stations results in the generation of huge amounts of ash residues. It has been conservatively estimated that about 750 million tons of coal ash and about 480 million tons of biomass ash are
globally produced every year.3−8 Major portion of these ash
residues ends up in landfills with a potential of inflicting serious
environmental risks. Finding recycling technologies to mitigate the environmental impacts of ash residues is a formidable challenge and an interesting opportunity at the same time. With the widespread use of coal as the fuel in thermal power stations, bulk of the research work on management and utilization of ash residues is focused on the ash produced from the combustion of coal. The ash residues produced during the
combustion of coal and biomass show markedly different
physiochemical natures. Coal ash generally consists of spherical-shaped particles. The chemical composition of coal fly ash depends on the type of coal (bituminous, sub-bituminous, or lignite) used during the combustion process. Based on the chemical composition of the coal ash, the American Society of Testing and Material (ASTM C618) categorizes the coal ash residues into two main classes: Class F and Class C. In the case of Class F ash residues, the combined
SiO2, Fe2O3, and Al2O3 contents constitute >70%, and these
residues are low in lime content. The SiO2, Fe2O3, and Al2O3
contents of Class C ash residues are between 50 and 70%, and
these residues are rich in lime content.9On the other hand, the
biomass ash residues are generally classified as fly ash and
bottom ash. Thefly ash consists of fine particles that rise with
theflue gases, while the bottom ash consists of relative larger
particles and are collected at the bottom of the furnace. Both types of biomass ash residues consist of irregular-shaped
particles. SiO2is the major component of the bottom ash along
with the varying concentrations of other constituents including
Al2O3, Fe2O3, CaO, K2O, Na2O, and MgO. Fly ash on the
other hand can consist of large percentages of plant nutrients including K along with the constituents found in the bottom
ash. The chemical composition of fly ash residues shows
relatively larger variations in its chemical constituents. The
variations in chemical compositions of fly ash residues stem
from the fact that biomass thermal power station can use a
mixture of different types of agricultural biomasses (e.g., wheat
straw, rice husk, and corn stakes to name a few) with different
percentage contributions of each type in the actual feed.8,10
With the growing understanding of the physiochemical natures of the ash residues, the scientific community across the
world is investing serious efforts in finding new avenues for
recycling of ash residues. Because of their pozzolanic and cementitious properties, coal ash residues have become an attractive material for cement and construction industry.
Recent efforts for expanding the application profile of coal
fly ash have revealed the potential of coal fly ash residues as functional materials for application in environmental remedia-tion and catalysis. Several studies are available that highlight
the efficiency of coal fly ash and materials derived from it (e.g.,
organocomposites and porous materials including zeolites, mesoporous silica) as adsorbents for removal of dyes, toxic metal ions, radioactive pollutants, organic pollutants such as benzene, toluene, and o- and p-xylene, gaseous pollutants such
as CO2, H2S, and SO2as well as support material for catalysts,
photocatalysts, and electrocatalysts.6,11−20 Because of their
distinct chemical nature, biomass ash residues do not show pozzolanic and cementitious properties; however, the potential
of biomass ash as part of cement mortar21−26 is widely
investigated. Besides, the potential of biomass fly ash (BFA)
for other applications is also being explored. Reports from Guo et al. and Rafael López et al. have recently demonstrated the
potential of BFA for capturing of CO2.27,28In a related effort,
Fernández-Delgado Juárez et al. successfully applied wood ash
for removal of CO2 and H2S and purification of biogas.29In
another study, BFA was applied as the adsorbent to remove
lignin from effluents generated during the kraft pulping
process. Thefly ash adsorbent was also found to reduce the
chemical oxygen demand and turbidity of effluents.30 In the
same vein, Novais et al. have demonstrated the efficiency of
BFA-derived geopolymer spheres and monoliths for removal of
methylene blue from aqueous solutions.31,32
It is worth mentioning here that majority of the reported work do not consider rationally controlling the surface chemical properties of ash residues to modulate their remediation properties. In the context of application of BFA
for capturing of CO2, attempts have been made to introduce
amine groups by the simple wet impregnation method.33,34
The wet impregnation method is a convenient way of introducing certain functional groups in ash residues; however, the application of materials developed through this method is limited to capturing of gaseous pollutants. Surface chemical properties of materials can be conveniently and robustly controlled by anchoring appropriate organosilanes on their
surface, a process designated as silanization.35−37 In some
studies, organosilanes have been applied to modify the surface
chemical nature of coalfly ash for their better integration as
fillers in composite materials.38−40
However, to the best of our knowledge, no attempts have been made to apply the process
of silanization for imparting specific functional group on the
surface of BFA and apply them for remediation of dye-contaminated aqueous solutions. Herein, we report a convenient silanization method for anchoring amine groups on the surface of BFA by using 3-aminopropyltriethoxysilane (APTES). The resulting amine-functionalized BFA was applied as the adsorbent for remediation of dye-contaminated water solutions. The remediation characteristics of
amine-function-alizedfly ash were compared with the pristine fly ash. Special
attention is given to emphasize the importance of application of isotherm models in the nonlinear form and correct statistical
method (usage of SSE instead of R2) as a corrective measure
for adsorption studies because linearization may cause malpractice.
2. RESULTS AND DISCUSSION
Scheme 1 depicts the surface chemistry of BFA surface
functionalization during activation and APTES modification.
According to BET analysis, the specific surface areas of the
A-Scheme 1. Schematic Illustration of the Surface Functionalization of BFA with APTES
BFA and BFA−APTES were calculated to be 95.72 and 8.15
m2g−1, while pore volumes were 0.071 and 0.015 cm3g−1and
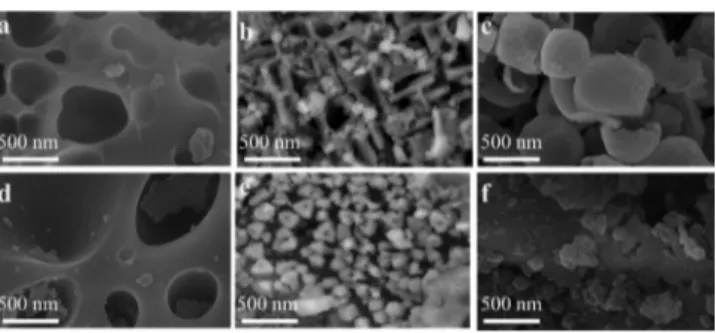
pore diameters were 1.697 and 1.061 nm, respectively. The scanning electron microscopy (SEM) imaging was used to reveal the morphology of A-BFA before and after
functionalization with APTES (Figure 1). A-BFA and BFA−
APTES displayed heterogeneous surface characteristics with macropores (diameter >50 nm) and particles with a range of
different sizes (from 20 to 500 nm) and morphologies. Even
some of the particles were found to be mesoporous in nature.
Micropore size was not affected by surface treatment (Figure
1a,d), while there was almost one order of magnitude decrease
in the particle size (Figure 1c,f). This drastic reduction in
particle size may influence the kinetic parameters of
adsorption.41
The surface chemical composition of A-BFA before and after silanization was monitored by X-ray photoelectron
spectros-copy (XPS) analysis (Figure 2). The survey scan of A-BFA and
BFA−APTES showed signals at 150 and 100 eV, which
correspond to the binding energies of Si 2s and Si 2p orbitals of the Si component of BFA. The signals for the C 1s and O 1s orbitals of the carbon and oxygen contents of A-BFA and
BFA−APTES were evidenced by the signals at 284 and 530
eV. The C 1s signal in the survey scan of A-BFA can be attributed to the unburnt carbon component of BFA. The appearance of the N 1s orbital signal at 400 eV in the XPS
survey scan of BFA−APTES validated the functionalization of
BFA with APTES. The survey scan of A-BFA did not show any
signal for nitrogen, confirming that the N 1s signal in the
survey scan of BFA−APTES is originating from the amino
groups decorated on the surface of BFA during the process of silanization with APTES.
Thermogravimetric analysis (TGA) was performed to quantify the extent of surface functionalization of A-BFA
with APTES (Figure 3). Both ash residues were dried in an
oven before subjecting to TGA. The 7.2% total weight loss observed in the case of A-BFA can be attributed to the loss of any absorbed water molecules and the unburnt carbon content
of A-BFA. The TGA thermogram of BFA−APTES showed a
total weight loss of 9.4%, which is 2.2% higher than the weight loss observed in the case of A-BFA. The additional weight loss
observed in the case of BFA−APTES can be considered as the
amount of APTES functionalized on the surface of A-BFA. From this analysis, it can be inferred that every 100 g of the
BFA−APTES sample contains 2.2 g of APTES functionality in
it. Furthermore, it can be concluded that each portion of 100 g
of BFA−APTES offers 0.033 moles of −NH2 groups. The
percentage weight loss after functionalization with silane
monolayers is generally in the range of 1−2 wt %. Comparing
with our previously reported work,42,43the weight loss of 2.2
wt % observed in this study is reasonably reliable. Combining
TGA and BET (8.15 m2/g) data suggests that 2.7 mg (1.22×
10−5mole) of APTES is spread per m2of the adsorbent, which
translates into 7.35× 10¹⁸molecules of APTES grafted per m2
of BFA−APTES.
After successful functionalization of BFA with APTES, supported by the XPS surface chemical analysis and TGA, the
adsorption properties of A-BFA and BFA−APTES were
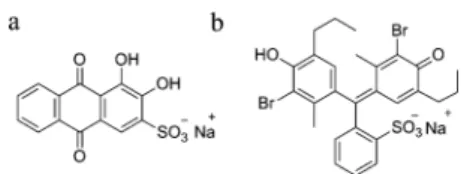
investigated against two anionic dyes, namely, alizarin red S
(ARS) and bromothymol blue (BTB) (Figure 4). ARS,
Figure 1.SEM images revealing particles of variety of different sizes and morphologies in A-BFA (a−c) and BFA−APTES (d−f).
Figure 2.XPS survey scans of (a) A-BFA and (b) APTES-functionalized BFA.
Figure 3. TGA of A-BFA and APTES-functionalized BFA (BFA− APTES).
anthraquinone dye, is used as a staining agent in textile
industries.44In addition, this dye is also used to stain biological
specimens, such as mineralized bones in vertebrate groups and
small invertebrate embryos.45 ARS cannot be completely
degraded by general chemical, physical, and biological
processes.46 This resistance to degradation is attributed to
the complex structures of the aromatic rings that afford high
physicochemical, thermal, and optical stability.47 BTB, a
triphenylmethane dye, is also frequently used for dyeing in
the textile industry.48It has the potential of causing damage to
lungs and mucous membranes.49Prolonged exposures to
BTB-contaminated water may even lead to organ damage.50 A
review of the recent literature shows that BTB has been
employed in the development of pH sensors as well.51,52These
considerations laid the basis of our choice of ARS and BTB as model dye contaminants.
2.1. Effect of pH. The nature and magnitude of overall
electrostatic charge on the interacting adsorbent and adsorbate
system determine the capacity and efficiency of the process of
remediation. In case of materials bearing functional groups (e.g., amines, carboxylic acid, sulfonic acid, phosphonic acid, or zwitterionic groups) that can undergo protonation or deportation, a change in the pH of the surrounding medium can lead to a change in the nature and magnitude of the
electrostatic charge on the material.53−55 Consequently, the
change in pH of the medium can impact the capacity and
efficiency of the process of remediation, which makes it
necessary to evaluate the impact of pH of the medium on the
capacity and efficiency of the process of remediation. The
effect of pH on the adsorption capacity of A-BFA and BFA−
APTES as adsorbent toward the employed dyes was determined by performing adsorption studies in the pH
range of 2−12 (Figure 5). The pH of dye solutions was
adjusted by using 0.1 M aqueous sodium hydroxide and 0.1 M aqueous hydrochloric acid solutions. Twenty milligrams of
A-BFA and A-BFA−APTES adsorbents was separately added to 10
mL of dye solutions (15 ppm for ARS and 10 ppm for BTB) and shaken at room temperature for an optimized period of
time (t = 10 min for ARS, and t = 5 min for BTB). The
adsorption capacity of BFA−APTES was found to increase as
the pH of the solutions was increased from 2, and the maximum adsorption against both the dyes was obtained at pH 4 (percentage removal: 91% for ARS and 96% for BTB). However, a further increase in the pH of the medium resulted in a decrease in the adsorption capacity. For instance, the
adsorption of BTB on BFA−APTES showed an abrupt
reduction in adsorption with increasing pH, from 96% (pH
4) to 5% removal (pH 8) (Figure 5b). The high adsorption
capacity of BFA−APTES at acidic pH can be attributed to the
higher magnitude of positive charge on its surface because of the protonation of surface amino groups. Hence, the positive
charge on the surface of BFA−APTES at acidic pH facilitated
in enhancing its electrostatic interaction with the polar groups
of the anionic dyes ARS (pKa= 5.49 and 10.85) and BTB (pKa
= 7.3). A slightly lower percentage removal observed at pH 2 compared to pH 4 can be attributed to a higher extent of protonation of sulfonic acid groups resulting in the reduction in net negative change on the dye molecules that led to a
reduced electrostatic interaction between BFA−APTES and
the dye molecules. Decrease in the adsorption capacities at pH 6 and above can be related to the decrease in the extent of protonation of amino groups, leading to the decrease in the
magnitude of surface positive change on BFA−APTES and
increase in the extent of the deprotonation of sulfonic acid groups that leads to an increased negative charge on the dye molecules. The deprotonation of functionalities at higher pH results in an increase in the electrostatic repulsion between the exposed lone pair of electrons of amino groups on BFA− APTES surface and negative charge on the dye molecules, which manifests in the form of decrease in the adsorption
capacity of BFA−APTES. Performing the adsorption studies at
pH 4 would protonate all the functional groups of the anionic dyes. This suggests that the adsorption process seems to be primarily driven by the extent interaction between the protonated surface amino groups of BFA−APTES and polar groups present in the dye molecules.
The adsorption behavior of A-BFA against both dyes was completely different. A-BFA is microporous and contain many −OH groups on the surface. It is well known that the free
vibrating−OH groups are strong adsorption sites, particularly
with lone pair adsorbates (such as SO3, O and Br groups).
56
Each−OH group acts as a specific adsorption site for aromatic
groups of dye molecules resulting in some degree of adsorption
(40−45%) at pH between 2 and 6 for both dyes. However,
Figure 4.Chemical structures of anionic dyes: (a) ARS (b) BTB.
Figure 5.Effect of pH on the %age removal of (a) ARS (t = 10 min, amount of adsorbents = 20 mg, at room temperature); (b) BTB (t = 5 min, amount of adsorbents = 20 mg, at room temperature).
small adsorption of ARS at higher pH (>7) may be because of
nonspecific adsorption into mesopores. There is also the
capillary effect. Because BTB is a relatively large molecule, it
might not reach the mesopores; hence, a very limited adsorption was observed at higher pH values. A comparison
of the adsorption capacities of BFA−APTES and A-BFA
clearly highlights superior adsorption capacity for BFA−
APTES (Figure 5), which stems from the lack of any amino
groups on the surface of nonfunctionalized BFA.
2.2. Effect of Amount of Adsorbent. The effect of
amount of adsorbent on the removal capacity of dye was
investigated by varying the amounts of A-BFA and BFA−
APTES adsorbents (5, 10, 15, 20, 25, and 30 mg). For this purpose, specific amounts of adsorbents were added in 10 mL dye solutions (15 ppm for ARS and 10 ppm for BTB) at room temperature with optimized pH and contact time (pH = 4, t = 10 min for and pH = 4, t = 5 min for BTB). For both dyes,
BFA−APTES exhibited higher adsorption capacity as
compared to the A-BFA (Figure 6). For 20 mg of adsorbent,
the %age removal of ARS dye was found to be 91%, when
BFA−APTES was used as the absorbent, which is ∼2.5 times
higher than the % age removal of 37%, when nonfunctionalized BFA was used as the adsorbent. Similarly, employing 20 mg of
adsorbent, the BFA−APTES adsorbent showed ∼2.9 times
higher %age removal toward BTB dye (96% removal) when compared to the nonfunctionalized BFA (33% removal) employed as an adsorbent. Compared to the nonfunctionalized
BFA, the superior adsorption capacity of BFA−APTES can be
attributed to the presence of amino groups present on the
surface of BFA−APTES. Although a slight increase in the
percentage adsorptions was observed at adsorbent amounts higher than 20 mg, the subsequent adsorption studies were
carried out using 20 mg of adsorbents for the sake of simplicity
and process efficiency.
2.3. Effect of Contact Time. In order to determine the
optimum time required for the maximum uptake of dye by the
BFA−APTES adsorbent, the effect of contact time on the
adsorption of dyes was studied for different time intervals
ranging from 5 to 30 min (Figure 7). Twenty milligrams of
A-BFA and A-BFA−APTES adsorbents were added to 10 mL of
aqueous solutions of dyes (15 ppm for ARS and 10 ppm for BTB), and the suspension was shaken at room temperature for a set interval of time. With the increase in contact time, an increase in the uptake of dyes was observed for both adsorbents. Percentage adsorption of ARS was observed to
be around 91% for BFA−APTES and 37% for BFA after a
contact time of 10 min, whereas the percentage adsorption of
BTB reached 96% for BFA−APTES and 33% for A-BFA after 5
min of exposure to the respective adsorbents. A further increase in the contact time did not result in any appreciable increase in the removal percentage, and for the sake of process
simplicity and efficiency, all the subsequent adsorption studies
were performed using contact times of 10 min for ARS and 5 min for BTB.
2.4. Effect of Initial Concentration of Dyes. A given
amount of adsorbent has the capacity to adsorb only a certain amount of adsorbate species. Thus, the initial concentration of the adsorbate solution plays an important in the adsorption
process. To investigate the effect of initial concentration of
dyes on the removal capability of adsorbents, the adsorption
experiments were carried out at different initial concentrations
of dyes (ARS and BTB). Twenty milligrams of A-BFA and
BFA−APTES adsorbents were added to 10 mL of dyes
solutions (10, 20, 30, 40, and 50 mg L−1), and the suspensions
Figure 6.Effect of the amount of adsorbent on the % age removal of (a) ARS (pH = 4, t = 10 min, at room temperature) and (b) BTB (pH = 4, t = 5 min, at room temperature). The solid lines are drawn to highlight the trend.
Figure 7.Effect of contact time on the % age removal of (a) ARS (adsorbents = 20 mg, pH = 4 at room temperature); (b) BTB (amount of adsorbents = 20 mg, pH = 4 at room temperature). The solid lines are drawn to highlight the trend.
were shaken at room temperature for an optimized period of time (t = 10 min for ARS, and t = 5 min for BTB). As apparent fromFigure 8, the % age removal of ARS and BTB by both the adsorbents decreased with increasing the initial concentration of dyes. This trend can be attributed to the saturation of the active sites for adsorption on the adsorbent surface at higher concentrations of dyes.
2.5. Effect of Temperature. Influence of temperature on
the adsorption properties of A-BFA and BFA−APTES as
absorbents was investigated at different temperatures (298, 308, 318, 328, and 338 K). Both the adsorbents (20 mg adsorbent, pH = 4, t = 10 min for ARS, and 20 mg adsorbent, pH = 4, t = 5 min for BTB) were added to 10 mL of aqueous dye solutions (15 ppm for ARS and 10 ppm for BTB). As it is
evident fromFigure 9, an increase in temperature within the
temperature range studied did not have a significant impact on
the adsorption capacities of BTB on both A-BFA and BFA−
APTES and ARS on BFA−APTES. Weakening of electrostatic
interactions between dye molecules and active adsorbent sites at higher temperature could be the main contributor toward the slight decrease in adsorption capacity observed at higher
temperatures.57 A slight increase observed in the case of
adsorption of ARS on A-BFA can be because of a better dispersion of the adsorbent and the availability of more
binding sites at higher temperature.58 The change in the
adsorption of ARS on BFA−APTES remains within the
experimental error limits.
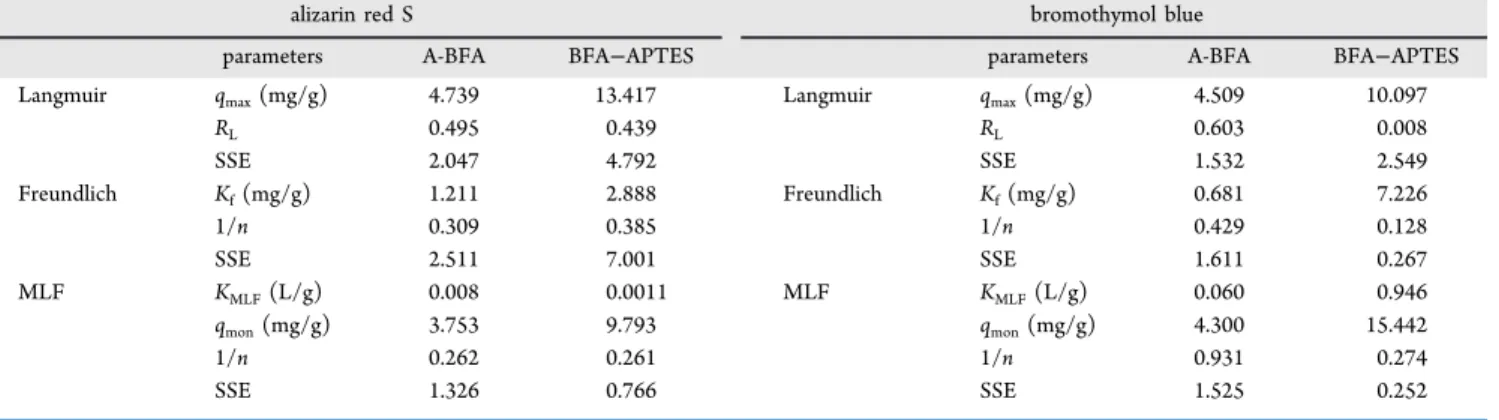
2.6. Adsorption Isotherms. Figure 10 shows both
experimental data and nonlinear curvefits for two-parameter
and three-parameter models. A comparison of the three
isotherms based on SSE values (Table 1) showed that the
adsorption of ARS and BTB on BFA−APTES and A-BFA is
better estimated by the modified Langmuir−Freundlich
(MLF) isotherm. However, R2 values of the linearized
Langmuir isotherm are 0.981 and 0.998, while SSE values
are 4.792 and 2.548 for ARS and BTB adsorption on BFA−
APTES, respectively. Consequently, comparison between Tables 1 and 2 clearly shows that the use of the R2 value
can be misleading in determining the correct isotherm. Besides,
adsorption data of large dye molecules cannotfit to Langmuir
because impediments exist between pores and adsorbate;
therefore, the value of n is usually less than 1.59The maximum
adsorption capacities of BFA−APTES for ARS and BTB dye
molecules were calculated as 13.42 and 15.44 mg/g, respectively. Meanwhile, the maximum adsorption capacities
Figure 8.Effect of initial concentration of (a) ARS (adsorbents = 20 mg, pH = 4, contact time = 10 min, at room temperature); (b) BTB (amount of adsorbents = 20 mg, pH = 4, contact time = 5 min, at room temperature) on the % removal by A-BFA and BFA−APTES adsorbents. The solid lines are drawn to highlight the trend.
Figure 9.Effect of temperature on the parentage removal of (a) ARS (amount of adsorbents = 20 mg, pH = 4, contact time = 10 min); (b) BTB (amount of adsorbents = 20 mg, pH = 4, contact time = 5 min). The solid lines are drawn to highlight the trend.
Figure 10.Adsorption isotherms and nonlinear curvefits of Langmuir (black solid line), Freundlich (blue dash line), and MLF (black dots) for ARS-BFA APTES (red circle solid), ARS-A BFA (dark blue hexagon solid), BTB−BFA APTES (orange triangle up solid), and BTB−ABFA (green tilted square solid), respectively.
of A-BFA were 2−3 times less than BFA−APTES for both
dyes (Table 1).
For the sake of comparison, adsorption characteristics of the adsorbents reported in this study were compared with the
related adsorbents reported in the literature.Table 3 gives a
simple comparison of the adsorption ability offly ash-derived
adsorbent materials for the adsorption of dyes. It is evident from Table 3 that the adsorbents reported in this study
exhibited higher adsorption efficiency compared to similar
adsorbents, while the adsorption capacities of the absorbents reported in this study were comparable to some of the adsorbents reported in the literature.
The adsorption density (Γ, mg/m2) or the amount of dyes
adsorbed on the active surface of adsorbents at a particular
concentration was calculated by using following equation68
V C mS
Γ = Δ
(1)
where V is the volume of liquid phase (L),ΔC is the difference
between the initial and final concentrations of adsorbates in
aqueous solution, m is the mass of adsorbent (g), and S is the
surface area (m2/g). Using this relation, the adsorption density
or the amount of dyes adsorbed on the active surface of adsorbents at a particular residual concentration can be calculated. The adsorption density of ARS and BTB per unit Table 1. Adsorption Parameters Obtained from Nonlinear Langmuir, Freundlich, and MLF Isotherm Models at Room
Temperature for the Adsorption of ARS and BTB on A-BFA and BFA−APTES
alizarin red S bromothymol blue
parameters A-BFA BFA−APTES parameters A-BFA BFA−APTES
Langmuir qmax(mg/g) 4.739 13.417 Langmuir qmax(mg/g) 4.509 10.097
RL 0.495 0.439 RL 0.603 0.008 SSE 2.047 4.792 SSE 1.532 2.549 Freundlich Kf(mg/g) 1.211 2.888 Freundlich Kf(mg/g) 0.681 7.226 1/n 0.309 0.385 1/n 0.429 0.128 SSE 2.511 7.001 SSE 1.611 0.267 MLF KMLF(L/g) 0.008 0.0011 MLF KMLF(L/g) 0.060 0.946 qmon(mg/g) 3.753 9.793 qmon(mg/g) 4.300 15.442 1/n 0.262 0.261 1/n 0.931 0.274 SSE 1.326 0.766 SSE 1.525 0.252
Table 2. Adsorption Parameters Obtained from Linearized Langmuir, Freundlich, and MLF Isotherm Models at Room
Temperature for the Adsorption of ARS and BTB on A-BFA and BFA−APTES
alizarin red S bromothymol blue
parameters BFA BFA−APTES parameters BFA BFA−APTES
Langmuir qmax(mg/g) 3.762 13.791 Langmuir qmax(mg/g) 4.590 10.761
RL 0.364 0.511 RL 0.640 0.042 R2 0.720 0.981 R2 0.712 0.998 Freundlich Kf(mg/g) 0.601 1.663 Freundlich Kf(mg/g) 0.595 6.761 1/n 0.518 0.582 1/n 0.467 0.117 R2 0.863 0.782 R2 0.563 0.954 MLF KMLF(L/mg) 0.191 0.790 MLF KMLF(L/g) 1.378 28.506 qmon(mg/g) 407.498 4911.640 qmon(mg/g) 0.737 10.462 n 4.633 2.678 n 0.584 0.992 R2 0.963 0.839 R2 0.442 0.997
Table 3. Comparison of Adsorption Characteristics of Adsorbents Derived from Various Fly Ash-Based Adsorbents sr.
no adsorbents dyes
adsorption capacity qmax
(mg/g) time references
1 coalfly ash reactive red 23, reactive blue 171, acid black 1, and acid blue 193
2.102, 1.860, 10.331, and 10.937
60 min 60
2 coalfly ash methylene blue 15.04 120 min 61
3 magnetic chitosan-fly ash (CS-FA/Fe3O4) reactive orange 16 (RO16) 66.9 55 min 62
4 coalfly ash (CFA) methylene blue 6.409 60 min 63
5 fly ash (FA) modified by Ca(OH)2/Na2FeO4 methyl orange 14.76 40 min 64
6 fly ash/NiFe2O4composite congo red 23.33 180 min 65
7 fly ash geopolymer monoliths methylene blue 15.4 30 h 66
8 magnesium oxide (MgO)/fly ash composite (FAMgO)
RB5 azo dye 48.78 90 min 67
9 BFA−APTES bromothymol blue 15.44 5 min current
Study
10 BFA−APTES alizarin red S 13.42 10 min current
surface area of APTES−BFA was found to be 0.306 and 0.608
mg/m2. Interestingly, these grafting densities translate into
5.11× 10¹⁷and 6.56× 10¹⁷molecules of ARS and BTB per m2
of the adsorbent (BFA−APTES). The number of dye
molecules per unit area are slightly less than the number of APTES molecules that were estimated to be grafted on the
surface (7.35× 10¹⁸molecules) which can be because of the
steric bulk of the dye molecules that need more surface area while adsorbing on the surface. With this data, we can conclude that the surface of the adsorbent is reasonably saturated.
Table 4 gives a comparison of the amount of adsorbent
adsorbed per unit surface area of different adsorbent materials
reported in the literature and the adsorbent reported in this study.
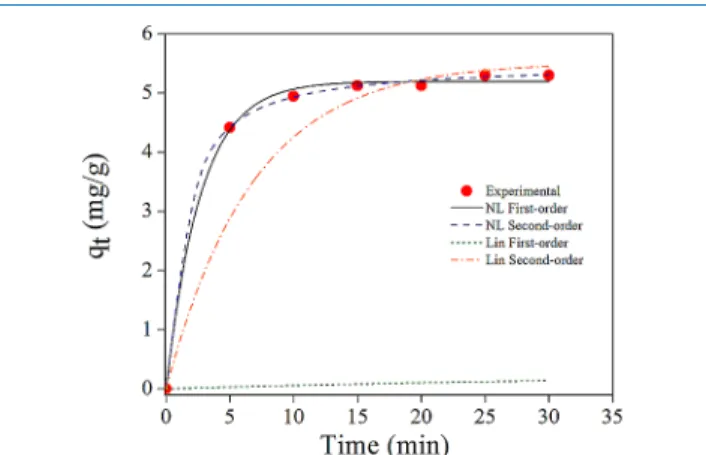
2.7. Adsorption Kinetics. Adsorption rate constants were
calculated by measuring instantaneous adsorption capacity (qt)
as a function of time. A comparison of linear and nonlinear
forms of pseudo-first- and pseudo-second-order kinetics
models is graphically demonstrated in Figure 11 for ARS
adsorption on BFA−APTES, while the kinetic rate constants,
SSE, and correlation coefficient (R2) of both models for all the
samples are summarized inTables 5and6. It is clear that the
nonlinear analysis produced the best curve fits, providing
estimations that were the closest to the experimental data. A reasonable agreement between the calculated and experimental
values of qeobtained from the nonlinear form of kinetic models
verifies the importance of using equations in their original
form.59 Adsorption of both dyes on BFA−APTES has the
fastest rates (k2= 1.395 g/mg min for BTB and k2= 0.518 g/
mg min for ARS).
The difference between the constants (k1, k2, and qe)
obtained from linear and nonlinear kinetic models appear to be
very clear betweenTables 5and6.
After this step, kinetic constants with the lowest SSE value will be used in our calculations. We assume that adsorption kinetics follows the Arrhenius type behavior.
k=A exp(−E RTa/ ) (2) and H E RT ad m0 a Δ = − (3)
The adsorption molar enthalpy (ΔadHm0) is calculated for
both dyes on A-BFA and BFA−APTES from the nonlinear
curve fitted plots of reaction rate constant (k) versus
temperature (Table 7).
2.8. Adsorption Thermodynamics. The thermodynamic parameters such as adsorption molar Gibbs free energy
(ΔadGm0), adsorption molar enthalpy (ΔadHm0), and adsorption
molar entropy (ΔadSm0) were studied to investigate the effect of
temperature on the adsorption process at pH 4.72,73 The
magnitude ofΔadGm0 was calculated from following equation
G RT lnK
ad m 0
Δ = − (4)
where K is the equilibrium constant (K = kads/kdes), T is the
absolute temperature (K), and R is the universal gas constant (8.314 J/mol K).
The adsorption molar enthalpy ΔadHm0 and Δ
adSm0 were
obtained from Van’t Hoff relation
K S R H RT ln ad m 0 ad m0 = Δ − Δ (5)
The calculated thermodynamic parameters are summarized in Table 7. A study of temperature dependence of the adsorption process gives information on the spontaneity of the
adsorbent−adsorbate interaction.74 The ΔG0 values in the
range of 0 to−20 and −80 to −400 kJ mol−1indicate physical
and chemical adsorption processes, respectively.75 The
negative values of ΔadGm0 observed in our study suggested a
spontaneous nature of the process of adsorption of dyes on
BFA−APTES, whereas a positive ΔadGm0 was calculated for
A-BFA, which indicated unfavorable adsorption on this
adsorbent. The negative values of ΔadHm0 indicated the
exothermic nature of adsorption processes.
It is worth mentioning here that the temperature range of
298−338 K was applied in this study to demonstrate the
adsorption behavior of the reported adsorbent under the conditions that can be conveniently applied at large scales. In
addition, the 298−338 K temperature range is widely
employed by other researchers, which would make it
convenient to draw comparisons between different
stud-ies.76−79
Table 4. Comparison of Adsorption Densities of Various Adsorbents Reported in the Literature
sr. no. adsorbents adsorbates adsorption densityΓ references
1 mesoporous alumina As(III), As(V) 1.94× 10⁻⁶, 5.85×10⁻⁶mol/m2 68
2 mesoporous Alumina ammonia 0.44 mg/m2 69
3 γ-Al2O3/Fe3O4/SiO2/PGMA nanocomposite remazol navy RGB azo dye 1.30 mg/m2 70
4 sepiolite Co(II) 1:17× 10−6mol/m2 71
5 BFA−APTES bromothymol blue 0.608 mg/m2 current study
6 BFA−APTES alizarin red S 0.306 mg/m2 current study
Figure 11. Comparison of adsorption kinetics estimated by the nonlinear curvefits (black solid line for pseudo-first-order and dashed blue line for pseudo-second-order kinetics) and linear curve fits (green dotted line for pseudo-first-order and orange dashdotted line for pseudo-second-order kinetics) for the adsorption of ARS−BFA APTES (red circle solid).
2.9. Regeneration and Reusability. Regeneration of the adsorbent after the adsorption process is important for its reuse especially for increasing the economic feasibility of the
process at commercial scale. Different eluting agents including
NaOH, HCl, methanol, acetic acid, and a mixture of methanol and acetic acid were employed to regenerate the adsorbent for
reuse.80The desorption of dyes was carried out by separately
washing the ARS (t = 10 min, T = 298 K) and BTB (t = 5 min,
T = 298 K) loaded adsorbents with different eluting agents, 10
mL of 1 M NaOH, 1 M HCl, methanol, 1 M acetic acid, and a
mixture of acetic acid and methanol (1:1). The concentrations of desorbed dye in solutions were spectrophotometrically
quantified. The best desorption performance was achieved
with 1 M NaOH solution for ARS (89%) and BTB (79%) (Figure 12). The superior desorption performance of NaOH
highlights that the interaction between the BFA−APTES
adsorbent and dyes (ARS and BTB) is electrostatic in nature with high dependency on the pH of the medium. This observation complements our results provided in the previous Table 5. Nonlinear Pseudo-First-Order and Pseudo-Second-Order Kinetics Analysis Results for the Adsorption of ARS and
BTB on A-BFA and BFA−APTES
alizarin red S bromothymol blue
parameters A-BFA BFA−APTES parameters A-BFA BFA−APTES
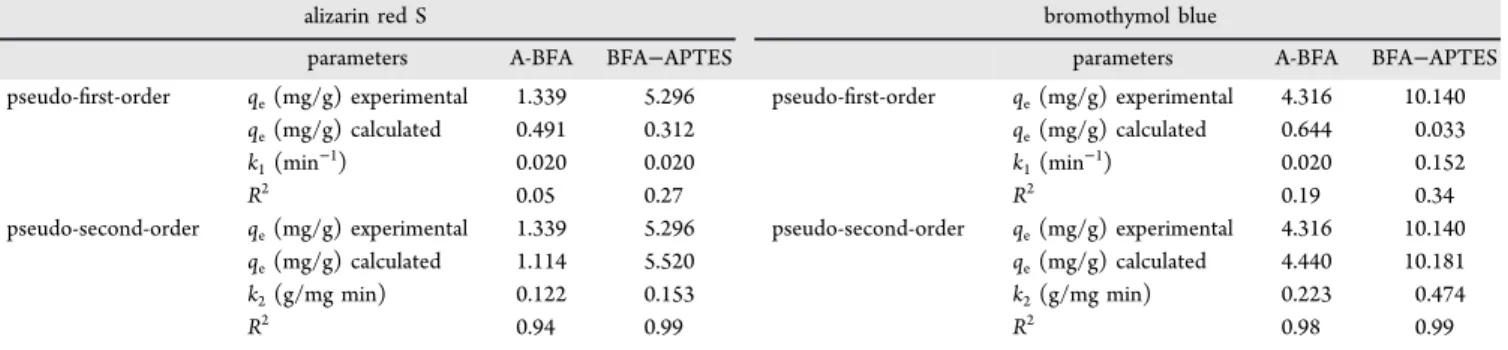
pseudo-first-order qe(mg/g) experimental 1.339 5.296 pseudo-first-order qe(mg/g) experimental 4.316 10.140
qe(mg/g) calculated 1.964 5.194 qe(mg/g) calculated 3.998 10.033
k1(min−1) 0.325 0.369 k1(min−1) 0.604 1.246
SSE 0.271 0.033 SSE 0.032 0.042
pseudo-second-order qe(mg/g) experimental 1.339 5.296 pseudo-second-order qe(mg/g) experimental 4.316 10.140
qe(mg/g) calculated 2.023 5.516 qe(mg/g) calculated 4.107 10.088
k2(g/mg min) 0.518 0.148 k2(g/mg min) 0.544 1.395
SSE 0.339 2.896 SSE 0.076 0.049
Table 6. Linearized Pseudo-First-Order and Pseudo-Second-Order Kinetics Analysis Results for the Adsorption of ARS and
BTB on A-BFA and BFA−APTES
alizarin red S bromothymol blue
parameters A-BFA BFA−APTES parameters A-BFA BFA−APTES
pseudo-first-order qe(mg/g) experimental 1.339 5.296 pseudo-first-order qe(mg/g) experimental 4.316 10.140
qe(mg/g) calculated 0.491 0.312 qe(mg/g) calculated 0.644 0.033
k1(min−1) 0.020 0.020 k1(min−1) 0.020 0.152
R2 0.05 0.27 R2 0.19 0.34
pseudo-second-order qe(mg/g) experimental 1.339 5.296 pseudo-second-order qe(mg/g) experimental 4.316 10.140
qe(mg/g) calculated 1.114 5.520 qe(mg/g) calculated 4.440 10.181
k2(g/mg min) 0.122 0.153 k2(g/mg min) 0.223 0.474
R2 0.94 0.99 R2 0.98 0.99
Table 7. Thermodynamic Parameters for the Adsorption of ARS and BTB on BFA and BFA-APTES.
alizarin red S bromothymol blue
parameters A-BFA BFA−APTES parameters A-BFA BFA−APTES
ΔG° (kJ/mol) 5.839 −1.300 ΔG° (kJ/mol) 3.787 −11.647
ΔH° (kJ/mol) −21.948 −13.393 ΔH° (kJ/mol) −10.585 −87.817
ΔS° (kJ/mol.K) −0.093 −0.042 ΔS° (kJ/mol.K) −0.048 −0.256
Figure 12.Effect of different eluting agents on desorption of dyes (a) ARS (amount of adsorbent = 20 mg, t = 10 min, at room temperature) and (b) BTB (amount of adsorbents = 20 mg, t = 5 min, at room temperature). The solid lines are drawn to highlight the trend.
section of this study dealing with the effect of pH on adsorption capacity of the reported adsorbent.
After successful demonstration of regeneration of adsorb-ents, their reusability was also studied. For the regeneration of
adsorbents, the dye-loaded A-BFA and BFA−APTES were
separately dispersed in 10 mL of 1 M NaOH solution under optimized conditions (for ARS t = 10 min, at room temperature and for BTB t = 5 min, at room temperature). After desorption, adsorbents were washed with deionized
water, dried at 80°C, and reused for adsorption in the next
cycle. Meanwhile, the concentrations of the released dyes in the supernatants were determined spectrophotometrically. To validate the reusability of A-BFA and BFA−APTES, several
cycles of consecutive adsorption−desorption were carried out.
The results displayed in Figure 13 showed that the BFA−
APTES showed more than 60% removal for up to 5 cycles for ARS and for up to 6 cycles for BTB.
As it can be noticed from this study, BFA by its nature is a
poor adsorbent; however, it can be modified to achieve a better
performance.81Silanization is a low-cost and effective covalent
coating method to modify material surfaces. A number of silane-coupling agents are commercially available, which can conveniently introduce a variety of functional groups (e.g., amino group and carboxyl group) on diverse surfaces
presenting hydroxyl groups.82APTES, the silane employed in
this study, is the most widely used silane employed for the surface functionalization to achieve materials displaying amino
groups on their surfaces.83 Thus, in the present work, the
development of the adsorbent involves inexpensive raw materials (BFA and APTES) and simple functionalization process. The abundance of these materials, low cost, modest processing, and reasonable adsorption ability make our
reported adsorbent (APTES−BFA) an attractive platform
from sustainability as well as the economic point of view. It is worth mentioning here that considering the low cost related to the materials and the process applied in this study, reusability might be of limited importance; however, we believe that the
reusability experiment presented here is of high scientific
interest for the scientific community which is working on the
development of cost-effective adsorbents for remediation
applications.
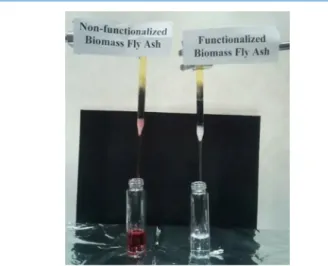
2.10. Column Studies. BFA−APTES was chosen as the model adsorbent in batch experiments because of its aforementioned superior adsorption characteristics. A small
column of the BFA−APTES adsorbent is packed to
demonstrate its remediation properties in column setting. A simple glass tube (pasture pipette) with a diameter of 6 mm and a length of 22 mm is used for this purpose. A small plug of
glass wool was placed at the bottom of the column (Figure 14)
to prevent washing out of the adsorbent. Each adsorbent (500
mg) (A-BFA and BFA−APTES) was added to two separate
columns followed by the gentle tapping of the columns to consolidate the adsorbents and remove any air bubble. ARS dye solution was chosen as an adsorbate because of its ease of
visual following with 200 ppm concentration (Figure 14). It
was observed that the column packed with the BFA−APTES
adsorbent could remove 99% of dye (ARS) from the 15 mL of 200 ppm dye solution passed through it. The water coming out
of the column packed with the BFA−APTES adsorbent was
clear without any visible trace of dye in it that was also
confirmed spectrophotometrically (please refer to the video
provided inSupporting Information). On the other hand,
red-colored water can be clearly seen coming out of the column packed with A-BFA. It is worth mentioning here that the aqueous solution of ARS dye is yellowish in color under acidic and neutral conditions. Because of the pH responsiveness, ARS shows red color under basic conditions. The basic nature of A-BFA led to the change in color of ARS dye to red while it passed through the column packed with the A-BFA.
3. CONCLUSIONS
In summary, we presented silanization as a facile route for the
functionalization of pristine BFA to prepare efficient
Figure 13.Reusability of A-BFA and BFA−APTES for the adsorption of (a) ARS (amount of adsorbent = 20 mg, pH = 4, t = 10 min, at room temperature) and (b) BTB (amount of adsorbent = 20 mg, pH = 4, t = 5 min, at room temperature). The solid lines are guide to the eye.
Figure 14.Photograph of columns packed with the A-BFA and BFA− APTES adsorbents. 200 ppm aqueous solution of ARS dye was passed through both the columns. The water coming out of the columns was collected in glass vial for spectrophotometric estimation of the dye content.
adsorbents for the adsorptive removal of anionic dyes (ARS and BTB). We simply employed APTES to prepare
amine-functionalized BFA (BFA−APTES). The effectiveness of the
employed strategy for the fabrication of BFA−APTES and the
physiochemical properties of the resulting material were established by employing XPS, SEM, and TGA. The prepared
BFA−APTES was applied as an adsorbent for the adsorptive
removal of anionic dyes (ARS and BTB). The adsorption
behavior of A-BFA and BFA−APTES was quantified and
compared with linear and nonlinear versions of isotherm and kinetic models. Our comparative calculations have shown that linearizing adsorption equations can be misleading and incomplete. The nonlinear analysis on experimental data is the most accurate calculation method, and it is simple. The
BFA−APTES absorbent displayed superior adsorption
capaci-ties toward both the dyes tested in this study. The superior
adsorption capacities in the case of BFA−APTES were
attributed to the successful introduction of amine groups on the surface of BFA during the silanization process. The adsorption behavior was found to follow the MLF adsorption
model. The thermodynamic parameters including ΔadGm0 and
ΔadHm0 suggested that the process of adsorption was
spontaneous and exothermic. The developed BFA−APTES
adsorbent also exhibited superior recyclability and could be reused for several cycles after desorption of the adsorbed dyes. Besides studying the remediation in batch setting, we also packed columns using A-BFA and amine-functionalized BFA. Our column studies further revealed the superior performance
of BFA−APTES for efficient removal of dye from aqueous
solution. Based on the data presented in this study, we believe
that this simple and low-cost modification approach opens up
new opportunities for the fabrication of BFA-based functional
materials as efficient adsorbents for remediation applications.
4. EXPERIMENTAL SECTION
4.1. Materials and Methods. BFA was obtained from a biomass thermal power station installed at Bulleh Shah Packaging (Ltd.), Kasur, Pakistan. Wheat and corn stalks constitute the major part of the biomass fuel. Toluene (99%),
APTES (≥98%), BTB (95%), ethanol (>99%), acetic acid
(99.7%), and methanol (>99%) were purchased from Sigma-Aldrich, Germany. ARS was purchased from Eyer Chemical reagents, China.
4.2. Activation of BFA. BFA was washed several times with distilled water to remove any water-soluble contents. After
washing, BFA was dried in an oven at 100°C for 24 h. The
activation of BFA was achieved by stirring its suspension in 1
M aqueous HCl solution for 24 h. The activatedfly ash was
recovered by gravity filtration and washed several times with
water to remove any residue HCl. The activated BFA (A-BFA)
was then dried in an oven at 100 °C for 24 h. The acid
treatment offly ash improves the adsorption characteristics by
removing soluble impurities present in FA and exposing the
surface−OH groups.
4.3. Synthesis of Amine-Functionalized BFA (BFA−
APTES). APTES functionalization of BFA (BFA−APTES) was
performed using a slightly modified version of the reported
procedures.42,43,84−86APTES (4 mL) was added in 36 mL of
toluene; 2 g of activated BFA was added in this solution, and the suspension was refluxed for 24 h. The product was then centrifuged, washed three times with toluene, and dried in an
oven at 100°C overnight.
4.4. Structural Characterization. SEM was performed using FEI Nova Nano SEM 450 equipped with the Oxford
EDX detector. XPS was performed using Thermo Scientific
K-Alpha. The Mg Kα (1253.6 eV) X-ray source was operated at
300 W. A pass energy of 117.40 eV was used for the survey
scans. The spectra were recorded using a 60° take off angle
relative to the surface normal. TGA was carried out on a TGA Q50 V6.2 Build 187 thermogravimetric analyzer. Samples were
heated at 10°C min−1from ambient temperature to 800 °C
under nitrogen flow. The UV/vis absorption spectra were
recorded using a Shimadzu UV-1800 spectrophotometer. The
N2adsorption−desorption measurements were performed by
using a Quantachrome Nova 2200e. Prior to the
measure-ments, A-BFA and BFA−APTES were degassed overnight
under vacuum at 363 and 333 K, respectively.
4.5. Batch Adsorption Studies. The dye adsorption
capacities of A-BFA and BFA−APTES were studied by a batch
method, which permits a convenient evaluation of parameters that influence the adsorption process, such as chemical
modification, pH of dye solutions, initial concentration of
dyes, amount of adsorbents, contact time, and temperature.
The effect of pH was investigated by preparing a series of dye
solutions with pH ranging from 2.0 to 12.0 at a concentration
of 15 mg L−1. The pH of the dye solution was adjusted with
0.1 M HCl or 0.1 M NaOH aqueous solutions. The effect of
dye concentration was monitored by using different initial
concentrations of dye solutions (10, 20, 30, 40, and 50 mg
L−1) at the pH optimal for adsorption. The impact of the
dosage amount was determined by adding different amounts
(5−30 mg) of adsorbents (A-BFA and BFA−APTES) to the
dye solutions at the pH optimal for adsorption. To study the
effect of contact time, the dye content remained in the solution
treated with the adsorbents at predetermined time intervals (5, 10, 15, 20, 25, and 30 min) was determined
spectrophoto-metrically. The effect of temperature on the adsorption of dyes
was studied by performing adsorption at different temperatures
(298, 308, 318, 328, and 338 K). In each adsorption experiment, 10 mL of dye solutions were used and the suspensions were shaken at 250 rpm. After shaking at the optimized conditions, the samples were centrifuged and the concentrations of dyes in the supernatant solutions were determined using a spectrophotometer. The calibration curves were obtained by recording absorbance of dye solutions of
known concentrations atλmax(422 nm for ARS and 432 nm for
BTB). Different reagents (1 M NaOH, 1 M HCl, methanol, 1 M acetic acid, and a 1:1 by volume mixture of methanol and acetic acid) were tested for regeneration of the used adsorbents. To study the reusability of both the adsorbents,
the dye-loaded A-BFA and BFA−APTES were separately
dispersed in 10 mL of 1 M NaOH solution. After desorption, adsorbents were washed with deionized water, dried, and reused for the next adsorption cycle. The concentrations of the desorbed dyes in the supernatants were determined spectrophotometrically.
The column adsorption studies were conducted in a glass column with a diameter of 6 mm and a length of 22 mm. Known quantities (500 mg) of both adsorbents (A-BFA and
BFA−APTES) were packed in separate columns to yield the
desired bed height of the adsorbent; 200 ppm solution of ARS dye was channeled into the column. Samples of the water coming out of the column were collected and analyzed spectrophotometrically to estimate the concentration of dye.
The amount of dye adsorbed at equilibrium qe (mg/g) was calculated from the following equation
q C C V W ( ) e o e = − (6)
where, qeis the adsorption capacity (mg/g) of the adsorbent at
equilibrium, V is the volume of dye aqueous solution in litres,
Co and Ce (mg/g) are the initial and equilibrium
concen-trations of dye, and W is the mass of the adsorbent in grams. Please note that the dyes can photobleach overtime, and this aspect should be considered by performing the dye removal experiments that are based on UV/vis absorption of the dye solutions. In our case, we monitored the UV/vis absorption of 15 ppm solution of ARS and 10 ppm solution of BTB for three consecutive days (stored in the dark) and observed that upon careful storage, there was no change in the intensity of
absorption for both the dyes during first two days. A small
decrease in the intensity of absorption of both the dyes was observed on the third day; however, this timeframe is beyond the timeframe used in the remediation experiments reported in this study. Therefore, photobleaching does not contribute to the data presented in this study.
4.6. Adsorption Isotherms. Adsorption of ARS and BTB
onto A-BFA and BFA−APTES was investigated by
two-parameter (Langmuir and Freundlich) and three-two-parameter (MLF) nonlinear models. The langmuir model describes that the adsorbent sites have identical energy, and each adsorbate molecule is located on a single site. This model depicts the formation of the monolayer of the adsorbate on the homogeneous adsorbent surface. The nonlinear form of Langmuir isotherm is given as
q K q C K C 1 e L max e L e = + (7)
while the linearized Langmuir isotherm is C q q K C q 1 e e max L e max = + (8)
where Ceis the equilibrium concentration of the adsorbate (mg
L−1), qe is the amount of the adsorbate adsorbed per unit
amount of the adsorbent at equilibrium (mg g−1), and qmax
(mg g−1) and KL(L mg−1) are the Langmuir constants related
to maximum monolayer adsorption capacity and energy
change during adsorption.84
The dimensionless separation factor (RL) is generally used
to express the feasibility of adsorption and affinity between the
adsorbent and adsorbate. The value of RLindicates the shape
of the isotherm to be either unfavorable (RL> 1), linear (RL=
1), favorable, (0 < RL< 1) or irreversible (RL= 0)87and can be
calculated by the following equation R K C 1 1 L L 0 = + (9)
where Co(mg L−1) is the initial concentration of the adsorbate.
In the present study, the calculated RLvalues were in the range
of 0 < RL< 1, indicating favorable adsorption of dye molecules
on both the adsorbents.
The Freundlich isotherm is not restricted to the formation of the monolayer and describes the nonideal adsorption that involves the heterogeneous surfaces. The nonlinear Freundlich isotherm is expressed as
q K C n
e f e
1/
= (10)
whereas the linearized Freundlich isotherm equation is
q K
n C
log e =log f+ 1log e (11)
where qe represents dye concentration adsorbed on an
adsorbent (mg g−1) at equilibrium, Kf is the Freundlich
constant which represents the adsorption capacity (mg g−1), Ce
represents equilibrium dye concentration in solutions (mg
L−1), and the slope, 1/n with favorable range between 0 and 1,
is a measure of the adsorption intensity or surface
heterogeneity.43 The calculated values of 1/n are 0.58 ±
0.12 and 0.11± 0.07 for the adsorption of ARS and BTB on
BFA−APTES, respectively. The smaller value of 1/n for BTB indicated better interaction with the adsorbent and hence more favorable adsorption of BTB on BFA−APTES than ARS.
The MLF is a three-parameter empirical model, and there is linear dependency on the concentration in the numerator and exponentially increases in the denominator to enhance the wide range of concentration of adsorption equilibrium.
q q K C K C 1 n n e mon MLF e 1/ MLF e1/ = + (12)
and the linearized MLF model can be written as q q q n C K ln e 1ln( ) ln( ) n mon e e MLF1/ − = + i k jjjjj j y { zzzzz z (13)
where qmonis the adsorption capacity (mg g−1), and KMLF(L
mg−1) and n are the MLF constants. The value of 1/n lies
between zero and unity.
The linear regression coefficient (R2) and least-square
regression based on the sum of the squares of residues (SSE) are applied as error functions in order to identify the best adsorption isotherms and kinetic models for linear and nonlinear forms of corresponding models.
q q SSE ( ) i m 1 e,pre e,exp 2
∑
= − = (14)4.7. Adsorption Kinetics. Kinetics of the adsorption process provides essential information about the reaction pathways and the solute uptake rate. The linear forms of
pseudo-first-order and pseudo-second-order kinetics were
applied to study the adsorption kinetics.88 The nonlinear
pseudo-first-order model was described as
qt=q (1e −exp−k t1)
(15)
While linear version of the pseudo-first-order model was
described by Lagergren q q q k t log( ) log 2.303 t e e 1 − = − i k jjj y { zzz (16)
where qe and qt are the adsorption capacities (mg g−1) at
equilibrium and at time t, respectively, and k1 is the rate
constant of pseudo-first-order adsorption (L min−1).
The nonlinear pseudo-second-order rate equation is
q q k t q k t 1 t e 2 2 e 2 = + (17)
and linear from of pseudo-second-order rate equation of McKay and Ho can be expressed as
t q k q q t 1 1 t 2 e 2 e = + (18)
where the equilibrium adsorption capacity qeand the
pseudo-second-order constants k2 (g/mg min) can be determined
experimentally.
■
ASSOCIATED CONTENT*
sı Supporting InformationThe Supporting Information is available free of charge at https://pubs.acs.org/doi/10.1021/acsomega.0c00889.
Demonstration of remediation on the column packed
with the developed adsorbent (MP4)
■
AUTHOR INFORMATIONCorresponding Authors
Hatice Duran− Department of Materials Science &
Nanotechnology Engineering, TOBB University of Economics
and Technology, 06560 Ankara, Turkey;
orcid.org/0000-0001-6203-3906; Email:[email protected]
Basit Yameen− Department of Chemistry & Chemical
Engineering, Syed Babar Ali School of Science and Engineering (SBASSE), Lahore University of Management Sciences
(LUMS), Lahore 54792, Pakistan;
orcid.org/0000-0002-4359-8394; Email:[email protected]
Authors
Safana Dogar− Department of Chemistry & Chemical
Engineering, Syed Babar Ali School of Science and Engineering (SBASSE), Lahore University of Management Sciences (LUMS), Lahore 54792, Pakistan
Sana Nayab− Department of Chemistry & Chemical
Engineering, Syed Babar Ali School of Science and Engineering (SBASSE), Lahore University of Management Sciences (LUMS), Lahore 54792, Pakistan
Muhammad Qamar Farooq− Department of Chemistry &
Chemical Engineering, Syed Babar Ali School of Science and Engineering (SBASSE), Lahore University of Management Sciences (LUMS), Lahore 54792, Pakistan
Amir Said− Bulleh Shah Packaging (BSP) Pvt. Ltd., Kasur,
Pakistan
Raheel Kamran− Bulleh Shah Packaging (BSP) Pvt. Ltd.,
Kasur, Pakistan
Complete contact information is available at: https://pubs.acs.org/10.1021/acsomega.0c00889
Author Contributions
The manuscript was written through contributions of all
authors. All authors have given approval to thefinal version of
the manuscript.
Notes
The authors declare no competingfinancial interest.
■
ACKNOWLEDGMENTSB.Y. acknowledges support from HFSP (RGY0074/2016), HEC for NRPU (Project no. 1740/R&D/10/3368, 20-1799/R&D/10-5302, and 5922), TDF-033 grants, and LUMS for start-up fund and FIF grant. H.D. gratefully acknowledges
Max−Planck−Gesellschaft (MPG) for the financial support of
the MPIP-TOBB ETU Partner Group Program (Soft Matter in
Nanoconfinement).
■
REFERENCES(1) McKendry, P. Energy production from biomass (part 1): overview of biomass. Bioresour. Technol. 2002, 83, 37−46.
(2) Voshell, S.; Mäkelä, M.; Dahl, O. A review of biomass ash properties towards treatment and recycling. Renew. Sustain. Energy Rev. 2018, 96, 479−486.
(3) Xing, Y.; Guo, F.; Xu, M.; Gui, X.; Li, H.; Li, G.; Xia, Y.; Han, H. Separation of unburned carbon from coal fly ash: A review. Powder Technol. 2019, 353, 372−384.
(4) Blissett, R. S.; Rowson, N. A. A review of the multi-component utilisation of coal fly ash. Fuel 2012, 97, 1−23.
(5) Izquierdo, M.; Querol, X. Leaching behaviour of elements from coal combustion fly ash: An overview. Int. J. Coal Geol. 2012, 94, 54− 66.
(6) Yao, Z. T.; Ji, X. S.; Sarker, P. K.; Tang, J. H.; Ge, L. Q.; Xia, M. S.; Xi, Y. Q. A comprehensive review on the applications of coal fly ash. Earth-Sci. Rev 2015, 141, 105−121.
(7) Vassilev, S. V.; Baxter, D.; Andersen, L. K.; Vassileva, C. G. An overview of the composition and application of biomass ash.: Part 2. Potential utilisation, technological and ecological advantages and challenges. Fuel 2013, 105, 19−39.
(8) Voshell, S.; Mäkelä, M.; Dahl, O. A review of biomass ash properties towards treatment and recycling. Renew. Sustain. Energy Rev. 2018, 96, 479−486.
(9) Ahmaruzzaman, M. A review on the utilization of fly ash. Prog. Energy Combust. Sci. 2010, 36, 327−363.
(10) Vassilev, S. V.; Vassileva, C. G.; Song, Y.-C.; Li, W.-Y.; Feng, J. Ash contents and ash-forming elements of biomass and their significance for solid biofuel combustion. Fuel 2017, 208, 377−409.
(11) Onutai, S.; Kobayashi, T.; Thavorniti, P.; Jiemsirilers, S. Porous fly ash-based geopolymer composite fiber as an adsorbent for removal of heavy metal ions from wastewater. Mater. Lett. 2019, 236, 30−33. (12) Visa, M.; Bogatu, C.; Duta, A. Tungsten oxide− fly ash oxide composites in adsorption and photocatalysis. J. Hazard. Mater. 2015, 289, 244−256.
(13) Mushtaq, F.; Zahid, M.; Bhatti, I. A.; Nasir, S.; Hussain, T. Possible applications of coal fly ash in wastewater treatment. J. Environ. Manage. 2019, 240, 27−46.
(14) Hosseini Asl, S. M.; Javadian, H.; Khavarpour, M.; Belviso, C.; Taghavi, M.; Maghsudi, M. Porous adsorbents derived from coal fly ash as cost-effective and environmentally-friendly sources of aluminosilicate for sequestration of aqueous and gaseous pollutants: A review. J. Clean. Prod. 2019, 208, 1131−1147.
(15) Thirumalai, K.; Balachandran, S.; Swaminathan, M. Superior photocatalytic, electrocatalytic, and self-cleaning applications of Fly ash supported ZnO nanorods. Mater. Chem. Phys. 2016, 183, 191− 200.
(16) Chen, J.-W.; Yuan, B.; Shi, J.-W.; Yang, J.-C. E.; Fu, M.-L. Reduced graphene oxide and titania nanosheet cowrapped coal fly ash microspheres alternately as a novel photocatalyst for water treatment. Catal. Today 2018, 315, 247−254.
(17) Mazumder, N. A.; Rano, R. An efficient solid base catalyst from coal combustion fly ash for green synthesis of dibenzylideneacetone. J. Ind. Eng. Chem. 2015, 29, 359−365.
(18) Fan, H.; Chen, D.; Ai, X.; Han, S.; Wei, M.; Yang, L.; Liu, H.; Yang, J. Mesoporous TiO2 coated ZnFe2O4 nanocomposite loading on activated fly ash cenosphere for visible light photocatalysis. RSC Adv. 2018, 8, 1398−1406.
(19) Song, J.; Wang, X.; Bu, Y.; Wang, X.; Zhang, J.; Huang, J.; Ma, R.; Zhao, J. Photocatalytic enhancement of floating photocatalyst: Layer-by-layer hybrid carbonized chitosan and Fe-N- codoped TiO2 on fly ash cenospheres. Appl. Surf. Sci. 2017, 391, 236−250.
(20) Dindi, A.; Quang, D. V.; Vega, L. F.; Nashef, E.; Abu-Zahra, M. R. M. Applications of fly ash for CO2 capture, utilization, and storage. J. CO2 Util. 2019, 29, 82−102.
(21) Tosti, L.; van Zomeren, A.; Pels, J. R.; Dijkstra, J. J.; Comans, R. N. J. Assessment of biomass ash applications in soil and cement mortars. Chemosphere 2019, 223, 425−437.
(22) Berra, M.; Mangialardi, T.; Paolini, A. E. Reuse of woody biomass fly ash in cement-based materials. Constr. Build. Mater. 2015, 76, 286−296.
(23) Nagrockienė, D.; Daugėla, A. Investigation into the properties of concrete modified with biomass combustion fly ash. Constr. Build. Mater. 2018, 174, 369−375.
(24) Novais, R. M.; Carvalheiras, J.; Senff, L.; Labrincha, J. A. Upcycling unexplored dregs and biomass fly ash from the paper and pulp industry in the production of eco-friendly geopolymer mortars: A preliminary assessment. Constr. Build. Mater. 2018, 184, 464−472.
(25) Saeli, M.; Tobaldi, D. M.; Seabra, M. P.; Labrincha, J. A. Mix design and mechanical performance of geopolymeric binders and mortars using biomass fly ash and alkaline effluent from paper-pulp industry. J. Clean. Prod. 2019, 208, 1188−1197.
(26) Bicer, A. Effect of fly ash particle size on thermal and mechanical properties of fly ash-cement composites. Therm. Sci. Eng. Prog. 2018, 8, 78−82.
(27) Guo, Y.; Zhao, C.; Chen, X.; Li, C. CO2 capture and sorbent regeneration performances of some wood ash materials. Appl. Energy 2015, 137, 26−36.
(28) López, R.; Díaz, M. J.; González-Pérez, J. A. Extra CO2 sequestration following reutilization of biomass ash. Sci. Total Environ. 2018, 625, 1013−1020.
(29) Fernández-Delgado Juárez, M.; Mostbauer, P.; Knapp, A.; Müller, W.; Tertsch, S.; Bockreis, A.; Insam, H. Biogas purification with biomass ash. Waste Manag. 2018, 71, 224−232.
(30) Gao, W.; Fatehi, P. Fly ash based adsorbent for treating bleaching effluent of kraft pulping process. Sep. Purif. Technol. 2018, 195, 60−69.
(31) Novais, R. M.; Carvalheiras, J.; Tobaldi, D. M.; Seabra, M. P.; Pullar, R. C.; Labrincha, J. A. Synthesis of porous biomass fly ash-based geopolymer spheres for efficient removal of methylene blue from wastewaters. J. Clean. Prod. 2019, 207, 350−362.
(32) Novais, R. M.; Ascensão, G.; Tobaldi, D. M.; Seabra, M. P.; Labrincha, J. A. Biomass fly ash geopolymer monoliths for effective methylene blue removal from wastewaters. J. Clean. Prod. 2018, 171, 783−794.
(33) Zhao, C.; Guo, Y.; Yan, J.; Sun, J.; Li, W.; Lu, P. Enhanced CO2 sorption capacity of amine-tethered fly ash residues derived from co-firing of coal and biomass blends. Appl. Energy 2019, 242, 453− 461.
(34) Wang, P.; Guo, Y.; Zhao, C.; Yan, J.; Lu, P. Biomass derived wood ash with amine modification for post-combustion CO2 capture. Appl. Energy 2017, 201, 34−44.
(35) Yameen, B.; Kaltbeitzel, A.; Langner, A.; Duran, H.; Müller, F.; Gösele, U.; Azzaroni, O.; Knoll, W. Facile Large-Scale Fabrication of Proton Conducting Channels. J. Am. Chem. Soc. 2008, 130, 13140− 13144.
(36) Yameen, B.; Kaltbeitzel, A.; Langer, A.; Müller, F.; Gösele, U.; Knoll, W.; Azzaroni, O. Highly Proton-Conducting Self-Humidifying Microchannels Generated by Copolymer Brushes on a Scaffold. Angew. Chem., Int. Ed. 2009, 48, 3124−3128.
(37) Yameen, B.; Kaltbeitzel, A.; Glasser, G.; Langner, A.; Müller, F.; Gösele, U.; Knoll, W.; Azzaroni, O. Hybrid Polymer−Silicon Proton Conducting Membranes via a Pore-Filling Surface-Initiated Polymer-ization Approach. ACS Appl. Mater. Interfaces 2010, 2, 279−287.
(38) Kusumastuti, E.; Isnaeni, D.; Sulistyaningsih, T.; Mahatmanti, F. W.; Jumaeri; Atmaja, L.; Widiastuti, N. The Effect of Silane Addition on Chitosan-Fly Ash/CTAB as Electrolyte Membrane. IOP Conf. Ser.: Mater. Sci. Eng. 2017, 172, 012016.
(39) Feyyisa, J. L.; Daniels, J. L.; Pando, M. A.; Ogunro, V. O. Relationship between breakthrough pressure and contact angle for organo-silane treated coal fly ash. Environ. Technol. Innovat. 2019, 14, 100332.
(40) Sroka, J.; Rybak, A.; Sekula, R.; Filipczak, P.; Kozanecki, M.; Sitarz, M. Two-Step Procedure of Fly Ash Modification as an
Alternative Method for Creation of Functional Composite. J. Polym. Environ. 2017, 25, 1342−1347.
(41) Cui, Z.; Liu, J.; Gao, H.; Xue, Y.; Hao, J.; Zhang, R.; Ji, B.; Chen, J. Size and shape dependences of the adsorption kinetics of malachite green on nano-MgO: a theoretical and experimental study. Phys. Chem. Chem. Phys. 2019, 21, 13721−13729.
(42) Butt, A.; Farrukh, A.; Ghaffar, A.; Duran, H.; Oluz, Z.; ur Rehman, H.; Hussain, T.; Ahmad, R.; Tahir, A.; Yameen, B. Design of enzyme-immobilized polymer brush-grafted magnetic nanoparticles for efficient nematicidal activity. RSC Adv. 2015, 5, 77682−77688.
(43) Farrukh, A.; Akram, A.; Ghaffar, A.; Hanif, S.; Hamid, A.; Duran, H.; Yameen, B. Design of Polymer-Brush-Grafted Magnetic Nanoparticles for Highly Efficient Water Remediation. ACS Appl. Mater. Interfaces 2013, 5, 3784−3793.
(44) Sharma, R.; Kamal, A.; Mahajan, R. K. A quantitative appraisal of the binding interactions between an anionic dye, Alizarin Red S, and alkyloxypyridinium surfactants: a detailed micellization, spectro-scopic and electrochemical study. Soft Matter 2016, 12, 1736−1749. (45) Moriguchi, T.; Yano, K.; Nakagawa, S.; Kaji, F. Elucidation of adsorption mechanism of bone-staining agent alizarin red S on hydroxyapatite by FT-IR microspectroscopy. J. Colloid Interface Sci. 2003, 260, 19−25.
(46) Gholivand, M. B.; Yamini, Y.; Dayeni, M.; Seidi, S.; Tahmasebi, E. Adsorptive removal of alizarin red-S and alizarin yellow GG from aqueous solutions using polypyrrole-coated magnetic nanoparticles. J. Environ. Chem. Eng. 2015, 3, 529−540.
(47) Machado, F. M.; Carmalin, S. A.; Lima, E. C.; Dias, S. L. P.; Prola, L. D. T.; Saucier, C.; Jauris, I. M.; Zanella, I.; Fagan, S. B. Adsorption of Alizarin Red S Dye by Carbon Nanotubes: An Experimental and Theoretical Investigation. J. Phys. Chem. C 2016, 120, 18296−18306.
(48) Malak, M.; Imen, N.; Yassine, M.; Nebil, S.; Nizar, B. Electrochemical Oxidation of Bromothymol Blue: Application to Textile Industrial Wastewater Treatment. J. Adv. Oxid. Technol. 2015, 18, 105−113.
(49) Khan, T. A.; Nazir, M. Enhanced adsorptive removal of a model acid dye bromothymol blue from aqueous solution using magnetic chitosan-bamboo sawdust composite: Batch and column studies. Environ. Prog. Sustain. Energy 2015, 34, 1444−1454.
(50) Lubbad, S. H.; Balsam Kamal Abu, A.-R.; Fawzi Suliman, K. Adsorptive-removal of Bromothymol Blue as Acidic-dye Probe from Water Solution Using Latvian Sphagnum Peat Moss: Thermodynamic Assessment, Kinetic and Isotherm Modeling. Curr. Green Chem. 2019, 6, 53−61.
(51) Liu, X.; Zhang, S.-Q.; Wei, X.; Yang, T.; Chen, M.-L.; Wang, J.-H. A novel “modularized” optical sensor for pH monitoring in biological matrixes. Biosens. Bioelectron. 2018, 109, 150−155.
(52) Pathak, A. K.; Bhardwaj, V.; Gangwar, R. K.; De, M.; Singh, V. K. Fabrication and characterization of TiO2 coated cone shaped nano-fiber pH sensor. Opt. Commun. 2017, 386, 43−48.
(53) Yameen, B.; Ali, M.; Neumann, R.; Ensinger, W.; Knoll, W.; Azzaroni, O. Synthetic Proton-Gated Ion Channels via Single Solid-State Nanochannels Modified with Responsive Polymer Brushes. Nano Lett. 2009, 9, 2788−2793.
(54) Yameen, B.; Ali, M.; Neumann, R.; Ensinger, W.; Knoll, W.; Azzaroni, O. Single Conical Nanopores Displaying pH-Tunable Rectifying Characteristics. Manipulating Ionic Transport With Zwitterionic Polymer Brushes. J. Am. Chem. Soc. 2009, 131, 2070− 2071.
(55) Yameen, B.; Ali, M.; Neumann, R.; Ensinger, W.; Knoll, W.; Azzaroni, O. Proton-regulated rectified ionic transport through solid-state conical nanopores modified with phosphate-bearing polymer brushes. Chem. Commun. 2010, 46, 1908−1910.
(56) Hair, M. L.; Hertl, W. Adsorption on hydroxylated silica surfaces. J. Phys. Chem. 1969, 73, 4269−4276.
(57) Litefti, K.; Freire, M. S.; Stitou, M.; González-Álvarez, J. Adsorption of an anionic dye (Congo red) from aqueous solutions by pine bark. Sci. Rep. 2019, 9, 16530.