© 2019 Institute of Physics and Engineering in Medicine
1. Introduction
Throughout the advancements on multichannel transmit arrays in magnetic resonance imaging (MRI), non- quadrature radio frequency (RF) excitation has been ubiquitously studied in the fields of RF shimming, local specific absorption rate (SAR) estimation, and magnetic resonance electrical properties tomography (MR-EPT) (Ibrahim 2006, Abraham and Ibrahim 2007, Van den Berg et al 2007, Van den Bergen et al 2007, Katscher
et al 2009, 2012, Zhang et al 2013a). For many of these studies, acquisition of the complex-valued transmit field (B+
1 = (Bx+ iBy)/2) is crucial. In the studies of SAR determination, the complex B+1 field is used in the derivation of the necessary electric field components (Van den Bergen et al 2007, Katscher et al 2012, Zhang et al
2013a). Especially in the studies, where the non-quadrature excitation is used to focus the transmit field on a particular location, calculation of SAR is even more problematic as assumptions on transmit phase estimation become less valid (Van de Moortele et al 2005, Katscher et al 2012, Liu et al 2013). For the MR-EPT studies in which non-quadrature drive can be required such as in Liu et al (2015) and Ariturk and Ider (2018), acquisition of the transmit phase serves as a backbone for the determination of the desired electrical property maps.
Retrieval of the complex B+
1 is traditionally accomplished by acquiring its magnitude and phase in different steps. While there exists conventionally settled methods for obtaining the magnitude of B+
1 for both quadrature G Ariturk and Y Z Ider
B+
1 phase retrieval for non-quadrature radio frequency excitation and its preliminary application in MR-EPT
Printed in the UK
02NT02
PHMBA7
© 2019 Institute of Physics and Engineering in Medicine 64
Phys. Med. Biol.
PMB 1361-6560 10.1088/1361-6560/aaf7be 2
1
11
Physics in Medicine & Biology
11
January
B
1
+
phase retrieval for non-quadrature radio frequency excitation
and its preliminary application in MR-EPT
Gokhan Ariturk1 and Yusuf Ziya Ider1,21 Department of Electrical and Electronics Engineering, Bilkent University, Ankara, Turkey 2 Author to whom any correspondence should be addressed.
E-mail: [email protected] Keywords: B+
1 phase acquisition, non-quadrature excitation, MR-EPT, multichannel RF transmission, TEM transceiver array, B1 shimming
Abstract
Non-quadrature radio frequency (RF) excitation has been widely studied in the fields of RF shimming, local SAR estimation, and MR-EPT with the use of multi-channel transceiver arrays. These studies generally require the retrieval of the complex transmit field (B+
1), which can be
accomplished by acquiring its magnitude and phase in different steps. Magnitude of the transmit field is acquired with the conventional methods which give accurate results for both quadrature and non-quadrature excitations. On the other hand, there is no straightforward method to acquire the absolute phase of the transmit field and generally approximations in MRI experiments are made in order to get it. However, many of these approximations fail in non-quadrature excitation and/or in ultra high fields. In this study, we propose a simple method to acquire the absolute transmit phase in non-quadrature excitation with an eight channel transceiver TEM array for 3 T. The proposed method requires the application of a single additional quadrature drive in order to get the receive phases of the individual channels of the transceiver coil. These receive phases are then subtracted from the transceive phase of the non-quadrature drive experiment to acquire its transmit phase. The developed ideas are tested in the framework of simulations and MRI experiments with the use of four different non-quadrature drive configurations. It has been observed that the simulated and experimentally acquired transmit phase distributions tend to have a strong consensus which supports the validity of the proposed method. Finally, the estimated transmit phase distribution of non-quadrature drive is used in the standard MR-EPT study to get the conductivity reconstructions in order for the validation of its eligibility in MR-EPT studies.
NOTE 2019 RECEIVED 10 September 2018 REVISED 21 November 2018
ACCEPTED FOR PUBLICATION
11 December 2018
PUBLISHED 11 January 2019
https://doi.org/10.1088/1361-6560/aaf7be
and non-quadrature excitation (Stollberger and Wach 1996, Cunningham et al 2006, Sacolick et al 2010), there is no straightforward method to obtain the absolute phase of the transmit field. Although there are studies to cal-culate the derivatives of the absolute transmit phases, which can also be used to determine the electrical property (EP) maps (Liu et al 2013, 2016, Liu et al 2015), a conventional method to estimate the absolute transmit phase is still the subject of many inquiries.
One of the most common methods for obtaining the phase of the transmit field is the transceive phase approximation (TPA) which assumes that the transmit and receive phase distributions are equivalent and there-fore half of the acquired transceive phase is used as the transmit phase (Katscher et al 2009, Van Lier et al 2012). TPA works best for the cases of quadrature excitation and quadrature reception with a birdcage or transverse electromagnetic (TEM) coil, when the static magnetic field strength is lower than or equal to 3 T (Katscher et al
2009, Van Lier et al 2012).
In non-quadrature excitation, however, TPA fails (Van de Moortele et al 2005, Liu et al 2013) and there are dif-ferent methods to estimate the absolute transmit phase such as in Katscher et al (2012) and Zhang et al (2013b). In Katscher et al (2012), differences in the electric properties reconstructed from different transmit elements are related to the gradient of a reference phase (e.g. receive phase of a particular receive element). Polynomial approximation is then made for the reference phase distribution and the polynomial coefficients are estimated by solving (with regularization) the linear equation system relating the aforementioned differences to the coef-ficients and the B+
1 magnitude maps. Once the reference phase distribution is obtained, absolute transmit phases of all channels are found from the measured relative phase information. In Zhang et al (2013b), the absolute transmit phase derivatives are estimated by solving a set of equations for each pixel making use of the proton density corrected estimates of B−
1 (B−1 = (Bx− iBy)∗/2) as well as B+1 maps for each channel and Gauss’s law for magnetism (∇ · B = 0). The absolute phase distribution is then obtained by integrating its gradient. In Katscher
et al (2012) and Zhang et al (2013b), since the method chosen for EP reconstruction assumes negligible gradients of the EPs, phase estimation near tissue boundaries can become less reliable. In Liu et al (2013), concepts similar to the ones in Katscher et al (2012) and Zhang et al (2013b) are used, and it is shown that gradient of absolute transmit phase for all channels can be obtained from measured relative phases and the B+
1 maps only. Finally, in the EPT approaches (Liu et al 2015, 2016), a similar formulation is derived whereby the spatial derivatives of the absolute transmit phase can be estimated, this time without assuming negligible gradients of the EPs. In Liu et al (2013, 2015), Liu et al (2016) the absolute phase can also be derived by integration, starting from a seed point. However, these methods require many transmit-receive experiments.
In this study, we propose a simpler method to determine the phase of the transmit field in an eight port micro-strip transceiver TEM array for the case of non-quadrature excitation in 3 T. The proposed method requires a single additional quadrature driven MRI experiment. The developed ideas are tested in the framework of simu-lations and MRI experiments with the use of four different non-quadrature drive configurations. It has been observed that the simulated and experimentally acquired transmit phase distributions tend to have a strong con-sensus which supports the validity of the proposed method. Finally, the estimated transmit phase distribution of non-quadrature drive is used in the Helmholtz’s equation based standard MR-EPT (Voigt et al 2011) to get the conductivity reconstructions in order for the validation of its eligibility in MR-EPT studies.
2. Theory
Commencing with the theory of the accumulated phase on a single channel of the TEM array in a sequence execution, the step-by-step transmit phase retrieval procedure for quadrature and non-quadrature drive are given in the following sections.
2.1. Accumulated phase on a single channel of the TEM array
The phase value at location r on the MRI image, being acquired with the kth channel where k ∈ {1, 2, 3, ..., 8} can be expressed as (Van de Moortele et al 2005, Van Lier et al 2012):
Φk(r) = φB−∗ 1k (r) + φB + 1(r) + φ(0,k)+ φ∆B0(r) + φres(r) (1) where φB−∗
1k (r) is the receive phase of the kth channel, φB +
1(r) is the phase of the transmit field when either all of the
channels or only some channels are transmitting, and φ(0,k) is the position independent zero-order phase offset of the kth channel being dependent on the connecting cable lengths, phase response of the receive amplifiers, and the spatial position of the receiver channel on the circular structure of the coil. The last two terms in equation (1), φ∆B0(r) and φres(r) are the phase contribution due to B0 and eddy currents, respectively. Their effect will be
neglected in our studies assuming that the the balanced steady state free precession (bSSFP) sequence is used (Katscher et al 2009).
2.2. Quadrature drive B+
1 phase retrieval
In order to obtain the circularly polarized B+
1 field, imitating the field in a quadrature driven birdcage coil (from two ports), the eight-channel TEM coil array is driven with phase increments of 45° among adjacent channels. This eight-channel drive configuration of the TEM array is also referred to as the ‘quadrature drive’ in the context of this study. To retrieve the transmit phase in this configuration, we propose the use of transceive phase approximation (TPA). However, the eight receive phases from eight channels need to be merged to converge on a single volume receive phase in order for the proper use of the TPA.
In the quadrature drive, the eight channel TEM array can also be used as a birdcage-like volume receive coil if during reception, the signals acquired from different channels are combined with proper phase increments (Van de Moortele et al 2005). These ‘proper’ phase increments are required to eliminate the zero-order phase term (φ(0,k)) in equation (1).
For quadrature excitation, the transceive phase of the volume coil configuration (φquadBtrc
1 (r)) for an eight
chan-nel TEM array can be calculated from the MRI images obtained from individual receive chanchan-nels as in equa-tion (2): φquadBtrc 1 (r) = arg 8 k=1 pk(r)ei(−φ(0,k)) (2) where pk(r) is the complex MRI image pixel value at location r which is obtained with the kth receive channel.
Moreover, φ(0,k) is the zero order phase offset of the kth channel, being mentioned in equation (1). Ideally, if the phase responses of the RF pre-amplifiers and receive cable lengths were precisely equivalent, this zero-order phase would have only been dependent on the spatial position of the receive channel and attain a value of 45° among adjacent channels. However, additional phase increments due to hand-made receive pre-amplifiers turn out to be different, and therefore, estimating this additional phase offset is accomplished by averaging the phase of a small region of interest (ROI) in the middle of the phantom with equation (3), as used in Van de Moortele
et al (2005). φ(0,k) arg roi pk(r) |pk(r)| . (3) Approximation of the zero-order phase terms of kth channel in equation (3) originates from the theory that the transceive phases acquired from each channel need to attain the same value in the middle of an EP-wise sym-metrical phantom (Van de Moortele et al 2005). Equation (2) makes the zero-order phase term correction by arbitrarily setting the averaged phases at the center of the phantom to zero for all of the channels. With the offset-corrected volume transceive phase in equation (2), the volume transmit phase is approximated by the transceive phase approximation as in the following:
φquadB+ 1
(r) = φquadBtrc 1 (r)/2.
(4)
2.3. Non-quadrature drive B+1 phase retrieval
After acquiring the TPA approximated transmit phase using the above procedure, as a by-product, the offset corrected receive phase of the kth channel can be calculated as:
φB−∗
1k (r) = arg
exp iφquadBtrc 1k (r)
exp iφquadB+
1 (r)
(5)
where φquadBtrc
1k (r) is the transceive phase, retrieved with the kth channel during the quadrature drive and φ
quad B+
1(r) is
the quadrature drive volume transmit phase obtained with equation (4). These receive phases are specific for each receive channel and will be equivalent in quadrature and non-quadrature drive experiments.
The volume transmit phase of the non-quadrature drive (φnonB+-quad
1 (r)) can be calculated using one of the
receive channels with the following formula: φnonB+-quad
1k (r) = arg
exp iφnon-quad Btrc 1k (r) exp iφB−∗ 1k (r) exp iφ(0,k) (6)
where φnonBtrc-quad
1k (r) is the transceive phase acquired from the kth channel during the non-quadrature drive. It
equation (6) for offset correction. It is expected that equation (6) would yield the same result, irrespective of the channel being used, i.e. same result for every channel. Therefore, the average of the transmit phases, being found from eight channels can also be used.
3. Methods
3.1. Simulations and RF inputs for non-quadrature drive
Finite element method (FEM) based simulations in Comsol Multiphysics® (COMSOL AB, Stockholm, Sweden) were performed not only for having a comparison between the simulated and experimentally acquired transmit phases, but also for determining the RF inputs of the TEM array in non-quadrature drive.
Simulation model of the eight port TEM array, being depicted in figure 1(a) is extensively given in Ariturk and Ider (2018). This decoupled coil array has a radius of 15 cm (from the center to the middle of each microstrip line element) and a length of 30 cm. Microstrip lengths and widths of each line element are given as 26 cm and 2 cm. The dielectric material between microstrip conductors is chosen as plexiglass with a thickness of 1 cm and a relative dielectric constant of r= 3.6 to have a characteristic impedance of approximately 50 Ω. Matching,
tun-ing and decoupltun-ing capacitors are depicted with their capacitance values in figure 1(a). The cylindrical simula-tion phantom, having a background conductivity of 0.5 S m−1 and two cylindrical anomalies with σ = 1 S m−1 is shown in figure 1(b). Outer radius of the phantom is given as 8 cm and the radii of each anomaly are 1.5 cm. The relative permittivity and permeability values in the entire phantom are given as r= 80 and µr= 1, respectively.
RF inputs for the non-quadrature drive are found by optimizing the phases of RF input signals (φRF1, φRF2, ...φRF8) applied from the ports of the TEM array, such that the magnitude of the constructed B
+ 1 distribution in a square shaped ROI (shown in figure 1(b)) is similar to the desired discrete B+
1 distribution,
B1+,goal (depicted in figure 1(c)). This method is similar to the ones in Van den Berg et al (2007) and Van den Ber-gen et al (2007), however, only the phases of the input RF signals are optimized as in Ibrahim et al (2000) (same magnitude for every channel). It can be seen that B1+,goal has a high field region, a low field region, and a sharp transition in the middle. B1+(θ) vector is the discretized version of the continuous B+
1 field inside the coil and it is dependent on the RF input phase vector θ = [φRF1, φRF2, ...φRF8]T. Using the superposition principle, B1+(θ)
can be written as in the following:
B1+(θ) = 8 n=1 e(iφRFn)B1n+(1V, 0◦) (7) where B1n+(1V, 0◦) represents the discretized B+
1 distribution when all the channels except channel n is terminated with the reference impedance (50 Ω) and channel n is driven by 1 V RF amplitude and 0° phase offset. In this regard, the θ dependent cost function is given as:
C(θ) = M i=1 (|B1+ i (θ)| − |B1 +,goal i |)2 (8) where B1+,goali and B1+
i (θ) represent the ith elements of the B1+,goal and B1+(θ) vectors, respectively.
Furthermore, M denotes the total number of elements in each vector. The cost function is minimized with the steepest descent method of the ‘Optimization Toolbox’ of Matlab® (Mathworks, Natick, MA) to get the input RF phases. As the top part of the B1+,goal is the low field region, this is called as the ‘Top Shadowed’ excitation configuration. The other non-quadrature drive configurations are its rotated versions and are called as the ‘Right’, ‘Left’, and ‘Top-Right’ shadowed excitation configurations. Their RF input phases are demonstrated
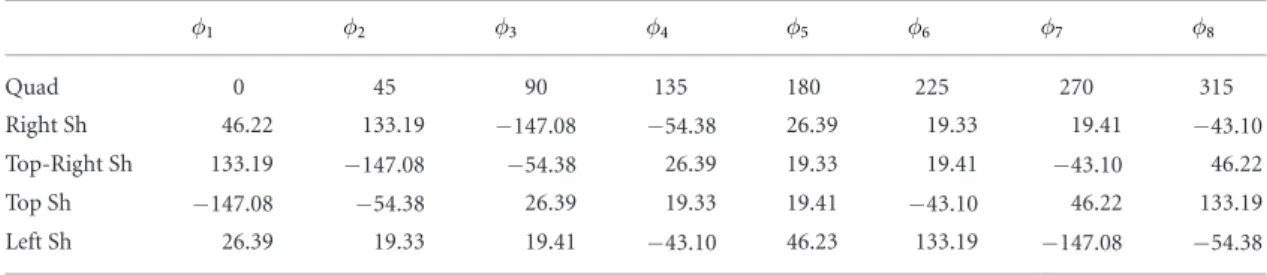
Figure 1. (a) Simulation model of the empty eight-channel TEM array. Cm is the matching, Ct is the tuning and Cd is the decoupling
capacitor with 2.5 pF, 31.5 pF and 1.5 pF capacitances, respectively. (b) Cylindrical simulation phantom with two cylindrical anomalies, shown inside the coil. Background conductivity is 0.5 S m−1 and the conductivities inside the anomalies are 1 S m−1 each.
in table 1. It should be noted that the optimization procedure is applied for an EP-wise homogeneous phantom, where the anomalies in figure 1 have the same EP’s as in the background.
3.2. MRI experiments
3.2.1. Multichannel microstrip TEM array, RF front end, and experimental phantom
The eight-channel TEM array, which was designed to operate at 123.2 MHz, is constructed at home and the PLA based white coil casing is produced by ArtiBoyut® (Ankara, Turkey) company. The complete experimental setup including the TEM array, RF switch, and the experimental phantom is depicted in figure 2.
The constructed coil has the same dimensions as the simulation model given in section 3.1. Capacitance val-ues of the shunted tuning capacitors were designed to be 31 pF in simulations, however 27 pF capacitors are used at both ends of the coil. In parallel to the 27 pF capacitors on the back end of the coil, variable capacitors (Knowles Voltronics 1–23 pF Non-Magnetic 750 V Trimmer, Part Number: NMAJ25HV) are used for tuning. Further-more, the same type of variable capacitors are used in series for impedance matching in the front part of the array. S-parameters of the loaded coil are measured with a network analyzer (Agilent ENA E5061A 300 kHz–1.5 GHz) and are depicted in figure 2(g). As it can be seen, all of the reflection coefficients (S11, S22, ..., S88) attain a value of approximately −40 dB at 123.23 MHz and the isolation of the ports are at −14 dB at the worst case, which is suf-ficient (Adriany et al 2005, Vernickel et al 2007, Shajan et al 2011).
The coil is used with an eight-channel hand-made RF transmit-receive (TR) switch including the RF pre-amplifiers which were designed and fabricated in the National Magnetic Resonance Research Center (UMRAM) (Ankara, Turkey). The RF front-end is conceptually very similar to the one in Shajan et al (2011), however it is designed for 3 T MRI scanners. Gains of the receive pre-amplifiers are in the range of 21–24 dB at an input source power of −20 dBm and the noise figures are in the range of 1.3–1.6 dB. Transmit-receive isolation of all of the eight channels of the switch are less than −25 dB, which is acceptable. The complete RF front end, including the coil, is shown in figure 2.
Transmission and reception are accomplished with the aforementioned hand-made RF front end, which is driven with an eight channel transmitter array system of Siemens Tim Trio 3 T MRI scanner. The eight trans-mitter channels (1 master + 7 slave) of the scanner allows the user to scale the RF input magnitudes and adjust their phases. In the beginning of the experiments, the optimal operating frequency is approximately found as 123.23 MHz, which is compatible with the coil measurements. In a single experiment, the RF signal magnitude, which is the same for all channels, is optimized by the scanner. The transmit phases for quadrature and four non-quadrature excitations are the same as in the simulations and are shown in table 1.
The agar phantom is prepared in a cylindrical flask of radius 7 cm and a height of 20 cm. Within the phantom, two cylindrical anomalies of 1.5 cm radius are located 5 cm apart with respect to their centers. The phantom has a background of agar-saline solution with 20 gr l−1 agar, 2 gr l−1 NaCl, and 3 gr l−1 CuSO4, and two equivalent cylindrical anomalies of saline solution with 6 gr l−1 of NaCl and 3 gr l−1 CuSO4 each. With these concentrations, the electrical conductivity is expected to be 0.5 S m−1 in the background and 1 S m−1 in the anomalies (Hafalir
et al 2014).
3.2.2. MRI sequences
For all of the experiments, magnitude of the transmit field (|B+
1|) was found by the double angle method (Stollberger and Wach 1996). For each drive, two successive gradient recalled echo (GRE) sequence executions with 60◦ and 120◦ flip angles were performed. The remaining parameters of the GRE sequences are:
FOV =150 mm, TE/TR = (5 ms)/(1500 ms), 2D single slice with voxel size: 1.2 × 1.2 × 5 mm, 2 averages. A single GRE execution takes approximately 6 min.
For the retrieval of the transceive phases, bSSFP sequence is used with the following parameters: FOV =150 mm, TE/TR = (2.34 ms)/(4.68 ms), FA = 40◦, 2D single slice with voxel size: 1.2 × 1.2 × 5 mm, 256 averages (32 acquisitions × 8 measurements). A single sequence execution takes approximately 2.5 min.
Table 1. The RF input phases (in the unit of degrees) for the quadrature drive and the four non-quadrature drive configurations: Top
shadowed, Top-Right shadowed, Right shadowed and Left shadowed. These phases are used both in simulations and experiments.
φ1 φ2 φ3 φ4 φ5 φ6 φ7 φ8 Quad 0 45 90 135 180 225 270 315 Right Sh 46.22 133.19 −147.08 −54.38 26.39 19.33 19.41 −43.10 Top-Right Sh 133.19 −147.08 −54.38 26.39 19.33 19.41 −43.10 46.22 Top Sh −147.08 −54.38 26.39 19.33 19.41 −43.10 46.22 133.19 Left Sh 26.39 19.33 19.41 −43.10 46.23 133.19 −147.08 −54.38
3.3. MR-EPT method
The experimentally calculated transmit phase (φB+
1) is used in the Helmholtz’s equation based standard
(conventional) MR-EPT (Voigt et al 2011). In this method, electrical conductivity (σ) is found by σ = Re{ ∇2H+
jωµ0H+} where ω = 2πf0, f0 is the Larmor frequency, H
+ is the transmit field such that H+= B+ 1/µ0 and µ0 is the permeability of free space.
3.4. Testing the algorithm
As there is no straightforward algorithm to obtain the ground-truth absolute transmit phase, it was checked whether the experimentally estimated phase patterns comply with the following criteria or not.
Figure 2. The complete RF front end including the RF coil, TR switch and connection cables. (a) Constructed eight channel TEM
array, being designed in Ariturk and Ider (2018). (b) The bare coil viewed from front end. Cm is the matching capacitor. (c) The
complete RF front end. (d) RF circuitry of the one channel of the TR switch, (e) the coil with casing, under measurements, (f) the complete experimental setup. (g) S-parameters of the constructed coil. S11, S22...S88 are the reflection coefficients and S21, S31...S81,
1. The experimentally estimated transmit phase distribution needs to resemble the simulated ones, 2. Equation (6) should yield the same resultant volume transmit phase when the transceive phase for any of
the eight channels is used.
3. Estimated transmit phase patterns of the non-quadrature excitation configurations need to comply with the ‘phase-incremented rotation’ condition.
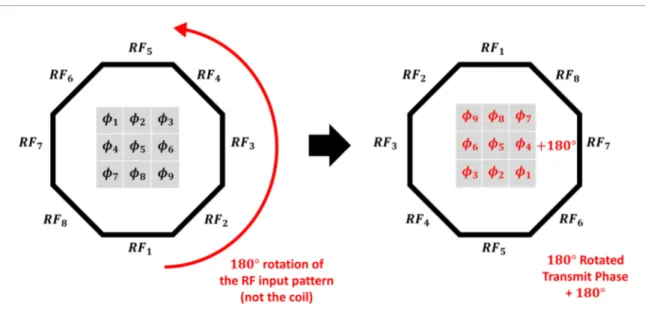
To understand the phase-incremented rotation condition, it needs to be recalled that the driving configurations of the non-quadrature drive cases are the rotated versions of each other. Therefore, the transmit phases of these excitation configurations also need to be the rotated versions of each other. Furthermore, a phase offset in the overall transmit phase should also be observed between two non-quadrature drive configurations (Van de Moortele et al 2005). For instance, the RF input pattern of Left shadowed excitation is the circularly 180° rotated version of the input pattern of Right-shadowed excitation, as depicted in figure 3. In this scenario, it is expected that the transmit phase pattern of Right shadowed excitation is spatially 180° rotated and also 180° phase incremented version of the Left shadowed drive, as also shown in figure 3. This condition is also verified in the experimental results with the addition of artificial phases.
4. Results
4.1. Receive and non-quadrature transmit phase extractions
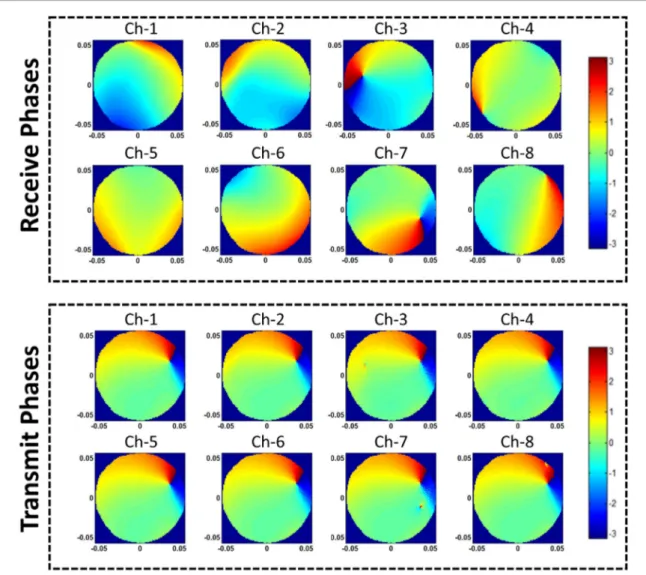
The experimental receive phases of each individual channel, being found in equation (5), are demonstrated in figure 4. As it can be seen, the receive phase distributions tend to have a rotational variation among adjacent channels.
Furthermore, the experimentally estimated transmit phase distributions of the Right-shadowed drive, being calculated from each receive channel with equation (6) are also depicted on the same figure. As it can be seen, they are observed to be very similar. This strong similarity actually verifies the second condition of the testing criteria in the previous section. The transmit phase patterns of each channel for other non-quadrature cases are not included.
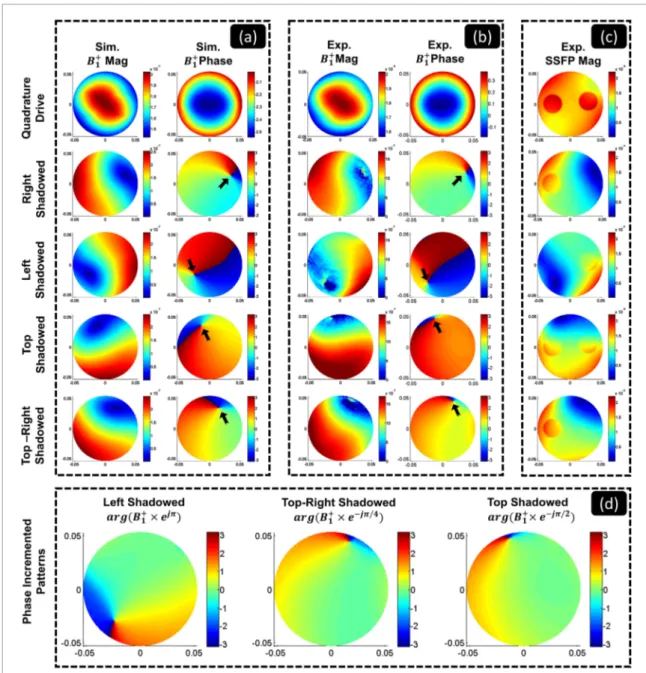
4.2. SSFP magnitude, B+1 magnitude and phases
B+
1 magnitude and B+1 phase images for the quadrature and also the non-quadrature (i.e. Top, Right, Left, Top-Right shadowed) drives are demonstrated in figure 5. That figure illustrates the results of both simulations and experiments. It should be noted that the result of the channel with the best SNR (estimated with equation (6)) is used in the experimental B+
1 phase images. The experimental bSSFP magnitude images are also depicted on the same figure.
Considering the quadrature drive, it can be observed that the B+
1 magnitude image has a central brightening pattern, both in simulations and experiments. This pattern is slightly disturbed by the conductive anomalies of the phantom. On the other hand, magnitude of the quadrature driven bSSFP image has increasing intensities at the top left and bottom right parts, due to different gains from hand-made receive pre-amplifiers.
Figure 3. Phase-incremented rotation between two non-quadrature excitation configurations. If the RF input pattern (not the coil)
Regarding the experimental transmit phase image of the quadrature drive in figure 5(b), which was found by equation (4), a paraboloid shaped classical quadrature drive volume phase pattern is observed, being very similar to the simulated quadrature drive phase distribution in figure 5(a).
Considering all of the non-quadrature drive configurations, the magnitude of the transmit fields in simula-tions and experiments turn out to be highly similar, as it can be seen in figures 5(a) and (b). For the experimental results, on the other hand, it is observed that the image quality is significantly reduced in the regions where B+ 1 magnitude is low (the ‘shadowed’ regions), due to low signal to noise ratio (SNR) values.
The experimentally found non-quadrature transmit phase estimations, depicted in figure 5(b) are also simi-lar to the ones found in simulations, as shown in figure 5(a). In the transmit phase patterns, large phase excur-sions, being located at the center of the regions where B+
1 magnitude significantly drops, are observed as empha-sized with the arrows in figures 5(a) and (b).
Evaluating the results shown in figure 5, it should be noticed that the B+
1 phase extraction pattern resem-blances between simulations and experiments are stronger for the quadrature excitation than the ones in non-quadrature drive cases. One predominant reason for this issue can be suggested as the difference between simulated and experimental channel coupling performances. It was indeed observed in simulations that slight variations in channel coupling—when such asymmetrical non-quadrature excitations are employed—yield considerably different transmit phase patterns within the sample.
In order to verify the phase-incremented rotation condition in MRI experiments, as described in section 4, proper phases are added to the experimentally acquired transmit phases in Left shadowed, Top shadowed and Top-Right shadowed excitations to verify whether they imitate the rotated versions of the right shadowed one. When phase offsets of 180◦, −45◦ and −90◦ are added to the Left, Top-Right and Top shadowed complex B+
1 dis-tributions, their phase patterns become very similar to the spatially 180◦, −45◦ and −90◦ rotated versions of the
phase pattern of the Right-shadowed configuration, as depicted in figure 5(d).
Figure 4. Experimental results: receive phases of channels 1–8 (being found with equation (5)) are demonstrated in the upper box. In the lower one, the volume transmit phase distribution of the Right shadowed excitation, being obtained from each channel, is depicted. For all of the images, horizontal axis is for x(m) and vertical axis is for y(m).
The observed consensus between the experimental and simulation results and the compliance of the exper-imental results with the phase incremented rotation condition turn out to be two majorly important points in the assessment of the accuracy of the transmit phase estimations.
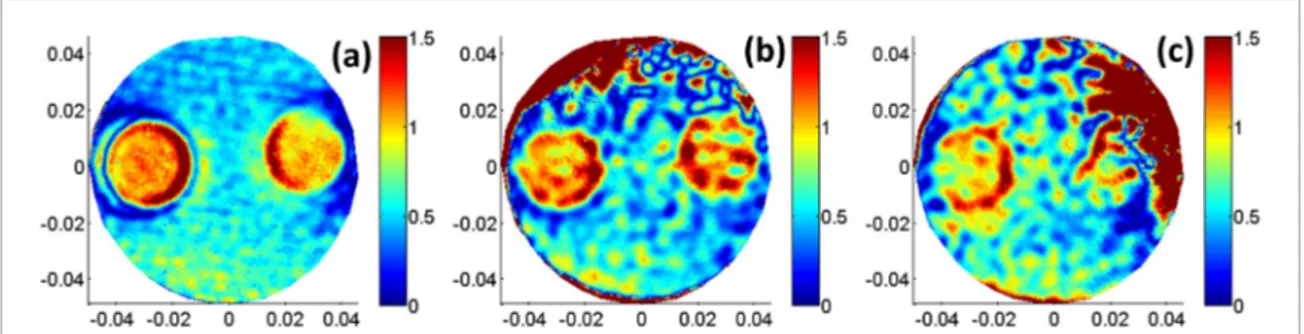
4.3. Conductivity reconstructions
The experimental conductivity reconstructions obtained with the standard MR-EPT method for the quadrature drive and also for the two non-quadrature drive (top and right shadowed) configurations are shown in figure 6. As expected, the best conductivity reconstructions are obtained with the data of quadrature drive, as it has the best SNR values (figure 6(a)). The artifacts along anomaly boundaries are typical of the standard MR-EPT method as it makes the local homogeneity assumption (LHA). Otherwise, the background conductivity of 0.5 S m−1 and the conductivities of anomalies with 1 S m−1 are accurately reconstructed.
Among the two non-quadrature drive configurations, similar behavior in the conductivity reconstructions are observed. Regarding the the distinguishability between background and anomalies, they have similar perfor-mance. However, the regions with low B+
1 magnitude tend to be highly distorted, as expected. Furthermore, the overall image quality is also reduced compared to the quadrature drive conductivity reconstruction because of noise contamination in B+1 phase distributions, originating from the several steps of post-processing involved in extracting the non-quadrature transmit phases.
Figure 5. Comparison of the simulated and experimental results for the quadrature and four different non-quadrature drive
configurations. (a) Simulated B+
1 magnitude and phase distributions, (b) experimental B+1 magnitude and experimental B+1 phase
patterns, (c) experimental bSSFP magnitude images, (d) software-wise phase incremented versions of the experimentally estimated phase pattern of the left, top-right and top shadowed drive configurations to test the phase-incremented rotation condition. For all of the images, horizontal axis is for x(m) and vertical axis is for y(m).
5. Conclusion and discussion
Throughout this study, a simple and experimentally less demanding method to estimate the non-quadrature drive B+
1 phase distribution has been proposed. The method is tested in the framework of simulations and MRI experiments. It is observed that the three significant points given in the criteria to evaluate the accuracy of phase estimations have been met. With the support of these three aspects, the proposed method is a nice candidate to be used in MR-EPT studies, as it requires only two B+
1 magnitude and phase estimations which shortens the total MRI data acquisition time.
It should be pointed out, however, that computational procedures used throughout equations (1)–(7) decrease the SNR of the acquired data, hence, reducing the performance of the MR-EPT techniques. To acquire MRI images with higher SNR, the use of multichannel degenerate birdcage coil (Alagappan et al 2007), receive-only loop arrays, or transceiver loop arrays (Pinkerton et al 2005) can be considered. Using receive-only loop coil arrays, the validity of TPA may become questionable and additional quadrature drive experiments can be needed to get the transmit phase of the transmitter coil (Liu et al 2016). On the other hand, use of wisely positioned loop arrays as transceiver antennas can provide higher SNR values within the periphery but lower SNR values at the central regions of the sample (Pinkerton et al 2005), latter being the main ROI in our studies. However, the overall SNR advantage of loop arrays (and degenerate birdcage coil) make them potentially feasible for use.
In addition to its use in MR-EPT studies, this method can also be used in the SAR estimation studies for find-ing the complex B+
1 field distribution when non-quadrature excitation is employed.
Regarding the validity of TPA, it was argued in Van Lier et al (2014) and Balidemaj et al (2015) that the ratio between the axial dimensions of the sample and the RF wavelength is an important factor and that this ratio is acceptable for human head sized samples in 3 T or lower systems. Since we also use a head-sized phantom and coil in a 3 T system, the method proposed in our study for absolute transmit phase estimation should also have acceptable accuracy. On the other hand, use of ultra high field systems (>3 T) and/or greater samples sizes (e.g. torso, pelvis, etc.) will result in discrepancies between transmit and receive phase patterns, especially at the non-central regions of the sample in quadrature drive, hence, reducing the accuracy of the approximated transmit phase pattern in those regions of the sample (Van Lier et al 2014, Balidemaj et al 2015).
Acknowledgment
This work was supported by The Scientific and Technological Research Council of Turkey (Tubitak) under Grant 114E522. The MRI experiments and coil measurements were conducted in the National Magnetic Resonance Research Center (UMRAM). The authors thank to Prof Ergin Atalar and Taner Demir for their support in the use of the MRI Scanner and the RF pre-amplifiers.
ORCID iDs
Gokhan Ariturk https://orcid.org/0000-0001-7920-1275
Yusuf Ziya Ider https://orcid.org/0000-0002-1961-6804
References
Abraham R and Ibrahim T S 2007 Proposed radiofrequency phased-array excitation scheme for homogenous and localized 7 Tesla whole-Body imaging based on full-wave numerical simulations Magn. Reson. Med. 57235–42
Adriany G et al 2005 Transmit and receive transmission line arrays for 7 Tesla parallel imaging Magn. Reson. Med. 53434–45
Alagappan V et al 2007 Degenerate mode band-pass birdcage coil for accelerated parallel excitation Magn. Reson. Med. 571148–58 Figure 6. Experimental conductivity reconstructions: standard MR-EPT reconstructions of the quadrature drive, top shadowed
and right shadowed excitation configurations in (a),(b), and (c), respectively. For all of the images, horizontal axis is for x(m) and vertical axis is for y(m).
Ariturk G and Ider Y Z 2018 Optimal multichannel transmission for improved cr-MREPT Phys. Med. Biol. 63045001
Balidemaj E, Van Lier A L H M W, Crezee H, Nederveen A J, Stalpers L J A and Van den Berg C A T 2015 Feasibility of electric property tomography of pelvic tumors at 3 T Magn. Reson. Med. 731505–13
Cunningham C H, Pauly J M and Nayak K S 2006 Saturated double-angle method for rapid B1 mapping Magn. Reson. Med. 551326–33
Hafalir F S, Oran O F, Gurler N and Ider Y Z 2014 Convection-reaction equation based magnetic resonance electrical properties tomography (cr-MREPT) IEEE Trans. Med. Imaging 33456–66
Ibrahim T S 2006 Ultrahigh-field MRI whole-slice and localized RF field excitations using the same RF transmit array IEEE Trans. Med. Imaging 251341–7
Ibrahim T S, Lee R, Baertlein B A, Kangarlu A and Robitaille P M L 2000 Application of finite difference time domain method for the design of birdcage RF head coils using multi-port excitations Magn. Reson. Med. 18 733–42
Katscher U, Findeklee C and Voigt T 2012 B1-based specific energy absorption rate determination for nonquadrature radiofrequency
excitation Magn. Reson. Med. 681911–8
Katscher U et al 2009 Determination of electric conductivity and local SAR via B1 mapping IEEE Trans. Med. Imaging 281365–74
Liu J, Van de Moortele P F, Zhang X, Wang Y and He B 2016 Simultaneous quantitative imaging of electrical properties and proton density from B1 maps using MRI IEEE Trans. Med. Imaging 352064–73
Liu J, Zhang X, Schmitter S, Van de Moortele P F and He B 2013 Determining electrical properties based on B1 fields measured in an MR scanner using a multi-channel transmit/receive coil: a general approach Phys. Med. Biol. 584395–408
Liu J et al 2015 Gradient-based electrical properties tomography (gEPT): a robust method for mapping electrical properties of biological tissues in vivo using magnetic resonance imaging Magn. Reson. Med. 74634–46
Pinkerton R G, Barberi E A and Menon R S 2005 Transceive surface coil array for magnetic resonance imaging of the human brain at 4 T Magn. Reson. Med. 54499–503
Sacolick L I, Wiesinger F, Hancu I and Vogel M W 2010 B1 mapping by Bloch–Siegert shift Magn. Reson. Med. 631315–22
Shajan G, Hoffmann J, Budde J, Adriany G, Ugurbil K and Pohmann R 2011 Design and evaluation of an RF front-end for 9.4 T human MRI Magn. Reson. Med. 66596–604
Stollberger R and Wach P 1996 Imaging of the active B, field in Vivo Magn. Reson. Med. 35246–51
Van de Moortele P F et al 2005 B1 destructive interferences and spatial phase patterns at 7 T with a head transceiver array coil Magn. Reson.
Med. 541503–18
Van den Berg C A T et al 2007 Simultaneous B+
1 homogenization and Specific absorption rate hotspot suppression using a magnetic
resonance phased array transmit coil Magn. Reson. Med. 57577–86
Van den Bergen B, Van den Berg C A T, Bartels L W and Lagendijk J J J W 2007 7 T body MRI: B1 shimming with simultaneous SAR reduction
Phys. Med. Biol. 525429–41
Van Lier A L H M W, Raaijmakers A, Voigt T, Lagendijk J J W, Luijten P R, Katscher U and Van den Berg C A T 2014 Electrical properties tomography in the human brainat 1.5, 3, and 7 T: a comparison study Magn. Reson. Med. 71354–63
Van Lier A L H M W et al 2012 B+
1 phase mapping at 7 T and its application for in vivo electrical conductivity mapping Magn. Reson. Med.
67552–61
Vernickel P et al 2007 Eight-channel transmit/receive body MRI coil at 3 T Magn. Reson. Med. 58381–9
Voigt T, Katscher U and Doessel O 2011 Quantitative conductivity and permittivity imaging of the human brain using electric properties tomography Magn. Reson. Med. 66456–66
Zhang X, Schmitter S, Van de Moortele P F, Liu J and He B 2013a From complex B1 mapping to local SAR estimation for human brain MR imaging using multi-channel transceiver coil at 7 T IEEE Trans. Med. Imaging 321058–67
Zhang X, Van de Moortele P, Schmitter S and He B 2013b Complex B1 mapping and electrical properties imaging of the human brain using a