Running head: Category training affects colour discrimination in the RVF/LH.
Category training affects colour discrimination but only in the right visual field.
Gilda Vasiliki Drivonikou*, Alexandra Clifford*, Anna Franklin*, Emre Özgen¶ and Ian Davies*
*University of Surrey, ¶ Bilkent University
Address for correspondence: Professor Ian Davies
Department of Psychology University of Surrey Guildford Surrey GU2 7XH UK [email protected]
E-mail: [email protected] Language: British English
Abstract
There is indirect evidence that categorical colour perception (better
discrimination of colours from different categories than those from the same category — CP) can be learned. For instance, CP can be induced across a newly learned category boundary (Özgen & Davies, 2002). Here we replicate and extend Özgen and Davies’s category learning study, to try and pinpoint the nature of the changes underlying category learning.
Participants learned to divide green into two new categories ‘yellow-green’ / ‘blue-green’ across four days. The trained group showed CP across the new boundary on a target detection task and this was restricted to the left
hemisphere (LH; cf. Drivonikou et al. 2007), whereas the controls did not. The results could suggest that category training produces changes at early stages in visual processing mainly in the LH.
Keywords: colour, perceptual learning, categorical perception, left-hemisphere.
1. Introduction
Overview
In this chapter, we present evidence that learning new colour categories changes colour discrimination. In particular, discrimination between colours crossing the category boundary is improved relative to
discrimination of colours within the new categories. This pattern is the signature of ‘categorical perception’ (CP) of colour (Harnad, 1987). However, this newly learned CP only occurs for stimuli presented to the right of where we are looking (right visual field; RVF). As the information in the RVF is first sent to the left half of the brain, and this hemisphere is responsible for language, it may suggest that language is involved in colour CP.
We begin by outlining the nature of the neural pathways from eye to brain that enable the behavioural isolation of the two hemispheres, at least for briefly presented stimuli. We then move on to review briefly previous findings, before describing the experiment and its results.
Background
The optics of the eye combined with the neural pathways from the retina to visual cortex, result in stimuli in the right visual field (RVF) being initially represented in the left hemisphere (LH) of the brain and stimuli in the left visual field (LVF) being initially represented in the right hemisphere (RH), as shown in Figure 1.
This initial segregation of information from the two visual fields has been exploited to investigate whether the two hemispheres of the brain might have different specialist functions. If stimuli are presented briefly (less than 200 ms) in just one visual field, the information is initially available to just the contralateral hemisphere. If the hemispheres differ in their capabilities, then comparing performance when stimuli are presented either in the left or right visual field can reveal differential specialisations. For instance, word recognition is better for RVF (LH) stimuli than for LVF (RH) stimuli.
Very recently, it has been discovered that the phenomenon of categorical perception (CP) of colour is stronger for RVF (LH) stimuli than for LVF (RH) stimuli (e.g., Drivonikou, Kay, Regier, Ivry, Gilbert, Franklin & Davies, 2007; Gilbert, Regier, Kay & Ivry, 2007). Colour CP is shown by better discrimination of colours that straddle a category boundary than of colours from the same category. For instance, Drivonikou et al. found that detecting the location of a small coloured target on a differently coloured background, was faster when the target and background were categorically different (e.g., blue1 on green1) than when they were just physically different (blue1 on blue2). However, this categorical effect was
substantially more pronounced for RVF (LH) targets than for LVF (RH) targets.
As the LH is also the ‘language hemisphere’ Gilbert et al. speculated that the LH bias in colour CP reflects the influence of language on perceptual processes in the LH. Evidence that left hemisphere dominance of colour CP does not arise until colour terms are learned supports this speculation. Colour CP in infants and toddlers — before the acquisition of colour terms — is lateralised to the right hemisphere (RH), and the category effect appears to switch to the LH around the time that the relevant colour terms are learnt (Franklin, Drivonikou, Bevis, Davies, Kay, & Regier, 2008; Franklin, Drivonikou, Clifford, Kay, Regier, & Davies 2008). Learning
colour terms may highlight similarities among colours given the same term and highlight differences among colours given different terms, leading to within-category compression and between-category expansion of perceptual colour space, particularly for RVF (LH) stimuli.
There is evidence that the plasticity of colour categories apparent during child development might persist into adulthood. For example, Goldstone (1994) showed that learning to categorise stimuli varying in shape and lightness induced CP across the newly learned boundary (see also Goldstone, 1998; Goldstone, Lippa & Shiffrin, 2001). Indeed, Schyns, Goldstone and Thibaut (1998) argue that in general, category structure is adaptive, and adjusts to meet tasks demands. There is also evidence that the neuro-physiological substrate of these perceptual changes may occur at early stages of visual processing. For instance, changes have been observed in the tuning of orientation sensitive neurons in V1 (the first visual area in the cortex) resulting from practising orientation discrimination (Schoups, Vogels, Qian, and Orban, 2001.
Consistent with the idea of sustained category plasticity, Özgen and Davies (2002) found that learning to divide blue or green into two new categories with the boundary at the category prototype induced CP around the newly learned boundaries. Before training, discrimination was worst around the category prototypes (a form of the perceptual magnet effect, Kuhl, 1991), whereas after training, discrimination peaked across the new boundary.
The current study
Although Özgen and Davies showed newly acquired CP, they did not investigate whether the categorical effect varied with the visual field that the stimuli appeared in. Hence, it is not known whether newly learned CP shows the same LH bias found by Gilbert et al. and others. The current study sought to address this issue. Participants learned to divide green into
two new categories (A and B) using the same methods as Özgen and Davies, but assessed the effect of learning using Drivonikou et al.’s target detection task which had revealed LH bias in CP. On each trial, a single circular target of one colour appeared on a chromatically different, uniform background. The target and the background could belong either to the same category, e.g., A1 on A2, or to different categories, e.g., A1 on B1.
If LH lateralised CP were found following categorisation training, it would provide converging evidence of the role of language in colour CP.
As our experiment was based on combining tasks from previously published work (Özgen & Davies, 2002 for the category training task, and Drivonikou et al., 2007) we chose to replicate (in all essentials) the methods from the two tasks. One potential drawback of doing so was that the colours in the category-training task and in the target detection task appeared in different contexts. In context training, the first colour appeared against a grey background, and as the task proceeded, the number of comparison colours increased, until finally, there were 16 different greens in the display. In the target detection task, each trial started with 1000 ms of black screen with a white fixation cross, followed by about 500 ms of the target colour on a coloured background that filled the monitor. While the difference in context in the two tasks may have induced small changes in colour appearance, we think it unlikely that these could bias the results in favour of the two hypotheses under test. There is no reason to suppose that induced colour changes would lead to improved discrimination around the newly learned boundary relative to within-category discriminations only for the training group. Moreover, we think it even less likely that any artifactual changes resulting from differing contexts would only affect discrimination in the RVF.
A training group learned to divide the green region into ‘yellow-greens’ versus ‘blue-greens’ with the category boundary centred on the green
prototype (7.5G). Following training, the target detection task was used to compare discrimination that straddled the newly learned boundary with within-category discriminations either side of the boundary. The training group were compared to a control group that just did the target detection task. If category training induced CP, the training group should show peak discrimination around the new boundary, whilst the control group should show poorest discrimination for this region. As a test that any difference between trainers and controls was due to category training, both groups also performed the target detection task for equivalent points in the blue region with no prior category training. If any differences between the groups were really due to training, then there should be no differences between them for the blue stimuli.
2. Method
Participants
Forty-nine participants (Mean Age = 20.2 years, SD = 2.12) were randomly allocated to the training group (16 females and 8 males) and the control group (19 females and 6 males). All had normal colour vision as assessed by the City Colour Vision Test, were right-handed, and English was their first language. All were students at the University of Surrey and received course credits for their participation.
Training phase
Stimuli
The test stimuli were coloured squares (5 cm2) displayed at the centre of a Sony Trinitron CRT monitor (model GDM-F520) against a background of neutral grey. Stimuli were drawn from a two-dimensional area of Munsell1
1 Munsell colours vary on three dimensions: Hue (from red (R) through
colour space: Hue 5BG-10GY (blue-green to yellow-green) by Value 5-7, at constant Chroma 6. During training, on each trial the test stimulus was drawn at random from the training region with the exception that stimuli within 0.2 Munsell hue units of the boundary were avoided (7.3G-7.7G).
Procedure
The training group performed categorisation training for three daily sessions and a refresher session on the testing day. They were seated 50 cm away and at eye-level to the monitor. During training, they learned to categorise all stimuli between 5BG and 7.3G in one category, and those between 10GY and 7.7G in the other category, irrespective of value. There were two types of category training: ‘context training’ and ‘singleton training’ with context training always occurring first.
Context training. Participants made category judgements while being able to
see examples of stimuli they had previously categorised correctly. A randomly chosen colour was presented in the centre of the screen, together with sixteen “slots” to be filled with the incoming colours divided into two groups: eight slots (two columns, four rows) on each side of the test stimulus (see Figure 2). The participants sorted the test stimuli into two groups around this boundary by placing the colour in the centre into an empty slot on the left or right using left and right arrow keys. The first colour could be placed on either side of the screen, but thereafter, colours from the same experimental category had to be placed on the same side. Immediate feedback was given: the colour remained in the slot following a correct response, but disappeared and a sound indicated ‘incorrect’ if the from zero (black) to 9 (white); and Chroma (roughly saturation or purity of the Hue). Extensive standardisation produced a set of colours so that the size of the perceived difference between pairs of colours separated by the same number of Hue steps at the same Value and Chroma would not vary across the Hue dimension.
response was incorrect. The number of colours for comparison increased with correct responses in each block (up to the maximum number of slots available: 16). When they correctly filled all sixteen slots, a “block” was complete, and a new one began; the cycle continued until the criteria for successful category learning were met. No instructions on what the
categorisation was based on were given. The first stage of training finished when at least 20 blocks were completed and there were at least three error free blocks.
@@ Insert Figure 2 about here
Singleton training. In the second stage of training, single test colours
appeared at the centre of the screen. The participant had to decide which of the two categories it belonged to by pressing left or right arrow keys. Incorrect choices were signalled by the word “incorrect” replacing the test colour, accompanied by a sound. The criteria for finishing this stage were completion of at least 250 trials and 25 consecutive correct responses.
Refresher phase. The procedure for the refresher phase on the testing day
was the same as for the training phase, except that the criteria for completing training were less stringent than on the training days. The criteria for completing context training were that at least 10 blocks were completed, and there was at least one error free block. Context training typically took about 10 minutes. The criteria for completing singleton training were completion of at least 100 trials, and 25 consecutive correct responses.
Target detection task
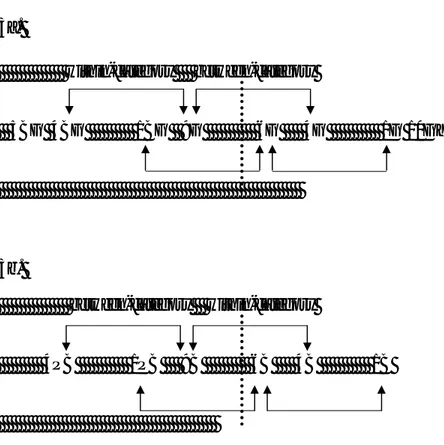
Stimuli were displayed on the same monitor as for category training. There were two within- and two between-category pairs for the green region (see Figure 3a) and two within- and two between-category pairs for the
equivalent blue region (see Figure 3b). Participants were not trained to divide the blue region into two new categories; nonetheless, for consistency and ease of reference, the equivalent pairs in the blue region are called within- and between-category pairs. Target-background separations were 5 Munsell Hue steps, with Value and Chroma constant at 6 and 6 respectively (See Table 1 for CIE Y x y chromaticity co-ordinates).
@@ Insert Figure 3 and Table 1 about here
Design
On each trial, a single circular target of 30 mm diameter appeared on a chromatically different, uniform background (~ 3.5° of visual angle from the viewing distance of 50 cm). The target could appear in one of 12 equally separated (30°) locations on a notional circle of 110 mm diameter around the fixation cross at the centre of the monitor (~12.5° from fixation). In clock face terms, six locations were in the RVF from 12:30 to 5:30 at hourly intervals and six were in the LVF (6:30 to 11:30). For each colour region (blue or green) there were 168 trials made up from 42 trials for each
condition: within-category left, within-category right, between-category left and between-category right, presented in a random order for each subject across trials. The green and blue regions were tested in separate blocks, with approximately half of each group (training and control) doing blue followed by green, and the remainder doing the reverse.
Procedure
A trial sequence consisted of a white fixation cross on a black background for 1000 ms, followed by the test display with the target appearing for 250 ms, on the coloured background, which remained present until a response
was made. The cycle then repeated. The task was to decide whether the target appeared to the left or right of fixation. Responses were made on a games pad (PCL RP100) with the left index finger indicating left, and the right index finger indicating right. A high-resolution timer DLL (ExactTics) ensured accurate event timing. Reaction times were measured from the onset of the target display until a response was made. No feedback was given during either practice or experimental trials.
3. Results
Training Results
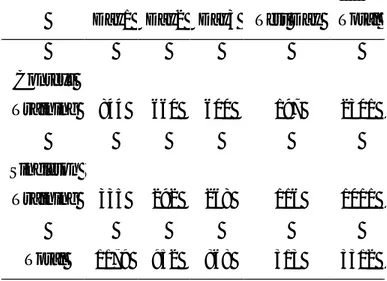
Table 2 shows the mean number of trials across subjects for both types of training across training days and test day. There appears to be a reduction in the number of context training trials across the days of training, especially on the second day. A similar pattern is present for the singleton training trials; however, the improvement is mainly on the second day.
@@ Insert Table 2 here
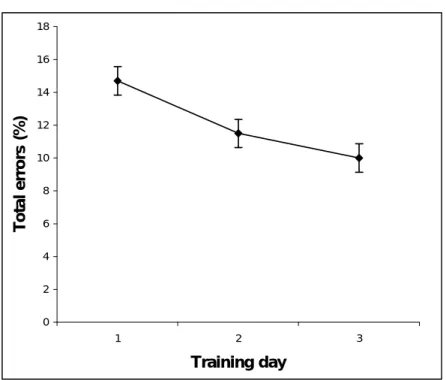
Errors in context training across the training days. The percentage of
incorrect context training classifications across all blocks for all three training days was calculated for each subject. Data were analysed with ANOVAs and follow up t-tests; all reported effects were significant at least p<.05. As Figure 4 shows, errorsreduced across the training days.
@@ Insert Figure 4 about here
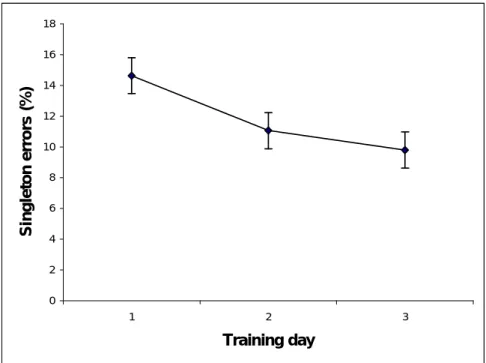
Errors in singleton training across the three training days. The percentage
of incorrect classifications for each day on the ‘singleton’ training trials were calculated for each subject and these are shown in Figure 5. These
were analysed in the same way as for context training. Participants made fewer errors on the second day than on the first day; however, there was not much improvement on the third day.
@@ Insert Figure 5 about here
Target Detection Results
There were far more errors made in the blue region (~ 30%) than in the green region (~ 2%) by both groups, and therefore the data for two regions were analysed separately. Analysis of the green region is reported first followed by the analysis of the blue region. The initial analyses were three-way ANOVAs: category (within/between) by visual field (LVF/RVF) by group (trained/control), with the first two factors being repeated measures. Separate follow-up two-way ANOVAS (category by field) for each group were conducted if the three-way interactions were significant, and they are reported under separate sub-headings.
Green region
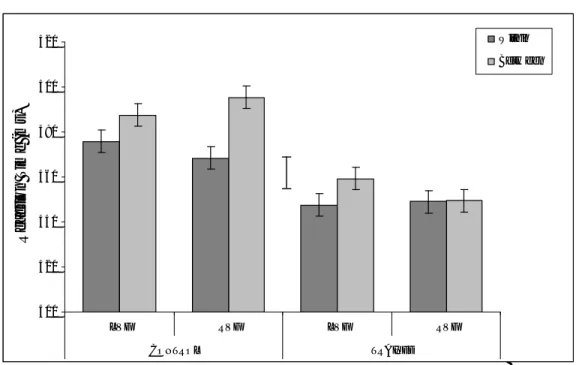
The percentage of correct responses was calculated for each participant, for each combination of category and visual field. The means across subjects were very similar for the two groups (97.81% and 98.83% for the control and training groups respectively). For each subject, median response times (RTs) for correct trials were calculated for each combination of category (within/between) and visual field (LVF/RVF) for each observer. Figure 6 shows the mean RTs across subjects (mean of the subject’s median RTs) for each group.
Analysis showed that within-category responses were about 13 ms faster than between-category responses. In addition, there was a strong 3-way interaction between visual field, category and group. From Figure 6, this appears to be due to the category effect for the trained group in the LVF differing from all the other group-by-visual-field combinations. Specifically, in all combinations, there appears to a reverse-category effect (within- < between-category), whereas for the training group in the RVF within- and between-category conditions are virtually identical.
Control group. Analysing the groups separately showed that for the control
group, there was a significant reverse category effect (means: 472 ms and 491 ms for within- and between-category respectively). In addition, as can be seen in Figure 6, this appears to be due to the larger reverse category effect for the RVF than for the LVF: the reverse category effect was on average 17 ms larger in the RVF than in the LVF.
Trained group. For the trained group, the within-and between-category RTs
did not differ. However, there was a two-way category by field interaction. As Figure 6 shows, the interaction reflects a reverse category effect for the LVF, but no such effect for the RVF. Training has nullified the strong RVF reverse category effect shown by the control group.
Blue region
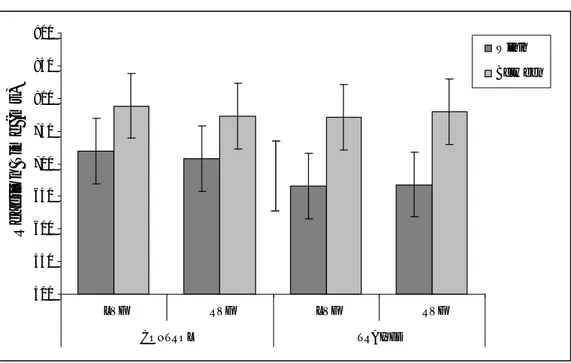
The percentage of correct responses was calculated for each combination of visual field (LVF/RVF), category (within/between) and group
(trained/control). The percentage of correct responses for the control group was 66.38%, and for the trained group was 72.90%. In addition, participants were more accurate on within- than between-category trials (73.09% versus 66.19% respectively. All other main effects and interactions were not significant. Figure 7 shows the mean RTs for each combination of visual field (LVF/RVF), category (within-between-category), and group (trained/
control). A large reverse category effect of about 90 ms was observed. Nothing else approached significance.
@@ Insert Figure 7 about here
To check that the similar RTs for the two groups were not due to different speed-error trade off functions for the two groups, the above ANOVA was repeated with accuracy as a covariate. The analysis revealed essentially the same pattern as the ANOVA with category being the only significant effect.
4. Discussion
The trained group were making approximately 10% classification errors at the end of training. All performance measures converge to indicate that categorisation improved significantly. However, the largest change occurred between day 1 and day 2 with relatively little change between day 2 and day 3. A prominent feature of the results was that, as expected, there was a clear pre-existing ‘reverse-category’ effect: discrimination around the category prototypes was worse than discrimination either side of the prototype. This was true for both colour regions. Thus, as in Özgen and Davies (2002), if training were to induce CP around the newly learned boundary, the reverse-category effect had itself to be reversed. Moreover, the reverse-reverse-category effect for the controls was primarily present in the LH; if induced CP were to be lateralised to the LH as expected, the scale of the required reversal would be particularly severe. In fact, the training group did not show CP around the new boundary after training. However, there are strong indications that the induction of CP was underway. The reverse category effect was eliminated in the RVF for the training group, consistent with between-category expansion and acquired distinctiveness. It seems likely that with more training, full CP may have been induced. Performance in the blue region indicates that the partially induced CP resulted from category
learning rather than some odd pre-existing difference between the two groups. All combinations of visual field and group showed a clear reverse-category effect, and there were no differences between the control and training groups. Additionally, the results for the blue region show that the effects of training were restricted to the training region, as with Özgen & Davies (2002).
We were surprised that the target detection for blue colours was much harder than for green colours. Özgen and Davies found that they were about equally difficult. Moreover, the test colours were chosen so that the target-background differences in the two regions were the same number of
Munsell Hue steps. One possible reason for poor performance for blue pairs is that detection time as measured by simple RT is substantially slower for good blues than for any other colour (McKeefry, Parry & Murray, 2003). Detecting a blue target, relies almost entirely on the short-wavelength retinal cone (S cone), and the responses of the S cone appear to be slower than those of the long medium and long-wavelength cone (see. e.g., Bompas & Sumner, 2008). Özgen and Davies used target colours presented at fixation, and they remained on the monitor until a response was made. In addition, their dependent variable was accuracy rather than RT. In the present experiment, to fulfil the requirements of lateralising the stimuli, the target was presented away from fixation, and for just 250 ms. It appears that this is not long enough for reliable detection of a blue target.
As Özgen and Davies (2002) argued, category training could provide an intensive version of the category learning undergone by children learning colour terms. The fact that the learning effect was restricted to the LH is consistent with previous studies showing that LH colour CP only occurs if the boundary is within the linguistic repertoire of the individual (Roberson et al., 2007; Franklin et al., 2008b).
Neuro-physiological evidence shows changes resulting from practice at early stages of visual processing. For instance, small changes have been observed in the slope of neural tuning within V1 resulting from practice on an orientation discrimination task (Schoups et al., 2001). Moreover, on the target detection task, target-pop-out is unlikely to be influenced by on-line labelling. On these grounds, it appears that genuine perceptual change must have occurred. Nevertheless, labelling may have been used during
categorisation training. Although not required to, participants may have generated labels to help them learn the new categories, and these personal labels could have been available to them to affect performance (somehow) on the target detection task. The LH lateralisation of the learning effect is consistent with the possibility that language (albeit implicitly) may be involved even in these seemingly low-level tasks. Alternatively, learning, possibly guided by labelling, could have induced changes in perceptual representations in the LH that were different to changes produced in the RH. In conclusion, the findings suggest that category training leads to greater perceptual change in the LH than the RH.
References
Bompas, Aline & Petroc Sumner. 2008. “Sensory sluggishness dissociates saccadic, manual, and perceptual responses: An S-cone study”. Journal
of Vision 8(8):10. 1-13.
Drivonikou, Gilda V., Paul Kay, Terry Regier, Richard Ivry, Aubrey Gilbert, Anna Franklin & Ian R.L. Davies. 2007. “Further evidence that Whorfian effects are stronger in the right visual field than the left”.
Proceedings of the National Academy of Sciences 104.1097-1102.
Drivonikou, Gilda V., Ian R.L. Davies, Anna Franklin & Chloe Taylor. 2007. “Lateralisation of colour categorical perception: a cross-cultural study”. Perception 6 ECVP Abstract Supplement.
Fletcher, Robert. 1980. City colour vision test. Windsor: Keeler Ltd. Franklin, Anna, Gilda V. Drivonikou, Laura Bevis, Ian R.L. Davies, Paul
Kay & Terry Regier. 2008. “Infants categorize colour with the right hemisphere: adults show a left hemisphere bias”. Proceedings of the
National Academy of Sciences 105.3221-3225
Franklin, Anna, Gilda V. Drivonikou, Ally Clifford, Paul Kay, Terry Regier, & Ian R.L. Davies. 2008. “Lateralisation of categorical perception of colour
changes with colour term acquisition”. Proceedings of the National
Academy of Sciences 105. 18221-18225.
Gilbert, Aubrey, Terry Regier, Paul Kay & Richard Ivry. 2006. “Whorf hypothesis is supported in the right visual field but not the left”.
Proceedings of the National Academy of Sciences 103.489-494.
Goldstone, Robert. 1994. “Influences of categorisation on perceptual discrimination”. Journal of Experimental Psychology: General 123.178-200.
Goldstone, Robert. 1998. “Perceptual learning”. Annual Review of
Goldstone, Robert, Yvonne Lippa & Richard Shiffrin. 2001. “Altering object representations through category learning”. Cognition 78.27-43. Guenther, Frank, Fatima Husain, Michael Cohen & Barbara
Shinn-Cunningham. 1999. “Effects of categorisation and discrimination
training on auditory perceptual space”. Journal of the Acoustical Society
of America 106.2900-2912.
Harnad, Stevan. (1987). “Psychophysical and cognitive aspects of categorical perception: A critical overview”. In Stevan. Harnad (Ed.),
Categorical Perception: The groundwork of Cognition. (pp. 535-565).
Cambridge: Cambridge University Press.
Kuhl, Patricia. 1991. “Human adults and human infants show a ‘perceptual magnet effect’ for the prototypes of speech categories, monkeys do not”.
Perception & Psychophysics 50.93-107.
McKeefry, Declan, Neil Parry, & Ian Murray. 2003. “Simple reaction times in colour space: The influence of chromaticity, contrast and cone opponency.” Investigative Ophthalmology and Visual Science. 44. 2267-2276.
Özgen, Emre & Ian R.L. Davies. 2002. “Acquisition of categorical colour perception: a perceptual learning approach to the Linguistic Relativity Hypothesis”. Journal of Experimental Psychology: General 131.477-493.
Roberson, Debi, Hyensou Pak & Richard Hanley. 2008. “Categorical perception of colour in the left and right hemisphere is verbally mediated: evidence from Korean”. Cognition 107.752-762.
Schoups, Aniek, Rufin Vogels, Ning Qian, & Guy Orban. 2001. “Practising orientation identification improves orientation coding in V1 neurons”.
Nature 412 (6846). 549-551.
Schyns, Philippe, Robert Goldstone & Jean-Pierre Thibaut 1998. “The development of features in object concepts”. Behavioral and Brain
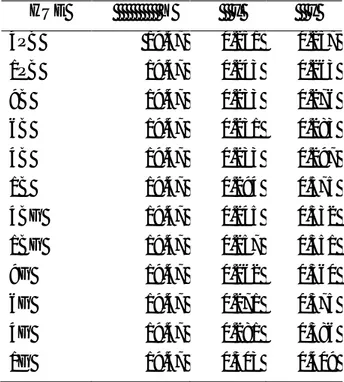
Table 1. CIE (1931), Y, x, y chromaticity co-ordinates of the stimuli. White point of monitor as measured on screen: Y = 64.80 cd/m2. The stimuli emulated a reflectance of 30.05. HUE Y x y 4PB 19.47 0.251 0.257 1PB 19.47 0.243 0.263 9B 19.47 0.233 0.276 6B 19.47 0.231 0.283 4B 19.47 0.233 0.297 1B 19.47 0.294 0.575 4BG 19.47 0.245 0.332 1BG 19.47 0.257 0.351 9G 19.47 0.262 0.360 6G 19.47 0.271 0.375 4G 19.47 0.281 0.386 1G 19.47 0.303 0.409
Table 2. Mean number of trials taken to complete context and single colour training across the three days of training and on the testing day (refresher training).
Day1 Day2 Day3 Test Day Total Context Training 844 660 600 197 2301 Singleton Training 335 292 268 116 1011 Total 1179 952 868 313 3312
Figure Captions
Figure 1. Neural pathways from the eye to brain viewed from above: each half-visual field is initially represented in the contralateral visual cortex.
Figure 2. Illustration of stimuli in context training. The central green square has to be categorised by placing it either to the left or to the right among stimuli in the same category.
Figure 3. a) The pairs of the stimuli used in the green colour region. Dashed line represents the new boundary (7.5G): there are two within-category pairs, and two between-category pairs. The range of the trained region was from 5BG to 10GY. b) The pairs used in the blue colour region.
Figure 4. Total percentage errors across the three days of training. Error bars are within-subjects 95% confidence intervals.
Figure 5. Error percentages on ‘singleton’ training across the three training days. Error bars are within-subjects 95% confidence intervals.
Figure 6. Green region: mean RTs for target detection for the control and the trained group for each combination of visual field and category. Error bars represent 95% within-subject confidence intervals calculated by using the error term from the three-way interaction. Between-subjects 95% CL calculated by using the between groups error term is shown as the separate error bar.
Figure 7. Blue region: Mean RTs for target detection for the control and the trained group for each combination of visual field and category. Error bars
represent 95% within-subject confidence intervals calculated by using the error term from the three-way interaction. Between-subjects 95% CL calculated by using the between groups error term is shown as the separate error bar.
Figure 2
Figure 3 within-category between-category 5BG 4BG 1BG 9G 6G 4G 1G 10GY between-category within-category 4PB 1PB 9B 6B 4B 1B 3a. 3b.
Figure 4 0 2 4 6 8 10 12 14 16 18 1 2 3 Training day T o ta l e rr o rs ( % )
Figure 5 0 2 4 6 8 10 12 14 16 18 1 2 3 Training day S in g le to n e rr o rs ( % )
Figure 6 400 420 440 460 480 500 520 LVF RVF LVF RVF CONTROL TRAINED R e a c ti o n T im e ( m s ) Within Betw een
Figure 7 500 550 600 650 700 750 800 850 900 LVF RVF LVF RVF CONTROL TRAINED R e a c ti o n T im e ( m s ) Within Betw een